

Abstract
AIM: To verify gene expression profiles for colorectal cancer using 12 internet public microarray datasets.
METHODS: Logistic regression analysis was performed, and odds ratios for each gene were determined between colorectal cancer (CRC) and controls. Twelve public microarray datasets of GSE 4107, 4183, 8671, 9348, 10961, 13067, 13294, 13471, 14333, 15960, 17538, and 18105, which included 519 cases of adenocarcinoma and 88 normal mucosa controls, were pooled and used to verify 17 selective genes from 3 published studies and estimate the external generality.
RESULTS: We validated the 17 CRC-associated genes from studies by Chang et al (Model 1: 5 genes), Marshall et al (Model 2: 7 genes) and Han et al (Model 3: 5 genes) and performed the multivariate logistic regression analysis using the pooled 12 public microarray datasets as well as the external validation. The goodness-of-fit test of Hosmer-Lemeshow (H-L) showed statistical significance (P = 0.044) for Model 2 of Marshall et al in which observed event rates did not match expected event rates in subgroups of the model population. Expected and observed event rates in subgroups were similar, which are called well calibrated, in Models 1, 3 and 4 with non-significant P values of 0.460, 0.194 and 1.000 for H-L tests, respectively. A 7-gene model of CPEB4, EIF2S3, MGC20553, MS4A1, ANXA3, TNFAIP6 and IL2RB was pairwise selected, which showed the best results in logistic regression analysis (H-L P = 1.000, R2 = 0.951, areas under the curve = 0.999, accuracy = 0.968, specificity = 0.966 and sensitivity = 0.994).
CONCLUSION: A novel gene expression profile was associated with CRC and can potentially be applied to blood-based detection assays.
Keywords: Gene expression profiles, Colorectal cancer, Microarray, Gene Expression Omnibus, Gene Expression Omnibus, Gene Expression Omnibus series
Core tip: In the future, the 7-gene (CPEB4, EIF2S3, MGC20553, MS4A1, ANXA3, TNFAIP6 and IL2RB) logistic regression model that showed the best results can be further verified for more samples. Meanwhile, the causal relations are needed to confirm among the selected genes and colorectal cancer (CRC). The expression signature of these CRC-associated genes can be evaluated for early detection of CRC. Early detection can thus improve survival in patients before symptoms are detectable, during treatment, or during remission.
INTRODUCTION
Colorectal cancer (CRC) is a common cancer worldwide[1] and considered to be among the most frequent causes of death, along with lung, prostate and breast cancer[2]. CRC screening could reduce the incidence of advanced disease and provide better overall, progression-free survival[3].
Microarray analysis has enabled the identification of gene signatures for diagnosis, molecular characterization, prognosis prediction and treatment prediction[4]. However, there remains a lack of clinically useful biomarkers for cancers[5]. The translation of microarray studies into clinical practice is still far from complete for three reasons: (1) the lack of comparison and overlap of results obtained from each individual study[6-8]; (2) the lack of large-scale studies due to the small number of available samples without enough large statistical power[9]; and (3) the difficulty in selecting the data that would be informative for developing a reliable clinical application[4]. The study pooled the dataset of microarrays from different research teams in the Gene Expression Omnibus (GEO) database to increase sample size, sample heterogeneity and statistical power, in the hope of addressing the issue of insufficient sample size presented in previous studies.
In the present study, 17 selective genes from 3 studies (Model 1: 5 genes[10]; Model 2: 7 genes[11]; Model 3: 5 genes[12]) were validated by pooling 12 public microarray data sets as well as the external validation. Sensitivity, specificity, accuracy, positive and negative predictive values, and the areas under the curves (AUCs) of the discrimination models are reported. Meanwhile, genes correlated with CRC were selected, and a discrimination model was constructed using multivariate logistic regression.
MATERIALS AND METHODS
Public internet microarray datasets
As shown in Figure 1, the microarray gene expression data were from searches using “colon cancer” and “human [organism]” and “expression profiling by array [dataset type]” as the key words in the GEO database of the National Center for Biotechnology Information (NCBI). The eligible criteria were: (1) the examined samples were frozen tissue sections of normal human colorectal mucosa, primary CRC or hepatic metastases from CRC; (2) the microarray platform used was limited to single-color, whole genome gene chips from Affymetrix; and (3) the data were presented as gene expression level. The exclusion criteria were (1) data from cultured cell lines or other in vitro assays; (2) datasets without the original gene expression level data files; and (3) those with redundant sub-datasets. A total of 178 (190-12 = 178) GEO series (GSE) datasets were finally excluded, leaving 12 public microarray datasets of GSE 4107, 4183, 8671, 9348, 10961, 13067, 13294, 13471, 14333, 15960, 17538, and 18105, which included 519 cases of adenocarcinoma and 88 normal mucosa controls. Furthermore, we validated the 17 CRC-associated genes from studies by Quyun et al[10] and Chang et al[13] (Model 1: 5 genes), Marshall et al[11] (Model 2: 7 genes) and Han et al[12] (Model 3: 5 genes) and performed the multivariate logistic regression analysis using the pooled 12 public microarray datasets as well as the external validation. The statistical power is 100% for each candidate gene calculated via the Sample Size Calculator[14]. The statistical alpha level was 0.05.
Figure 1.
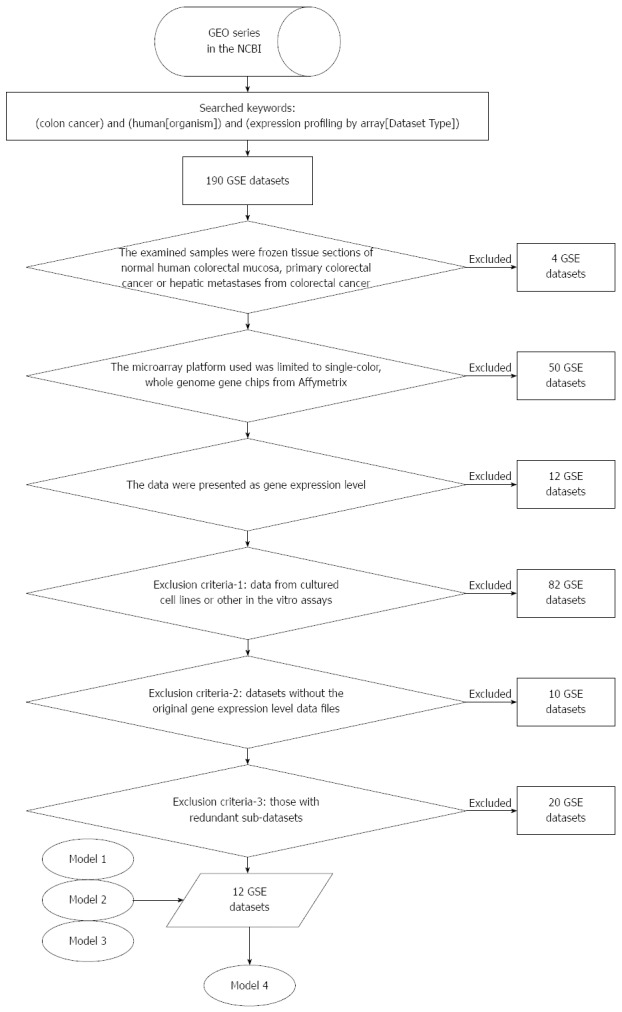
Process of pooling 12 microarray gene expression datasets. Model 1: 5 selective genes from the study by Quyun et al[10] and Chang et al[13]; Model 2: 7 selective genes from the study by Marshall et al[11]; Model 3: 5 selective genes from the study by Han et al[12]; Model 4: 7 selective genes from Models 1, 2 and 3. GEO: Gene Expression Omnibus; GSE: GEO series.
Preprocessing of microarray data
We used the GC Robust Multi-array Average method and R language software 8 to remove the chip background associated with the microarray gene expression levels. The expression levels of the probe sets were converted into gene expression levels. Because the probe expression levels showed a skewed distribution, the median probe expression level was selected to represent the gene expression level. Affymetrix chips were HG-U133A, HG-U133A-2 and HG-U133-Plus-2, and after the conversion, the corresponding numbers of genes were 14713, 14704 and 33727. The 12 datasets were finally merged to obtain the expression levels of 14698 genes, followed by the quantile normalization of all gene expression values.
Modeling analysis and verifications
The 1000 bootstrapping rounds were used to avoid the poor extrapolation of the selected candidate genes. Multivariate logistic regression was used to analyze the relationship of the cases and controls to the 17 candidate genes. The logistic probabilities were calculated using the modeling equations from logistic regression analysis. Discriminative performances were further used to evaluate models, including sensitivity and specificity. We used the Hosmer-Lemeshow test to check goodness-of-fit. A receiver operating characteristic (ROC) curve analysis was performed to determine the cut-off logistic probabilities and the AUC, to identify the performance of each candidate gene and combinations of multiple genes.
RESULTS
Pooling 12 microarray studies to verify the 17 selective genes and estimate the external generality
We performed the multivariate logistic regression analysis for pooled 12 public microarray datasets as well as the external validation to verify the CRC-associated genes from 3 studies[10-12]. As shown in Tables 1 and 2, we validated the 17 CRC-associated genes from 3 studies (Model 1: 5 genes, Model 2: 7 genes and Model 3: 5 genes) by pooling 12 public microarray datasets of GSE 4107, 4183, 8671, 9348, 10961, 13067, 13294, 13471, 14333, 15960, 17538, and 18105, which included 519 cases of adenocarcinoma and 88 normal mucosa controls. The goodness-of-fit test of Hosmer-Lemeshow (H-L) showed statistical significance (P = 0.044) for Model 2 of Marshall et al[11] in which observed event rates did not match expected event rates in subgroups of the model population. Expected and observed event rates in subgroups were similar, which are called well calibrated, in Models 1, 3 and 4 with non-significant P-values of 0.460, 0.194 and 1.000 for H-L tests, respectively. A 7-gene model (Model 4 with genes CPEB4, EIF2S3, MGC20553, MS4A1, ANXA3, TNFAIP6 and IL2RB) pairwise selected from genes of Models 1, 2 and 3 showed the best results in logistic regression analysis (H-L P = 1.000, r2 = 0.951, AUC = 0.999, accuracy = 0.968, specificity = 0.966 and sensitivity = 0.994).
Table 1.
Characteristics of the studies
| Ref. | Year | Paper title | CRC+ | CRC- | Number of genes |
| Han et al[12] | 2008 | Novel blood-based, five-gene biomarker set for the detection of colorectal cancer | 101 | 110 | 5 |
| Marshall et al[11] | 2010 | A blood-based biomarker panel for stratifying current risk for colorectal cancer | 202 | 208 | 7 |
| Quyun et al[10] | 2010 | Recent patents and advances in genomic biomarker discovery for colorectal cancers | 111 | 227 | 5 |
CRC+: Colorectal cancer cases; CRC-: Colorectal cancer controls.
Table 2.
Logistic regression models for pooled 12 microarray datasets as the external validation of colorectal cancer-associated genes from 3 studies
| Genes |
Model 1 |
Model 2 |
Model 3 |
Model 4 |
||||||||
| B | SE | P value | B | SE | P value | B | SE | P value | B | SE | P value | |
| 5 Selective genes of this study | ||||||||||||
| MDM2 | 6.069 | 1.461 | < 0.001 | |||||||||
| DUSP6 | 1.360 | 0.235 | < 0.001 | |||||||||
| CPEB4 | -3.177 | 0.383 | < 0.001 | -4.423 | 1.160 | < 0.001 | ||||||
| MMD | 0.335 | 0.442 | 0.448 | |||||||||
| EIF2S3 | 1.462 | 0.244 | < 0.001 | 2.604 | 0.856 | 0.002 | ||||||
| 7 Selective genes of Marshall et al[11] | ||||||||||||
| ANXA3 | 0.559 | 0.212 | 0.008 | 1.566 | 0.485 | 0.001 | ||||||
| CLEC4D | 46.259 | 9.918 | < 0.001 | |||||||||
| LMNB1 | 1.883 | 0.330 | < 0.001 | |||||||||
| PRRG4 | -1.284 | 0.371 | 0.001 | |||||||||
| TNFAIP6 | 1.787 | 0.377 | < 0.001 | 2.0031 | 0.572 | < 0.001 | ||||||
| VNN1 | 0.207 | 0.159 | 0.194 | |||||||||
| IL2RB | 0.269 | 0.216 | 0.213 | 1.824 | 0.637 | 0.004 | ||||||
| 5 Selective genes of Han et al[12] | ||||||||||||
| CDA | -0.496 | 0.090 | < 0.001 | |||||||||
| MGC20553 | -1.386 | 0.197 | < 0.001 | -1.751 | 0.619 | 0.005 | ||||||
| BANK1 | 0.570 | 0.373 | 0.129 | |||||||||
| BCNP1 | -0.944 | 1.148 | 0.411 | |||||||||
| MS4A1 | -1.483 | 0.457 | 0.001 | -1.907 | 0.590 | 0.001 | ||||||
| P value for H-L | 0.460 | 0.044 | 0.194 | 1.000 | ||||||||
| R2 | 0.853 | 0.841 | 0.693 | 0.933 | ||||||||
| AUC | 0.978 | 0.985 | 0.957 | 0.999 | ||||||||
| Accuracy | 0.949 | 0.974 | 0.939 | 0.990 | ||||||||
| Specificity | 0.818 | 0.886 | 0.716 | 0.966 | ||||||||
| Sensitivity | 0.971 | 0.988 | 0.977 | 0.994 | ||||||||
Model 1: 5 selective genes from the study by Quyun et al[10] and Chang et al[13]; Model 2: 7 selective genes from the study by Marshall et al[11]; Model 3: 5 selective genes from the study by Han et al[12]; Model 4: 7 selective genes from Models 1, 2 and 3; H-L: Hosmer and Lemeshow test; R2: Nagelkerke R Square; AUC: Area under receiver operating characteristic curve.
DISCUSSION
Many studies[15-19] have developed accurate, reliable and less invasive tests for detecting CRC using tissue or blood samples by microarray and qPCR validation. In general, the present study is an alternative effort to establish a standard testing procedure and to confirm the profile performance. Genes clinically confirmed to be cancer-associated in tumor tissues are chosen for selection and validation in peripheral blood samples. According to the results of the present study, the selected genes can be verified by collecting new samples in the future work.
Marshall et al[11] and Han et al[12] used different gene sets to detect CRC by similar screening approaches. The two gene sets were obtained by direct selection from differentially expressed genes in peripheral blood samples using microarray techniques followed by real-time PCR. The biomarkers they selected may more or less reflect the static and dynamic changes of the immune system in response to cancer. However, although these two studies used similar approaches and some overlapped samples, reported respective profiles cover no genes in common with the profile of 5 genes from the study by Quyun et al[10] and Chang et al[13]. The absence of concordant genes also exists in the study by Xu et al[19], which could be related to differences in studying samples and genes coming out from the upstream or downstream of oncogenic and anti-oncogenic pathways, because supposedly they all performed perfect gene quantification and statistical analysis to develop particular CRC gene expression profiles. The present study intended to rapidly converge and verify these promising biomarkers using pooling external validation and public microarray GSE datasets in GEO of NCBI before the further practical uses and clinical implementation.
Common serum tumor markers used in primary care practice have not demonstrated a survival benefit in randomized controlled trials for screening in the general population. Most of them showed elevated levels only in some early-stage or late-stage cancer patients[20]. A recent review of real-time PCR-based assays with single molecular markers, such as CEA, CK19, and CK20, demonstrated low sensitivities, ranging from 4% to 35.9%, 25.9% to 41.9%, and 5.1% to 28.3%, respectively[21]. One study was performed with a newly identified molecular marker known as ProtM[22].
Circulating cancer cells from any cancer type are capable of disseminating from solid tumor tissues, penetrating and invading blood vessels and circulating in the peripheral blood[23,24]. The number of circulating tumor cells has been used to predict the clinical outcome of cancer patients[25,26]. On the basis of the presence of circulating tumor cells, five molecular markers, MDM2, DUSP6, CPEB4, MMD, and EIF2S3, were identified to have differential expression between peripheral blood samples of CRC patients and healthy controls. Two reports[11,12] used different gene sets to detect CRC by similar screening approaches. The two gene sets were obtained by direct selection from differentially expressed genes in peripheral blood samples using microarray techniques followed by real-time PCR. The biomarkers they selected may more or less reflect the static and dynamic changes of the immune system in response to cancer. In our study, genes clinically confirmed to be cancer-associated in tumor tissues were chosen for selection and validation in peripheral blood samples.
Both mRNAs and proteins in the peripheral blood have been tested for diagnostic use to detect circulating tumor cells of different solid tumors or to determine prognoses of various cancers. We confirmed that the AUCs of the discrimination models greatly improved from 0.957 for a single model[10-12] to 0.999 for the combined model (a 7-gene model). An increasing number of clinical studies show improvements in the sensitivity of cancer detection by assaying transcript levels of multiple genes in patients’ peripheral blood[27].
The genes identified here for discrimination between CRC patients and healthy controls might be useful in evaluating the therapeutic responses and prognoses of CRC patients. They could also be selected as targets for the development of therapies because of their strong association with CRC. MDM2 is a negative regulator of the tumor suppressor protein p53[28,29]. Higher MDM2 expression has been reported in a variety of human stromal and epithelial malignancies[30-33], including CRC[34,35]. DUSP6, which is also known as MAPK phosphatase 3 (MKP3), inactivates MAPK1/ERK2[36-39]. Elevated DUSP6 transcript levels have been reported as a risk factor for poor prognosis in non-small cell lung cancer patients[40] and tamoxifen resistance in breast cancer patients[41]. In contrast, DUSP6 is a candidate tumor suppressor gene in pancreatic cancer[39] and primary human ovarian cancer cells. CPEB4 binds to the cytoplasmic polyadenylation element (CPE) of target mRNAs and controls cytoplasmic polyadenylation and translational activation during development[42-45]. MMD is an integral membrane protein with seven putative transmembrane segments[46,47]. Its biological function is still unclear. EIF2S3 is the largest subunit (gamma) of eukaryotic translation initiation factor 2 (EIF2)[48] and might be indirectly involved in inhibition of prostate cancer metastasis through N-myc downstream regulated gene 1[49]. DUSP6, CPEB4, MMD and EIF2S3 were for the first time associated with CRC in this study.
Furthermore, we verified the CRC-associated genes by pooling 12 public microarray datasets. In the future, the 7-gene logistic regression model (Model 4: CPEB4, EIF2S3, MGC20553, MS4A1, ANXA3, TNFAIP6 and IL2RB) that showed the best results can be further verified in more samples. Meanwhile, the causal relations are needed to confirm among the selected genes and CRC. The expression signature of these CRC-associated genes should be evaluated for early detection of CRC, with more samples randomly screened from the population; in addition, subjects who eventually receive a diagnosis of CRC should be evaluated as well. Early CRC detection could provide inherent benefits to the patient and could also enable screening for post-operative residual tumor cells and occult metastases, an early indicator of tumor recurrence. Early detection could thus improve survival in patients before symptoms are detectable, during treatment, or during remission.
In conclusion, we found that the expression profile of 7 genes, CPEB4, EIF2S3, ANXA3, TNFAIP6, IL2RB, MGC20553 and MS4A1, is highly associated with CRC. Detection of cancer cell-specific biomarkers in the peripheral blood can be an effective screening strategy for CRC.
COMMENTS
Background
Polymerase chain reaction (PCR)-based analyses of cytokeratin, carcinoembryonic antigen (CEA), and epidermal growth factor receptor mRNAs in peripheral blood samples from colorectal cancer (CRC) patients have been reported. However, the low sensitivities and specificities for these well-known genes are not considered acceptable for the detection of CRC.
Research frontiers
Many studies have developed accurate, reliable and less invasive tests for detecting CRC using tissue or blood samples by microarray and qPCR validation. In general, the present study is an alternative effort to establish a standard testing procedure and to confirm the profile performance. Genes clinically confirmed to be cancer-associated in tumor tissues are chosen for selection and validation in peripheral blood samples.
Innovations and breakthroughs
The 7-gene logistic regression model (Model 4: CPEB4, EIF2S3, MGC20553, MS4A1, ANXA3, TNFAIP6 and IL2RB) that showed the best results can be further verified in more samples. Meanwhile, the causal relations are needed to confirm among the selected genes and CRC.
Applications
The authors found that the expression profile of 7 genes, CPEB4, EIF2S3, ANXA3, TNFAIP6, IL2RB, MGC20553 and MS4A1, is highly associated with colorectal cancer. Detection of cancer cell-specific biomarkers in the peripheral blood can be an effective screening strategy for CRC.
Peer review
The authors mainly focus on verifying gene expression profiles for colorectal cancer using 12 internet public microarray datasets. The results suggest that a novel gene expression profile was associated with CRC and can potentially be applied to blood-based detection assays.
Footnotes
P- Reviewer: Ferlini C, Wang YD S- Editor: Zhai HH L- Editor: Wang TQ E- Editor: Liu XM
References
- 1.Parkin DM, Bray F, Ferlay J, Pisani P. Global cancer statistics, 2002. CA Cancer J Clin. 2005;55:74–108. doi: 10.3322/canjclin.55.2.74. [DOI] [PubMed] [Google Scholar]
- 2.Labianca R, Beretta GD, Kildani B, Milesi L, Merlin F, Mosconi S, Pessi MA, Prochilo T, Quadri A, Gatta G, et al. Colon cancer. Crit Rev Oncol Hematol. 2010;74:106–133. doi: 10.1016/j.critrevonc.2010.01.010. [DOI] [PubMed] [Google Scholar]
- 3.Jemal A, Siegel R, Ward E, Hao Y, Xu J, Murray T, Thun MJ. Cancer statistics, 2008. CA Cancer J Clin. 2008;58:71–96. doi: 10.3322/CA.2007.0010. [DOI] [PubMed] [Google Scholar]
- 4.Nannini M, Pantaleo MA, Maleddu A, Astolfi A, Formica S, Biasco G. Gene expression profiling in colorectal cancer using microarray technologies: results and perspectives. Cancer Treat Rev. 2009;35:201–209. doi: 10.1016/j.ctrv.2008.10.006. [DOI] [PubMed] [Google Scholar]
- 5.Lancashire LJ, Lemetre C, Ball GR. An introduction to artificial neural networks in bioinformatics--application to complex microarray and mass spectrometry datasets in cancer studies. Brief Bioinform. 2009;10:315–329. doi: 10.1093/bib/bbp012. [DOI] [PubMed] [Google Scholar]
- 6.Cardoso J, Boer J, Morreau H, Fodde R. Expression and genomic profiling of colorectal cancer. Biochim Biophys Acta. 2007;1775:103–137. doi: 10.1016/j.bbcan.2006.08.004. [DOI] [PubMed] [Google Scholar]
- 7.Sagynaliev E, Steinert R, Nestler G, Lippert H, Knoch M, Reymond MA. Web-based data warehouse on gene expression in human colorectal cancer. Proteomics. 2005;5:3066–3078. doi: 10.1002/pmic.200402107. [DOI] [PubMed] [Google Scholar]
- 8.Shih W, Chetty R, Tsao MS. Expression profiling by microarrays in colorectal cancer (Review) Oncol Rep. 2005;13:517–524. [PubMed] [Google Scholar]
- 9.Chan SK, Griffith OL, Tai IT, Jones SJ. Meta-analysis of colorectal cancer gene expression profiling studies identifies consistently reported candidate biomarkers. Cancer Epidemiol Biomarkers Prev. 2008;17:543–552. doi: 10.1158/1055-9965.EPI-07-2615. [DOI] [PubMed] [Google Scholar]
- 10.Quyun C, Ye Z, Lin SC, Lin B. Recent patents and advances in genomic biomarker discovery for colorectal cancers. Recent Pat DNA Gene Seq. 2010;4:86–93. doi: 10.2174/187221510793205764. [DOI] [PubMed] [Google Scholar]
- 11.Marshall KW, Mohr S, Khettabi FE, Nossova N, Chao S, Bao W, Ma J, Li XJ, Liew CC. A blood-based biomarker panel for stratifying current risk for colorectal cancer. Int J Cancer. 2010;126:1177–1186. doi: 10.1002/ijc.24910. [DOI] [PubMed] [Google Scholar]
- 12.Han M, Liew CT, Zhang HW, Chao S, Zheng R, Yip KT, Song ZY, Li HM, Geng XP, Zhu LX, et al. Novel blood-based, five-gene biomarker set for the detection of colorectal cancer. Clin Cancer Res. 2008;14:455–460. doi: 10.1158/1078-0432.CCR-07-1801. [DOI] [PubMed] [Google Scholar]
- 13.Chang YT, Huang CS, Yao CT, Su SL, Terng HJ, Chou HL, Chou YC, Chen KH, Shih YW, Lu CY, et al. Gene expression profile of peripheral blood in colorectal cancer. World J Gastroenterol. 2014;20:14463–14471. doi: 10.3748/wjg.v20.i39.14463. [DOI] [PMC free article] [PubMed] [Google Scholar]
- 14.The Survey System: Sample Size Calculator. Available from: http://wwwsurveysystemcom/sscalchtm.
- 15.Yip KT, Das PK, Suria D, Lim CR, Ng GH, Liew CC. A case-controlled validation study of a blood-based seven-gene biomarker panel for colorectal cancer in Malaysia. J Exp Clin Cancer Res. 2010;29:128. doi: 10.1186/1756-9966-29-128. [DOI] [PMC free article] [PubMed] [Google Scholar]
- 16.Simi L, Pratesi N, Vignoli M, Sestini R, Cianchi F, Valanzano R, Nobili S, Mini E, Pazzagli M, Orlando C. High-resolution melting analysis for rapid detection of KRAS, BRAF, and PIK3CA gene mutations in colorectal cancer. Am J Clin Pathol. 2008;130:247–253. doi: 10.1309/LWDY1AXHXUULNVHQ. [DOI] [PubMed] [Google Scholar]
- 17.Wu CH, Chung FY, Chang JY, Wang JY. Rapid detection of gene expression by a colorectal cancer Enzymatic Gene Chip Detection Kit. Biomarkers and Genomic Medicine. 2013;5:87–91. [Google Scholar]
- 18.Rosenthal LS. Getting involved in gastroenterology beyond the borders of your fellowship program. Gastrointest Endosc. 2006;64:602–603. doi: 10.1016/j.gie.2006.06.043. [DOI] [PubMed] [Google Scholar]
- 19.Xu Y, Xu Q, Yang L, Ye X, Liu F, Wu F, Ni S, Tan C, Cai G, Meng X, et al. Identification and validation of a blood-based 18-gene expression signature in colorectal cancer. Clin Cancer Res. 2013;19:3039–3049. doi: 10.1158/1078-0432.CCR-12-3851. [DOI] [PubMed] [Google Scholar]
- 20.Perkins GL, Slater ED, Sanders GK, Prichard JG. Serum tumor markers. Am Fam Physician. 2003;68:1075–1082. [PubMed] [Google Scholar]
- 21.Fidler IJ. Critical factors in the biology of human cancer metastasis: twenty-eighth G.H.A. Clowes memorial award lecture. Cancer Res. 1990;50:6130–6138. [PubMed] [Google Scholar]
- 22.Schuster R, Max N, Mann B, Heufelder K, Thilo F, Gröne J, Rokos F, Buhr HJ, Thiel E, Keilholz U. Quantitative real-time RT-PCR for detection of disseminated tumor cells in peripheral blood of patients with colorectal cancer using different mRNA markers. Int J Cancer. 2004;108:219–227. doi: 10.1002/ijc.11547. [DOI] [PubMed] [Google Scholar]
- 23.Bogenrieder T, Herlyn M. Axis of evil: molecular mechanisms of cancer metastasis. Oncogene. 2003;22:6524–6536. doi: 10.1038/sj.onc.1206757. [DOI] [PubMed] [Google Scholar]
- 24.Carmeliet P, Jain RK. Angiogenesis in cancer and other diseases. Nature. 2000;407:249–257. doi: 10.1038/35025220. [DOI] [PubMed] [Google Scholar]
- 25.Cristofanilli M, Hayes DF, Budd GT, Ellis MJ, Stopeck A, Reuben JM, Doyle GV, Matera J, Allard WJ, Miller MC, et al. Circulating tumor cells: a novel prognostic factor for newly diagnosed metastatic breast cancer. J Clin Oncol. 2005;23:1420–1430. doi: 10.1200/JCO.2005.08.140. [DOI] [PubMed] [Google Scholar]
- 26.Cristofanilli M, Budd GT, Ellis MJ, Stopeck A, Matera J, Miller MC, Reuben JM, Doyle GV, Allard WJ, Terstappen LW, et al. Circulating tumor cells, disease progression, and survival in metastatic breast cancer. N Engl J Med. 2004;351:781–791. doi: 10.1056/NEJMoa040766. [DOI] [PubMed] [Google Scholar]
- 27.Shen C, Hu L, Xia L, Li Y. Quantitative real-time RT-PCR detection for survivin, CK20 and CEA in peripheral blood of colorectal cancer patients. Jpn J Clin Oncol. 2008;38:770–776. doi: 10.1093/jjco/hyn105. [DOI] [PubMed] [Google Scholar]
- 28.He J, Reifenberger G, Liu L, Collins VP, James CD. Analysis of glioma cell lines for amplification and overexpression of MDM2. Genes Chromosomes Cancer. 1994;11:91–96. doi: 10.1002/gcc.2870110205. [DOI] [PubMed] [Google Scholar]
- 29.Reifenberger G, Liu L, Ichimura K, Schmidt EE, Collins VP. Amplification and overexpression of the MDM2 gene in a subset of human malignant gliomas without p53 mutations. Cancer Res. 1993;53:2736–2739. [PubMed] [Google Scholar]
- 30.Haidar MA, El-Hajj H, Bueso-Ramos CE, Manshouri T, Glassman A, Keating MJ, Maher A. Expression profile of MDM-2 proteins in chronic lymphocytic leukemia and their clinical relevance. Am J Hematol. 1997;54:189–195. doi: 10.1002/(sici)1096-8652(199703)54:3<189::aid-ajh3>3.0.co;2-s. [DOI] [PubMed] [Google Scholar]
- 31.Bueso-Ramos CE, Manshouri T, Haidar MA, Yang Y, McCown P, Ordonez N, Glassman A, Sneige N, Albitar M. Abnormal expression of MDM-2 in breast carcinomas. Breast Cancer Res Treat. 1996;37:179–188. doi: 10.1007/BF01806499. [DOI] [PubMed] [Google Scholar]
- 32.Bueso-Ramos CE, Manshouri T, Haidar MA, Huh YO, Keating MJ, Albitar M. Multiple patterns of MDM-2 deregulation in human leukemias: implications in leukemogenesis and prognosis. Leuk Lymphoma. 1995;17:13–18. doi: 10.3109/10428199509051698. [DOI] [PubMed] [Google Scholar]
- 33.Bueso-Ramos CE, Yang Y, deLeon E, McCown P, Stass SA, Albitar M. The human MDM-2 oncogene is overexpressed in leukemias. Blood. 1993;82:2617–2623. [PubMed] [Google Scholar]
- 34.Marchetti A, Buttitta F, Pellegrini S, Merlo G, Chella A, Angeletti CA, Bevilacqua G. mdm2 gene amplification and overexpression in non-small cell lung carcinomas with accumulation of the p53 protein in the absence of p53 gene mutations. Diagn Mol Pathol. 1995;4:93–97. doi: 10.1097/00019606-199506000-00004. [DOI] [PubMed] [Google Scholar]
- 35.Marchetti A, Buttitta F, Girlando S, Dalla Palma P, Pellegrini S, Fina P, Doglioni C, Bevilacqua G, Barbareschi M. mdm2 gene alterations and mdm2 protein expression in breast carcinomas. J Pathol. 1995;175:31–38. doi: 10.1002/path.1711750106. [DOI] [PubMed] [Google Scholar]
- 36.Zhou G, Wang H, Liu SH, Shahi KM, Lin X, Wu J, Feng XH, Qin J, Tan TH, Brunicardi FC. p38 MAP kinase interacts with and stabilizes pancreatic and duodenal homeobox-1. Curr Mol Med. 2013;13:377–386. [PubMed] [Google Scholar]
- 37.Liu H, Zhu C, Luo J, Wang Y, Li D, Li Y, Zhou J, Yuan W, Ou Y, Liu M, et al. ZNF411, a novel KRAB-containing zinc-finger protein, suppresses MAP kinase signaling pathway. Biochem Biophys Res Commun. 2004;320:45–53. doi: 10.1016/j.bbrc.2004.05.130. [DOI] [PubMed] [Google Scholar]
- 38.Zhou B, Wu L, Shen K, Zhang J, Lawrence DS, Zhang ZY. Multiple regions of MAP kinase phosphatase 3 are involved in its recognition and activation by ERK2. J Biol Chem. 2001;276:6506–6515. doi: 10.1074/jbc.M009753200. [DOI] [PubMed] [Google Scholar]
- 39.Furukawa T, Yatsuoka T, Youssef EM, Abe T, Yokoyama T, Fukushige S, Soeda E, Hoshi M, Hayashi Y, Sunamura M, et al. Genomic analysis of DUSP6, a dual specificity MAP kinase phosphatase, in pancreatic cancer. Cytogenet Cell Genet. 1998;82:156–159. doi: 10.1159/000015091. [DOI] [PubMed] [Google Scholar]
- 40.Chen HY, Yu SL, Chen CH, Chang GC, Chen CY, Yuan A, Cheng CL, Wang CH, Terng HJ, Kao SF, et al. A five-gene signature and clinical outcome in non-small-cell lung cancer. N Engl J Med. 2007;356:11–20. doi: 10.1056/NEJMoa060096. [DOI] [PubMed] [Google Scholar]
- 41.Cui Y, Parra I, Zhang M, Hilsenbeck SG, Tsimelzon A, Furukawa T, Horii A, Zhang ZY, Nicholson RI, Fuqua SA. Elevated expression of mitogen-activated protein kinase phosphatase 3 in breast tumors: a mechanism of tamoxifen resistance. Cancer Res. 2006;66:5950–5959. doi: 10.1158/0008-5472.CAN-05-3243. [DOI] [PMC free article] [PubMed] [Google Scholar]
- 42.Cao Q, Huang YS, Kan MC, Richter JD. Amyloid precursor proteins anchor CPEB to membranes and promote polyadenylation-induced translation. Mol Cell Biol. 2005;25:10930–10939. doi: 10.1128/MCB.25.24.10930-10939.2005. [DOI] [PMC free article] [PubMed] [Google Scholar]
- 43.Huang YS, Kan MC, Lin CL, Richter JD. CPEB3 and CPEB4 in neurons: analysis of RNA-binding specificity and translational control of AMPA receptor GluR2 mRNA. EMBO J. 2006;25:4865–4876. doi: 10.1038/sj.emboj.7601322. [DOI] [PMC free article] [PubMed] [Google Scholar]
- 44.Walker J, Minshall N, Hake L, Richter J, Standart N. The clam 3’ UTR masking element-binding protein p82 is a member of the CPEB family. RNA. 1999;5:14–26. doi: 10.1017/s1355838299981219. [DOI] [PMC free article] [PubMed] [Google Scholar]
- 45.Hake LE, Mendez R, Richter JD. Specificity of RNA binding by CPEB: requirement for RNA recognition motifs and a novel zinc finger. Mol Cell Biol. 1998;18:685–693. doi: 10.1128/mcb.18.2.685. [DOI] [PMC free article] [PubMed] [Google Scholar]
- 46.Fritsche J, Rehli M, Krause SW, Andreesen R, Kreutz M. Molecular cloning of a 1alpha,25-dihydroxyvitamin D3-inducible transcript (DDVit 1) in human blood monocytes. Biochem Biophys Res Commun. 1997;235:407–412. doi: 10.1006/bbrc.1997.6798. [DOI] [PubMed] [Google Scholar]
- 47.Rehli M, Krause SW, Schwarzfischer L, Kreutz M, Andreesen R. Molecular cloning of a novel macrophage maturation-associated transcript encoding a protein with several potential transmembrane domains. Biochem Biophys Res Commun. 1995;217:661–667. doi: 10.1006/bbrc.1995.2825. [DOI] [PubMed] [Google Scholar]
- 48.Gaspar NJ, Kinzy TG, Scherer BJ, Hümbelin M, Hershey JW, Merrick WC. Translation initiation factor eIF-2. Cloning and expression of the human cDNA encoding the gamma-subunit. J Biol Chem. 1994;269:3415–3422. [PubMed] [Google Scholar]
- 49.Tu LC, Yan X, Hood L, Lin B. Proteomics analysis of the interactome of N-myc downstream regulated gene 1 and its interactions with the androgen response program in prostate cancer cells. Mol Cell Proteomics. 2007;6:575–588. doi: 10.1074/mcp.M600249-MCP200. [DOI] [PubMed] [Google Scholar]