

ABSTRACT
The kinesin KIF1C is known to regulate podosomes, actin-rich adhesion structures that remodel the extracellular matrix during physiological processes. Here, we show that KIF1C is a player in the podosome-inducing signaling cascade. Upon induction of podosome formation by protein kinase C (PKC), KIF1C translocation to the cell periphery intensifies and KIF1C accumulates both in the proximity of peripheral microtubules that show enrichment for the plus-tip-associated proteins CLASPs and around podosomes. Importantly, without CLASPs, both KIF1C trafficking and podosome formation are suppressed. Moreover, chimeric mitochondrially targeted CLASP2 recruits KIF1C, suggesting a transient CLASP–KIF1C association. We propose that CLASPs create preferred microtubule tracks for KIF1C to promote podosome induction downstream of PKC.
KEY WORDS: CLASP, KIF1C, Podosome, Kinesin, Microtubule, Trafficking
INTRODUCTION
Microtubules (MTs) serve to deliver and position molecular complexes and organelles within a cell, thereby defining its architecture. An important part of this function is locating the sites of actin cytoskeleton assembly and remodeling (Hoogenraad and Akhmanova, 2010; Kaverina and Straube, 2011; Etienne-Manneville, 2013). Amongst other actin-based structures, MTs regulate invasive protrusions, termed podosomes (Babb et al., 1997; Linder et al., 2000; Destaing et al., 2003; Evans et al., 2003; Destaing et al., 2005; Jurdic et al., 2006; Kopp et al., 2006; Gil-Henn et al., 2007; Purev et al., 2009; McMichael et al., 2010; Biosse Duplan et al., 2014), and their cancer counterparts, invadopodia (Schoumacher et al., 2010; Quintavalle et al., 2011).
Podosomes consist of a core of constantly polymerizing actin filaments and an outer adhesive ring. These structures serve as exocytosis sites for matrix metalloproteases (MMPs) (Lener et al., 2006; Gimona et al., 2008; Linder et al., 2011; Murphy and Courtneidge, 2011). Podosomes are found in multiple extracellular matrix (ECM)-remodeling cells, such as osteoclasts, macrophages and synthetic vascular smooth muscle cells (VSMCs). In these cell types, efficient ECM remodeling does not occur if podosomes are not present. A growing body of evidence implicates podosome-dependent ECM remodeling in cell migration and invasion during morphogenesis (Teti et al., 1991; Lener et al., 2006; Gil-Henn et al., 2007; Proszynski et al., 2009; Rottiers et al., 2009; Quintavalle et al., 2010; Linder et al., 2011; Saltel et al., 2011). For example, the ECM-remodeling capacity of synthetic VSMCs is important for angiogenesis and vascular repair (Lener et al., 2006; Quintavalle et al., 2010; Chen et al., 2013). Also, the migration and invasion potentials of VSMCs have a direct impact on atherosclerotic plaque formation and stability (Quintavalle et al., 2010; Lacolley et al., 2012; Chen et al., 2013).
Podosomes are dynamic structures and are induced or disassembled in response to physiological signals (Chambers and Fuller, 2011; Dovas and Cox, 2011; van Helden and Hordijk, 2011; Hoshino et al., 2013). Podosome dynamics are strongly regulated by MTs (Babb et al., 1997; Linder et al., 2000; Destaing et al., 2003; Evans et al., 2003; Destaing et al., 2005; Jurdic et al., 2006; Kopp et al., 2006; Gil-Henn et al., 2007; Purev et al., 2009; McMichael et al., 2010; Biosse Duplan et al., 2014). It has become clear from a number of recent studies that MT–podosome relationships are multifaceted – both stable (acetylated; Destaing et al., 2005; Purev et al., 2009; Biosse Duplan et al., 2014) and dynamic (Kopp et al., 2006; Biosse Duplan et al., 2014) MT subpopulations are essential for podosome regulation. Moreover, several independent molecular machineries structurally and/or functionally link MTs to podosomes, including tubulin acetylation enzymes (Destaing et al., 2005; Purev et al., 2009; Biosse Duplan et al., 2014), MT plus-end-associated protein complexes (EB1; Biosse Duplan et al., 2014), actin-dependent molecular motors (myosin-X; McMichael et al., 2010) and several MT-dependent molecular motors (Kopp et al., 2006; Wiesner et al., 2010; Cornfine et al., 2011). Within the last group, podosome function in ECM remodeling crucially depends on the kinesins KIF5B, the KIF3A–KIF3B complex and KIF9, which deliver MMPs to podosomes (Wiesner et al., 2010; Cornfine et al., 2011). More intriguingly, the kinesin KIF1C regulates the dynamics of podosomes themselves (Kopp et al., 2006), possibly owing to the capacity of this motor to transport essential podosome components, such as integrins (Theisen et al., 2012). In principle, such transportation could be either constitutive or triggered downstream of physiological signals that induce podosome formation. Activation of KIF1C trafficking would be a suitable regulatory step in the signaling cascade leading to ECM remodeling. However, whether KIF1C transport is regulated by podosome-inducing signals has not been addressed.
In this study, we show that protein kinase C (PKC) activation strongly facilitates KIF1C transport to the cell periphery to initiate podosome formation. Moreover, our results reveal that the MT-associated proteins CLASPs are necessary for efficient translocation of KIF1C along MTs and are crucial components of podosome-induction signaling. Taken together, these findings reveal a new pathway within the multifaceted MT-dependent podosome regulation.
RESULTS
Podosome formation in VSMCs requires MTs
In the rat aortic VSMC line A7r5, multiple small podosomes can be rapidly induced by PKC activation by phorbol ester phorbol 12,13-dibutyrate (PDBu) treatment (Hai et al., 2002). Podosomes in VSMCs contain specific podosome markers, such as Tks5 (also known as SH3PXD2A) (Fig. 1A), include accumulations of F-actin with a characteristic morphology (Fig. 1A,C) and are enriched in proteins involved in actin polymerization (Hai et al., 2002; Kaverina et al., 2003; Lener et al., 2006), such as cortactin (Fig. 1A,F).
Fig. 1.

Podosome formation in A7r5 cells requires MTs. (A) Visualization of podosomes in a PDBu-treated A7r5 cell by expression of Tks5–GFP (red) and immunofluorescence detection of actin (phalloidin, green) and cortactin (blue). The boxed region from the overview (left) is enlarged on the right and shows Tks5-positive podosomes and their colocalization with actin and cortactin. Maximal-intensity projection of a confocal stack. Arrows, podosomes. (B–G) Wide-field fluorescence microscopy of actin (phalloidin, B–D) and cortactin (E–G) in A7r5 cells. Multiple podosomes are spread throughout a cell after 40 minutes of PDBu treatment (C,F) in contrast to untreated cells (B,E) or cells pre-treated with nocodazole for 2 hours before PDBu application (D,G). Arrows, podosomes. (H) Podosome numbers based on cortactin staining (similar to E–G). Data show the mean+s.e.m. (N = 40±10); *P<1×10⁻⁶ (Student's unpaired two-tailed t-test). (I) KIF1C (red) accumulates at the cell edge and podosomes (arrows). Phalloidin, green. The boxed region from the overview (upper panel) is enlarged below.
We took advantage of the PDBu-inducible podosome model to address the regulation of de novo podosome formation by MTs. To test whether MTs are essential for podosome formation, we completely depolymerized MTs in A7r5 cells by treatment with nocodazole (supplementary material Fig. S1A–C) and applied PDBu. We found that the number of podosomes formed was significantly decreased under these conditions (Fig. 1D,G,H) to levels comparable to those of non-induced cells (Fig. 1B,E). This indicates that MTs are required for podosome formation in VSMCs, as was described previously for macrophages and osteoclasts (Babb et al., 1997; Linder et al., 2000; Destaing et al., 2003; Evans et al., 2003; Destaing et al., 2005; Jurdic et al., 2006; Kopp et al., 2006; Gil-Henn et al., 2007; Purev et al., 2009; McMichael et al., 2010; Biosse Duplan et al., 2014).
Podosome formation in VSMCs requires KIF1C
It has been proposed that MTs exert their control on podosomes by delivering regulatory and structural molecules to podosome sites by MT-dependent transport. Indeed, one of the few identified molecular players that is essential for podosome turnover is the kinesin KIF1C (Kopp et al., 2006). Interestingly, we found that KIF1C was enriched at podosome sites in A7r5 cells (Fig. 1I). By performing small interfering (si)RNA-mediated depletion of KIF1C in A7r5 cells (Fig. 2I,J), we found that the number and size of PDBu-induced podosomes were significantly decreased in the absence of this kinesin (Fig. 2A–H). This phenotype was rescued by re-expression of RNA interference (RNAi)-resistant KIF1C–GFP (Fig. 2K–N), indicating the specificity of the depletion phenotype. In agreement with this result, the expression of dominant-negative mutants of KIF1C [either a truncated cargo-binding tail domain (Fig. 2P) or motor-dead rigor mutant (Fig. 2Q)] mimicked the effect of KIF1C depletion (Fig. 2O–R). The effects of KIF1C loss of function were very significant but milder than the effect of complete MT depolymerization (Fig. 1), suggesting that KIF1C is an essential, although not the only, factor in MT-dependent podosome regulation. These data indicate that KIF1C is required for efficient podosome formation in VSMCs.
Fig. 2.

Podosome formation in A7r5 cells depends on KIF1C. (A–F) Immunofluorescence visualization of podosomes by actin (phalloidin, green, A,B) and cortactin (green, E,F). KIF1C (red) is shown in C,D for cells in A,B. NT, non-targeted control siRNA-treated; KIFsi, KIF1C-depleted. (B,D,F) After KIF1C depletion only few immature podosomes are detected. The remaining KIF1C is detected in the cell center (D). (G) Podosome numbers based on data similar to that shown in E,F. Data show the mean+s.e.m. (N = 32); *P<0.01 (Student's unpaired two-tailed t-test). (H) Average of mean podosome area per cell (µm2) based on data similar to that shown in E,F. Data show the mean+s.e.m. (N = 32). *P<1×10⁻⁶ (Student's unpaired two-tailed t-test). (I) Western blotting indicates significant depletion of KIF1C. Actin is shown as a loading control. Ctr, control; si, KIF1C-depleted. (J) Quantification of KIF1C levels detected by western blotting. Data show the mean+s.e.m. (N = 3); *P<0.001 (Student's unpaired two-tailed t-test). (K,L) Re-expression of KIF1C–GFP (red) in KIF1C-depleted cells (L) rescues podosome formation as compared with that of GFP-expressing KIF1C-depleted cells (K). GFP is pseudo-colored red. Cortactin, green. (M) Podosome numbers in KIF1C-depleted and rescued cells. Data show the mean+s.e.m. (N = 45); *P<0.05 (Student's unpaired two-tailed t-test). (N) Western blotting indicates KIF1C–GFP expression in control and KIF1C-depleted cells. Actin is shown as a loading control. (O–Q) Expression of dominant-negative FLAG-tagged KIF1C cargo-binding domain (P) or rigor motor mutant (Q) suppresses podosome formation as compared with that of controls (O). Cortactin, green. All arrows indicate podosomes. (R) Podosome numbers in cells expressing dominant-negative constructs. Data show the mean+s.e.m. (N = 45); *P<0.05 (Student's unpaired two-tailed t-test).
The PKC pathway facilitates MT-dependent transport of KIF1C to the cell periphery
Next, we questioned whether KIF1C-dependent trafficking is regulated as part of the podosome induction pathway downstream of PKC. Using A7r5 cells stably expressing low levels of KIF1C–GFP (supplementary material Fig. S1E), we found that PDBu treatment strongly stimulated KIF1C–GFP translocation to the cell periphery (Fig. 3A–C; supplementary material Movies 1, 2). In contrast to cell-center localization in control cells, KIF1C accumulated at the cell edge and at the ventral surface of the lamellae in PDBu-treated cells (Fig. 3D,E). This localization was abolished by nocodazole treatment (Fig. 3F–H; supplementary material Fig. S1A,B), indicating that KIF1C targeting to the cell periphery was MT-dependent. This result indicates that KIF1C transport is regulated by podosome-inducing signals and is therefore an essential step in the signaling cascade leading to ECM remodeling.
Fig. 3.

Podosome induction signaling facilitates MT-dependent KIF1C deposition in lamellae. (A) PDBu facilitates the accumulation of KIF1C–GFP (green) in the cell periphery. Frames from a single-plane confocal image sequence at 30 seconds (left) and 24 minutes (right) of PDBu treatment. Pseudo-colored maps of KIF1C intensity [purple (low) to white (high)] at the indicated areas (white brackets) are shown to the upper right. See supplementary material Movie 1. (B) Deposition of KIF1C–GFP (green) in cell lamellae before (left) and after (right) a 90-minute PDBu treatment. See supplementary material Movie 2. (C) Fold increase in KIF1C–GFP intensity in cell lamellae in live cells with or without PDBu treatment, based on data as shown in B. Data show the mean+s.e.m. (N = 6–12); *P<0.01 (Student's unpaired two-tailed t-test). (D–G) Immunostained KIF1C (red, arrows) at the cell periphery. KIF1C modestly localizes to the lamellae of untreated cells (D), and accumulates in cell lamellae after a 40-minute PDBu treatment (E). No KIF1C accumulations are found in nocodazole (noc)-treated (F) and nocodazole-pretreated plus PDBu-treated (G) cells. The images show maximal intensity projections of confocal stacks. Arrows show KIF1C accumulations; dashed lines indicate cell outlines. (H) The percentage of the area in cell lamellae taken up by KIF1C accumulation, based on data as shown in D–G. Data show the mean+s.e.m. (N = 10); *P<0.001 (Student's unpaired two-tailed t-test).
KIF1C moves along CLASP-associated MTs and can be recruited by CLASPs
In agreement with a prior finding of Kopp and colleagues in macrophages (Kopp et al., 2006), we found that, in VSMCs, KIF1C puncta undergo movements predominantly when associated with the plus ends of polymerizing MTs (supplementary material Fig. S1F,G; Movies 3, 4). This suggests that KIF1C translocates along MTs in close association with the MT plus-end tracking protein (+TIP) complex. Because deposition of KIF1C at the cell periphery was dramatically increased by PDBu treatment, we tested whether cellular localization of major +TIPs was influenced by PDBu. We were looking for a protein that would localize more strongly to MTs during PDBu treatment than in controls and, therefore, could be a positive regulator of KIF1C transport. Among the proteins tested, certain proteins responded to PDBu treatment by decreased MT-plus-end association, including EB1 (not shown), which was recently detected as an important podosome regulator (Biosse Duplan et al., 2014); other proteins did not change significantly (e.g. CLIP170, not shown). Importantly, we found a striking change in localization of +TIPs called CLIP-associated proteins (CLASPs, CLASP1 and CLASP2), which are known to facilitate MT polymerization and stability (Galjart, 2005; Al-Bassam and Chang, 2011). Although immunofluorescent staining for CLASPs normally highlighted short MT plus-end-tracking comets throughout the whole cell, in PDBu-treated cells, CLASPs were arranged in extended patterns only at the cell periphery (Fig. 4A,B); this indicated that CLASP binding to peripheral MT lattice was specifically enhanced by PDBu. We hypothesized that the relocation of CLASPs in response to PKC might be involved in the PDBu-stimulated activation of KIF1C transport to podosomes and, thus, we concentrated on this protein in this study.
Fig. 4.

KIF1C associates with CLASP-rich MTs. (A,B) CLASPs (green, white arrows) mark MT plus ends in a non-treated cell (A), but upon PDBu treatment (B), CLASPs accumulate at the lattice of MTs in close contact with podosomes (cortactin, red). Data show wide-field fluorescence analysis of immunostaining. (C) KIF1C–mCherry (red, yellow arrows) moves with the end of a GFP–CLASP2-associated MT (green, white arrows) in a PDBu-treated cell. Data show frames from a video sequence and are enlarged from the box in supplementary material Fig. S1F. See also supplementary material Movies 5, 6. (D) KIF1C (red) relocation events occurring at the ends of MTs associated with CLASP2 (CL-MT), as compared to the same events superimposed on a spatially shifted RFP–CLASP2 video sequence, based on data as in supplementary material Movies 5, 6. Data show the mean+s.e.m. (N = 4 cells, 14–19 events/cell); *P<0.001 (Student's t-test). (E,F) Colocalization of ectopically expressed KIF1C with mitochondria in cells with (mitoCL) or without (ctr) mito-CLASP expression. Mander's coefficients M1 (E) and M2 (F) for thresholded images are shown. Both full-length (left) and (right) and tail domain constructs are recruited to mitochondria by CLASP. Data show the mean+s.e.m. (N = 5); *P<0.01 (Student's t-test). (G,H) KIF1C–GFP (red) colocalizes with CLASP (green, immunostained) and mitochondria (mCherry–TOM20, blue) in cells with (H) but not without (w/o, G) mito-CLASP. (I,J) FLAG-tagged KIF1C tail (red) colocalizes with CLASP (green, immunostained) and Mitotracker (blue) in cells with (J) but not without (I) mito-CLASP. See also supplementary material Fig. S2A–D. (K,L) Mitochondria in cells transfected with mCherry–TOM20 alone (K) or mCherry–TOM20 and mito-CLASP (L). See also supplementary material Fig. S2F,G. Yellow dotted lines indicate cell borders. (M) The number of mitochondria in lamellae in cells transfected with mCherry–TOM20 or mito-CLASP, based on the data as shown in K,L. Data show the mean+s.e.m. (N = 28–36); *P<0.01 (Student's unpaired two-tailed t-test).
Interestingly, CLASP-associated MTs were located in the podosome-rich regions of the cell and were frequently found in close contact with podosomes (Fig. 4B) and peripheral accumulations of KIF1C (Fig. 4C). Live-cell imaging indicated that KIF1C at the cell periphery moved predominantly in association with CLASP-rich peripheral MTs and accumulated in the vicinity of their ends (Fig. 4C,D; supplementary material Fig. S1D; Movies 5, 6).
Thus, it is possible that CLASPs promote KIF1C transport; for example, by stimulating KIF1C recruitment to MTs. In agreement with this hypothesis, when a chimeric protein, in which CLASP2 was combined with the mitochondrial component TOM20 [mito-CLASP, (Efimov et al., 2007)], was expressed in cells, a significant fraction of KIF1C–GFP accumulated at the mitochondria, indicating that KIF1C–GFP followed the CLASP chimera (Fig. 4E–H; supplementary material Fig. S2A,B). This recruitment is likely mediated by the tail domain of KIF1C, because the tail domain (Fig. 4E,F,I,J; supplementary material Fig. S2C,D) but not the KIF1C motor domain (not shown) was significantly recruited to mitochondria by mito-CLASP. Interestingly, full-length KIF1C that was recruited to mitochondria by mito-CLASP was likely functional and responsive to PKC activation; this was evident from relocation of mitochondria towards the cell periphery in transfected cells (Fig. 4K–M; supplementary material Fig. S2E,F). These data indicate that in cells CLASPs interact with a subset of KIF1C molecules through the KIF1C tail domain.
CLASPs are necessary for KIF1C trafficking and deposition at the cell periphery
The evidence that KIF1C transiently associates with CLASPs suggests that CLASPs might be important for KIF1C transport to the sites of podosome formation. Thus, we tested whether CLASPs modulate KIF1C targeting to the cell periphery. Strikingly, CLASP depletion, by two alternative siRNA combinations (Fig. 5A; supplementary material Fig. S3), completely abolished KIF1C accumulation at the cell edge and at podosome formation sites (Fig. 5B–E; supplementary material Fig. S4A–C). In CLASP-depleted cells, KIF1C-positive puncta were diffuse throughout the cell body; however, KIF1C protein levels were not affected by CLASP depletion (supplementary material Fig. S3D). Distribution of KIF1C in CLASP-depleted cells was similar to that observed in nocodazole-treated cells lacking MTs (Fig. 3G,H; supplementary material Fig. S1B), suggesting that without CLASP, MTs cannot support KIF1C transport to the cell periphery. Decreased translocation of KIF1C to the cell periphery might, in principle, be explained by the low MT number in CLASP-depleted cells (Mimori-Kiyosue et al., 2005; Efimov et al., 2007). To test this possibility, we addressed whether KIF1C accumulations could be found at MT plus ends in CLASP-depleted cells. We found that, in sharp contrast to the control cells, no KIF1C accumulation could be detected in association with MTs under these conditions (Fig. 5C,D; supplementary material Fig. S4B,C); this indicates that deficient KIF1C distribution at the cell periphery did not result from the decrease in MT number in CLASP-depleted cells. Rather, our data suggest that translocation of this motor along MTs is blocked without CLASPs.
Fig. 5.
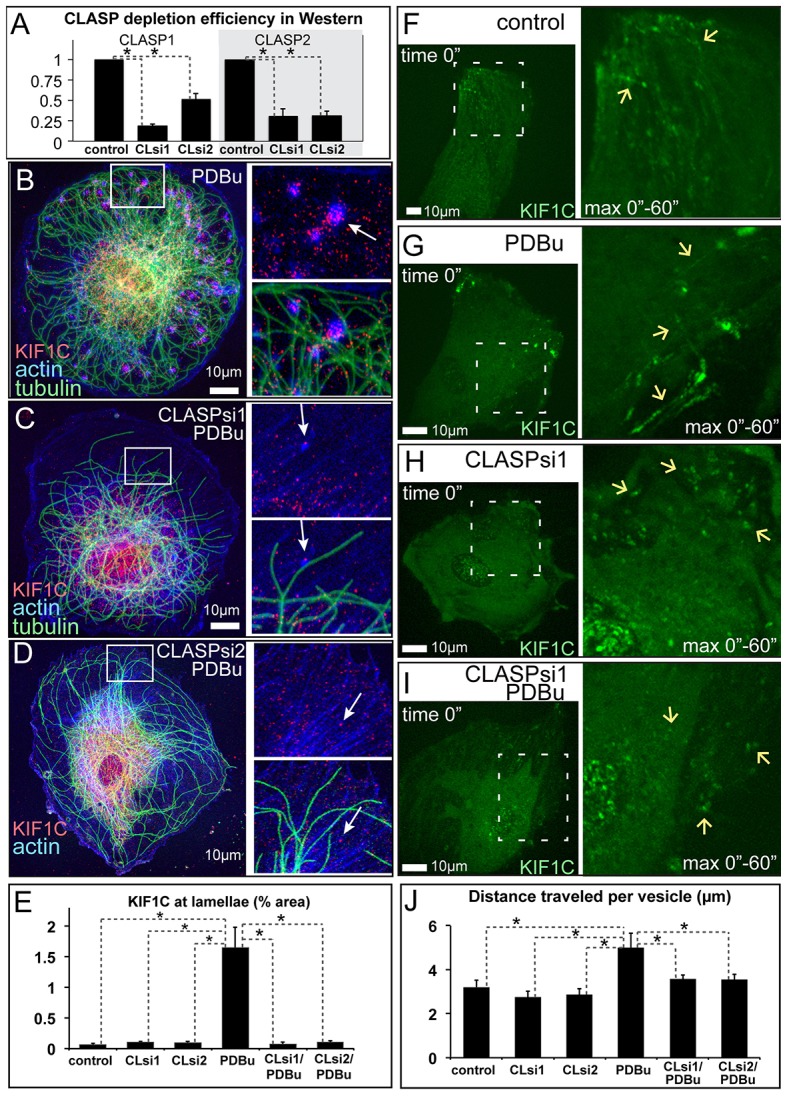
MT-dependent transport of KIF1C to podosomes requires CLASPs. (A) CLASP1 and CLASP2 depletion levels were investigated by using western blotting in cells depleted of CLASPs by siRNA combinations 1 and 2 (CLsi1, CLsi2). Data show the mean+s.e.m. (N = 3); *P<0.01 (Student's unpaired two-tailed t-test). (B–D) KIF1C (red, arrows) accumulates around podosomes in the lamellae of PDBu-treated non-targeted control cells (B), but is missing from the lamellae of CLASP-depleted cells (C,D). Boxed areas on the left are enlarged on the right. Phalloidin, blue; tubulin, green (immunostaining). Images show maximal intensity projections of confocal stacks. (E) The percentage of the area in cell lamellae taken up by KIF1C accumulation, based on data as shown in B–D. The control populations are the same as those shown in Fig. 2C,D. Data show the mean+s.e.m. (N = 10); *P<0.001 (Student's unpaired two-tailed t-test). (F–I) KIF1C–GFP (green) trafficking as visualized by a single-plane confocal image sequence. Single-frame cell overviews are shown on the left. Video sequences from the boxed regions are shown on the right as enlarged maximal intensity projections over time. Arrows indicate the tracks of KIF1C particle movement in non-targeted control cells (F,G) and the lack of directional movement in CLASP-depleted cells (H,I), in PDBu-treated (G,I) or untreated (F,H) cells. See supplementary material Movie 7. (J) Directional movement of KIF1C puncta is enhanced by PDBu in control but not CLASP-depleted cells. The graph is based on data as shown in F–I and supplementary material Fig. S4D,E. Data show the mean+s.e.m. (N = 10–17 cells); *P<0.05 (Student's unpaired two-tailed t-test).
To test this hypothesis directly, we followed KIF1C–GFP motility in CLASP-depleted and control cells by live-cell imaging. In control cells, KIF1C–GFP puncta and tubes often underwent fast directional translocations typical of MT-dependent membrane trafficking (Fig. 5F,G; supplementary material Movie 7, left). Interestingly, in the absence of CLASPs, these movements were largely abolished (Fig. 5H–J; supplementary material Fig. S4D,E; Movie 7, right), indicating that CLASPs are required for KIF1C transport along MTs.
CLASPs are necessary for podosome formation
Because the podosome-stimulating kinesin KIF1C cannot translocate to the cell periphery in CLASP-depleted cells, one would predict that CLASPs are required for podosome formation. PDBu treatment of cells depleted of CLASPs by two alternative siRNA combinations indicated that podosome numbers, detected by cortactin staining, were dramatically reduced as compared with those of cells treated with non-targeted control siRNA (Fig. 6A–F,K). Podosome numbers in CLASP-depleted cells were efficiently rescued by ectopic expression of CLASP2–RFP, which cannot be silenced by siRNA combination 2 (Fig. 6G–K). Depletion of CLASP1 or CLASP2 separately led to partial podosome suppression (not shown). Thus, it is likely that both CLASPs act redundantly as essential effectors in the podosome induction pathway downstream of PKC.
Fig. 6.

Podosome formation in A7r5 cells requires CLASPs. (A–F) Cortactin immunostaining of vehicle-treated (A–C) and PDBu-treated (D–F) cells. Arrows, podosomes. Cells were transfected with non-targeted control siRNA (A,D), CLASP-specific siRNA combination 1 (CLsi1; B,E) or CLASP-specific siRNA combination 2 (CLsi2; C,F). Podosomes are formed in controls (D, arrows), but not in CLASP-depleted cells (E,F). Images were acquired by using wide-field fluorescence microscopy. (G–J) In cells treated with CLASP-specific siRNA combination 2, podosome formation in PDBu (I) is rescued by expression of siRNA2-insensitive RFP–CLASP2 (H,J). Cortactin immunostaining is shown in G,I. Arrows show podosomes. (K) Podosome numbers were quantified, based on data similar to that shown in A–J. Data show the mean+s.e.m. (N = 45±15); *P<1×10⁻⁵ (Student's unpaired two-tailed t-test).
DISCUSSION
Based on our data, we propose a model in which CLASPs act as essential players in the regulation of podosome formation, because only CLASP-decorated MTs are capable of supporting KIF1C translocation to putative podosome sites at the cell periphery (Fig. 7A). CLASP enrichment at MTs has been shown previously to result from GSK3β inactivation at the cell periphery, which leads to enhanced MT binding of dephosphorylated CLASPs (Wittmann and Waterman-Storer, 2005; Kumar et al., 2009). In our system, this change in MT binding is likely to be caused by PKC-dependent GSK3β inactivation triggered by PDBu treatment (Goode et al., 1992). In organisms, this pathway might be triggered through extracellular factors that induce podosomes, such as PDGF signaling (Quintavalle et al., 2010).
Fig. 7.
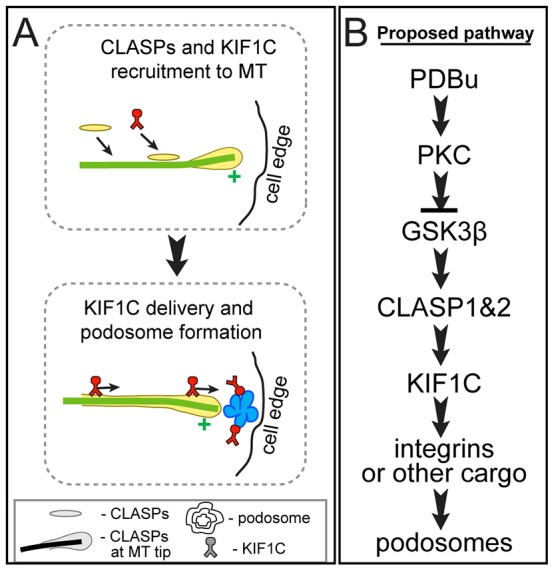
Models of the roles of CLASPs and KIF1C in podosome formation. (A) A model of podosome regulation by CLASP-dependent KIF1C transportation. Upon PDBu treatment, CLASP is recruited to MTs and stimulates KIF1C binding to MTs. This leads to KIF1C-dependent transport of essential factors to podosome formation sites. (B) A schematic representation of the proposed signaling cascade triggered by PDBu treatment.
Our data implicate CLASPs as important regulatory factors for the trafficking function of KIF1C. It is also noteworthy that the effects of KIF1C depletion or inactivation are less striking than the effects of CLASP depletion, suggesting that additional factors facilitate podosome formation in a CLASP-dependent manner. It is plausible to suggest that certain molecular motors sharing similarities with KIF1C (e.g. other kinesin-3 family members KIF1B and KIF1A) are involved. However, the nature of additional CLASP-dependent factors is yet unclear; this study is the first direct evidence that CLASPs regulate molecular motor function, which has been previously suggested based on the essential role of CLASPs in specific cellular processes. For example, CLASP-coated Golgi-derived MTs have especially strong capacity for transportation and assembly of Golgi stacks (Miller et al., 2009). Also, CLASP is essential for the transport or positioning of mitochondria in Schizosaccharomyces pombe (Chiron et al., 2008), which could be interpreted as a result of CLASP-dependent kinesin regulation in that system.
Because CLASP2 can recruit KIF1C to mitochondria, we propose that MT-bound CLASPs directly stabilize the association of KIF1C with MTs, similar to the recently discovered function of doublecortin–KIF1A cooperation in neurons (Liu et al., 2012) or EB1–KIF17 cooperation in polarizing epithelia (Jaulin and Kreitzer, 2010). A less likely possibility is that CLASPs activate KIF1C in an MT-independent manner, similar to kinesin-1 activation by the MT-associated protein ensconsin (Barlan et al., 2013). In principle, another possible mechanism could involve the indirect effect of a CLASP-dependent increase in MT lifetime and stability (Akhmanova et al., 2001; Mimori-Kiyosue et al., 2005; Drabek et al., 2006; Lansbergen et al., 2006), which has been shown to facilitate transport by specific kinesins (Reed et al., 2006; Cai et al., 2009; Hammond et al., 2010). Stable MTs are indeed important for podosome regulation in osteoclasts (Destaing et al., 2005; Purev et al., 2009). However, KIF1C (similar to another kinesin-3 family member KIF1A; Cai et al., 2009) moves with growing MT plus ends and thus prefers dynamic MT tracks rather than stable ones. Moreover, MT acetylation, typical for stable MTs, suppresses movement of vesicles associated with KIF1C (Bhuwania et al., 2014). Accordingly, we suggest that dynamic CLASP-associated MTs normally serve as preferred tracks for KIF1C transport, and that relocation of CLASPs to peripheral MTs upon PDBu treatment facilitates KIF1C translocation to the lamella and, subsequently, triggers podosome formation (Fig. 7A). This is already the second reported mechanism whereby dynamic, rather than stable, MTs regulate podosome formation and dynamics. It has been shown recently that EB1, a +TIP MT protein that associates only with polymerizing dynamic MT ends, facilitates podosome formation in osteoclasts through an interaction with cortactin (Biosse Duplan et al., 2014). This and our present findings indicate that targeting of podosomes by dynamic MT ends is crucial for regulation of these adhesive structures, a mechanism resembling MT-mediated regulation of focal adhesions (Kaverina et al., 1999). Overall, our data establish CLASPs and KIF1C as sequential molecular players in the signaling cascade downstream of PKC (Fig. 7B) and as crucial components of the podosome induction pathway.
MATERIALS AND METHODS
Cells
A7r5 rat smooth muscle cells (ATCC) were grown in low-glucose (1000 mg/l) Dulbecco's modified Eagle's medium (DMEM) without Phenol Red, supplemented with 10% fetal bovine serum at 37°C and 5% CO2. Cells were plated on glass coverslips or glass-bottomed dishes (MatTek) coated with 10 µg/ml fibronectin 24 hours prior to experiments. In live-cell experiments, cells were maintained on the microscope stage at 37°C under mineral oil for medium equilibrium maintenance.
Microscopy
Wide-field fluorescence imaging was performed using a Nikon 80I microscope with a CFI APO 60× oil lens, NA 1.4 and CoolSnap ES CCD camera (Photometrics). Single-plane confocal live-cell video sequences (except for Fig. 2A) were taken using a Yokogawa QLC-100/CSU-10 spinning-disk head (Visitec assembled by Vashaw) attached to a Nikon TE2000E microscope with a Perfect Focus System using a CFI PLAN APO VC 100× oil lens NA 1.4 and a back-illuminated EM-CCD camera Cascade 512B (Photometrics) driven by IPLab software (Scanalytics). The video sequence presented in Fig. 2A was acquired at Nikon Sweptfield Confocal with an Andor Ultra 897 camera, attached to a fully motorized Ti-E with Perfect Focus and Tokai Hit incubation chamber using the 100× 1.45 Lambda objective, and driven by NIS-Elements AR.
A Leica TCS SP5 confocal laser-scanning microscope with an HCX PL APO 100× oil lens NA 1.47 was used for taking confocal stacks of fixed cells. DeltaVision Elite with Alexa Fluor 488, Alexa Fluor 594 and Alexa Fluor 647 filter sets (Chroma) and a Coolsnap HQ CCD camera under control of SoftWorx (Applied Precision LLP) was used for acquisition and deconvolution of stacks of fixed cells.
Image acquisition and editing
For Fig. 1B–G, Fig. 2A–F, Fig. 4A,B, Fig. 6A–F and supplementary material Fig. S1A–D, Fig. S3A–C and Fig. S4A–C, wide-field fluorescence microscopy was used and data were acquired as 12-bit images. For Fig. 3B, Fig. 4C, Fig. 5F–I and supplementary material Fig. S1F–J and Fig. S4D,E, single-plane spinning-disk confocal microscopy was performed and data were acquired as 16-bit images. Two-color images were taken in near-simultaneous mode. Single timeframes or maximum intensity projections over time are shown, as indicated in figure legends. For Fig. 3A, single-plane swept-field confocal microscopy was used, and data were acquired as 16 bit. Single time frames are shown. For Fig. 1I, Fig. 3D–G, Fig. 4G–L, Fig. 5B–D, Fig. 6G–J and supplementary material Fig. S2, laser-scanning confocal microscopy was used and data were acquired as 8-bit images. All channels were acquired in sequential mode to avoid cross-talk. Single slices or maximum intensity projections are shown, as indicated in figure legends. For Fig. 1A and Fig. 2K,L,O–Q, wide-field deconvolution microscopy was performed, with images acquired as 16 bit. Maximum intensity projections of deconvolved image stacks are shown. For all multi-color images, single channels were contrasted independently; gamma-adjustment was used to visualize minor details. The kymograph (supplementary material Fig. S1I) was built along a freehand line using the ImageJ ‘reslice’ function.
Treatments
For MT depolymerization, nocodazole (2.5 µg/ml) was added to the culture medium for 2 hours. For stimulation of podosome formation, phorbol 12,13-dibutyrate (PDBu) (Sigma) was used at a final concentration of 5 µM for 40 minutes in fixed-cell experiments or was added to the medium during live-cell imaging.
siRNA and expression constructs
Two different combinations of mixed siRNA oligonucleotides against CLASP1 and CLASP2 were used. Combination 1 (Mimori-Kiyosue et al., 2005) included the CLASP1-targeted siRNA sequence 5′-CCUACUAAAUGUUCUGACC-3′ and the CLASP2-targeted siRNA sequence 5′-CUGUAUGUACCCAGAAUCU-3′. Combination 2 (custom design, Sigma) included the CLASP1-targeted siRNA sequence 5′-CGGGAUUGCAUCUUUGAAA-3′ and the CLASP2-targeted siRNA sequence 5′- CUGAUAGUGUCUGUUGGUU-3′. The KIF1C-targeted siRNA sequence was 5′- GUGAGCUAUAUGGAGAUCU-3′. Non-targeting siRNA (Dharmacon) was used for controls.
The following plasmid constructs were used: RFP–cortactin (a gift from Marko Kaksonen, EMBL, Heidelberg, Germany), KIF1C–GFP and KIF1C–mCherry (Theisen et al., 2012), EB3–mCherry lentiviral construct (a gift from Al Reynolds, Vanderbilt University, TN), mCherry–dTOM20 (Drosophila outer mitochondrial protein; a gift from Ethan Lee, Vanderbilt University, TN), Tks5–GFP (Oikawa et al., 2008; a gift from Tsukasa Oikawa, Kobe University, Japan), GFP–CLASP2 and RFP–CLASP2 (gifts from Anna Akhmanova, Utrecht University, the Netherlands). Mito-CLASP (dTOM20 fused with the N-terminal end of CLASP2a in a pCS2 vector) was used for CLASP mislocalization to mitochondria (Efimov et al., 2007).
Cloning of the dominant-negative mutations was based on the FLAG-tagged rescue construct of human KIF1C p4×FLAG-KIF1CRIP1, which has been described previously (Theisen et al., 2012). The motor and neck domain (amino acids 1–359) was deleted by amplifying the KIF1C tail using PCR with the primers 5′-ATGAATTCTATGGCCCGGCTGATTAGAGAGC-3′ and 5′-GTGGATCCACAGCTGCCCCACTCTC-3′ and digestion with EcoRI and BamHI. The G102E rigor mutation was introduced into the KIF1C motor domain using a three-step mutagenesis PCR with upstream primer 5′-GGAATTCTGGAGCTATGGCTGGTG-3′, downstream primer 5′-ACTGACCTTCTCCGAGTCC-3′ and mutagenesis primer 5′-TGGTATAGGATTTCTCAGCCC-3′. A fragment comprising the N-terminal half of the motor domain containing the mutation was replaced in p4×FLAG-KIF1CRIP1 using EcoRI and BsiWI.
The KIF1C rescue plasmid that was used in this study to produce KIF1C that was protected against the KIF1C siRNA was generated on the basis of pKIF1C-eGFP described previously (Theisen et al., 2012). Five silent point mutations were introduced in the RNAi target site using a three-step PCR with upstream and downstream primers as for G102E rigor and the mutagenesis primer 5′-CTGTGGAGGTGTCTTACATGGAAATCTACTGTGAGCG-3′. The fragment containing the mutation was exchanged with EcoRI and BsiWI to generate pKIF1CRIP2-eGFP. Deletion of the KIF1C tail beyond the first two coiled-coil domains was performed by introducing a BamHI restriction site after amino acid position V490 in KIF1C using the primers 5′-GGAATTCTGGAGCTATGGCTGGTG-3′ and 5′-GAAGGGATCCACAGTTCCCCCATCCTC-3′, and replacing the BsiWI–BamHI fragment in pKIF1CRIP2-eGFP with the truncated fragment to create pKIF1CRIP2(1–490)-eGFP.
Transfection, infection and stable lines
For transient transfection of plasmid DNA, Fugene6 (Roche) or Amaxa nucleofection (Lonza) (X-001 program) were used according to the manufacturer's protocols. Experiments were conducted 18–24 hours after transfection. For siRNA oligonucleotide transfection, HiPerFect (Qiagen) was used according to the manufacturer's protocol. Experiments were conducted 72 hours after transfection, as at this time minimal protein levels were detected. For viral infection, supernatant containing lentiviral particles was collected from HEK293T cells transfected with the lentiviral expression vectors and second-generation packaging constructs (Invitrogen). A7r5 cells were infected with supernatant containing lentiviral particles in the presence of 8 µg/ml polybrene overnight.
The EB3–mCherry A7r5 stable line was generated using lentiviral constructs and maintained under the same conditions as A7r5. The KIF1C–GFP stable A7r5 cell line was produced by G418 antibiotic selection (500 µg/ml). HEK293T cells were cultured in high-glucose DMEM supplemented with 10% fetal bovine serum.
Antibodies and immunofluorescence
The following antibodies were used: rabbit polyclonal anti-CLASP2 VU-83 (Efimov et al., 2007), rabbit polyclonal anti-CLASP1 (Epitomics), rat monoclonal anti-CLASP2 KT69 (Fitzgerald), mouse monoclonal anti-α-tubulin DM1a (Sigma), rabbit polyclonal anti-tubulin (Abcam), rabbit polyclonal anti-KIF1C (Cytoskeleton), mouse monoclonal (Upstate), rabbit polyclonal (Cell Signaling Technology) anti-cortactin and mouse monoclonal anti-FLAG® M2 (Sigma) antibodies. Highly cross-absorbed goat anti-mouse-IgG and anti-rabbit-IgG antibodies conjugated to Alexa Fluor 350, Alexa Fluor 488 and Alexa Fluor 568 (Invitrogen, Molecular Probes) were used as secondary antibodies. The actin cytoskeleton was visualized by using phalloidin conjugated to Alexa Fluor 350, 488, 568 or 647 (Invitrogen, Molecular Probes). For immunofluorescence microscopy, cells on coverslips were fixed in 4% paraformaldehyde plus 0.3% Triton X-100 in cytoskeleton buffer (10 mM MES, 150 mM NaCl, 5 mM EGTA, 5 mM glucose and 5 mM MgCl2, pH 6.1) for 10 minutes at room temperature, or in 4% paraformaldehyde plus 0.1% glutaraldehyde and 0.3% Triton X-100 in cytoskeleton buffer for 10 minutes at room temperature, or for 5 minutes in methanol (for anti-CLASP2 staining) at −20°C. Fixed cells were soaked in PBS for ≧1 hour. Then, non-specificity was blocked with blocking solution (1% horse serum, 0.1% BSA in PBS) for 30 minutes. Incubation with the primary antibodies was performed for 1 hour, and samples were then incubated for 40 minutes with the secondary antibodies. All antibodies were diluted in blocking solution prior to use. Immunostaining was performed at room temperature. After washing, samples were mounted into ProLong® Gold Antifade Reagent (Invitrogen, Molecular Probes) on glass slides and stored at −20°C.
Western blot analysis
Western blotting was performed with the Protein Electrophoresis and Western Blotting System (Bio-Rad). Briefly, cells collected from a 10-cm dish were pelleted and resuspended in Laemmli Sample Buffer (Bio-Rad). We applied 30 µg of total protein samples to a 10% polyacrylamide gel and processed for electrophoresis. Nitrocellulose membrane (0.45 µM) was used for protein blotting. The membrane was incubated with primary and then secondary (LI-COR, IRDyeTM 800 or 700) antibodies diluted in Odyssey Blocking Buffer. To reduce the background, 0.2% Tween-20 was added. Odyssey Infrared Imaging System (LI-COR) was used for membrane scanning.
Quantitative analyses
Podosome number per cell (Fig. 1H; Fig. 2G,M,R; Fig. 6K) and average podosome size (Fig. 2H) were quantified using ImageJ particle analysis or ImagePro Analyzer (Media Cybernetics) on thresholded images of cortactin staining visualized by wide-field or deconvolved (DeltaVision) fluorescence microscopy. Objects were verified by comparing with actin staining, and wrongly merged objects were split manually.
To measure the fold increase of KIF1C–GFP intensity at the cell edge (Fig. 3C), 6 µm (20 pixels) around the cell edge was quantified using single-plane spinning-disk confocal movies of KIF1C–GFP-expressing cells. For the first and last frames of a movie, a cell outline was drawn and a band of 6-µm (20 pixels) width was taken for quantification. After background subtraction, the summarized fluorescence intensity within these bands was measured and the ratio between the last and the first frames was taken as the fold increase.
The accumulation of KIF1C in lamellae (Fig. 3H) was quantified using maximal intensity projections of confocal stacks of immunostained KIF1C. A cell outline was drawn and a band of ∼20-µm (150 pixels) width was taken as the cell lamella. The area of lamella and area of KIF1C accumulations were quantified using the ImageJ particle analysis tool, and the percentage of area that contained KIF1C was quantified.
The number of KIF1C movement events that colocalized with MT plus ends was determined using spinning-disk confocal sequences (5 seconds/frame) of KIF1C–GFP and EB3–mCherry-expressing cells. First, all events of directional KIF1C displacement for 4 pixels or more were marked in the GFP channel. Then, moving KIF1C particles were superimposed on the mCherry channel in the ‘real’ or ‘flipped’ (control) orientation. The number of KIF1C particles moving together with EB3 comets was detected, and the percentage of colocalized movements out of the overall movement events was quantified. The number of KIF1C movement events that colocalized with CLASP-coated MTs was quantified similarly, with RFP−CLASP2 in the red channel. A flipped red channel was used as a control. The number of KIF1C particles moving along CLASP-rich MTs was detected, and the percentage of colocalized movements out of the overall movement events was quantified.
KIF1C trafficking (Fig. 3J) was determined using spinning-disk confocal sequences (5 seconds/frame) of KIF1C–GFP-expressing cells. KIF1C puncta were manually tracked using the MTrackJ plugin of ImageJ. Particle displacements >0.2 µm (microscope resolution) were isolated. Trajectories were summed and divided by the total number of particles analyzed per cell; this calculation gives the distance travelled per particle. This analysis is modified from an approach used previously (Barlan et al., 2013).
The colocalization of KIF1C and mitochondria (Fig. 4E,F) was quantified as Manders coefficients using the JACoP plugin of ImageJ. Mitochondria images were thresholded automatically and KIF1C images were thresholded for the equal number of pixels above background.
The mitochondria in lamella (Fig. 4M) were quantified using ImageJ particle analysis on thresholded images of mCherry–TOM20 visualized by wide-field fluorescence microscopy, after exclusion of a 20-µm-wide area of compacted mitochondria around the nucleus.
Supplementary Material
Acknowledgments
We thank Alissa Weaver (Vanderbilt University, Nashville, TN) for helpful suggestions and critical reading of the manuscript, Ulrike Theisen (University of Warwick, Coventry, UK), Kevin Mink (Vanderbilt University, Nashville, TN) and Dmitry Yampolsky (Vanderbilt University, Nashville, TN) for technical support, and Cumberland Dugan (Nikon) for the demo of the Sweptfield microscope.
Footnotes
Competing interests
The authors declare no competing interests.
Author contributions
I.K. conceived of the project, designed the experiments and wrote the paper. A.S. designed and supervised experiments with KIF1C mutants and Tks5 and edited the manuscript. N.E. performed the majority of the experiments. A.G. performed multiple experiments, including mitochondrial targeting, western blotting and siRNA-mediated depletions. A.B. performed experiments with KIF1C mutants and Tks5. K.F. performed live-cell imaging of coexpressed CLASP2 and KIF1C. X.Z. and A.F. developed and performed a part of quantitative analysis. All authors provided intellectual input, vetted and approved the final manuscript.
Funding
This work was supported by the National Institutes of Health [grant number R01-GM078373]; and by an American Heart Association grant-in-aid [grant number 10GRNT4230026] to I.K. A.D.G was supported by an American Heart Association predoctoral fellowship [grant number 12PRE12040153]. A.B. is supported by a non-clinical PhD studentship from the British Heart Foundation [grant number FS/13/42/30377]. A.S. is a Lister Institute Research Prize Fellow. Deposited in PMC for release after 12 months.
Supplementary material available online at http://jcs.biologists.org/lookup/suppl/doi:10.1242/jcs.149633/-/DC1
References
- Akhmanova A., Hoogenraad C. C., Drabek K., Stepanova T., Dortland B., Verkerk T., Vermeulen W., Burgering B. M., De Zeeuw C. I., Grosveld F. et al. (2001). Clasps are CLIP-115 and -170 associating proteins involved in the regional regulation of microtubule dynamics in motile fibroblasts. Cell 104, 923–935 10.1016/S0092-8674(01)00288-4 [DOI] [PubMed] [Google Scholar]
- Al-Bassam J., Chang F. (2011). Regulation of microtubule dynamics by TOG-domain proteins XMAP215/Dis1 and CLASP. Trends Cell Biol. 21, 604–614 10.1016/j.tcb.2011.06.007 [DOI] [PMC free article] [PubMed] [Google Scholar]
- Babb S. G., Matsudaira P., Sato M., Correia I., Lim S. S. (1997). Fimbrin in podosomes of monocyte-derived osteoclasts. Cell Motil. Cytoskeleton 37, 308–325 10.1002/(SICI)1097-0169(1997)37:4<308::AID-CM3>3.0.CO;2-0 [DOI] [PubMed] [Google Scholar]
- Barlan K., Lu W., Gelfand V. I. (2013). The microtubule-binding protein ensconsin is an essential cofactor of kinesin-1. Curr. Biol. 23, 317–322 10.1016/j.cub.2013.01.008 [DOI] [PMC free article] [PubMed] [Google Scholar]
- Biosse Duplan M., Zalli D., Stephens S., Zenger S., Neff L., Oelkers J. M., Lai F. P., Horne W., Rottner K., Baron R. (2014). Microtubule dynamic instability controls podosome patterning in osteoclasts through EB1, cortactin, and Src. Mol. Cell. Biol. 34, 16–29 10.1128/MCB.00578-13 [DOI] [PMC free article] [PubMed] [Google Scholar]
- Bhuwania R., Castr-Castro A., Linder S. I. (2014). Microtubule acetylation regulates dynamics of KIF1C-powered vesicles and contact of microtubule plus ends with podosomes. Eur. J. Cell Biol. [Epub ahead of print]. [DOI] [PubMed] [Google Scholar]
- Cai D., McEwen D. P., Martens J. R., Meyhofer E., Verhey K. J. (2009). Single molecule imaging reveals differences in microtubule track selection between Kinesin motors. PLoS Biol. 7, e1000216 10.1371/journal.pbio.1000216 [DOI] [PMC free article] [PubMed] [Google Scholar]
- Chambers T. J., Fuller K. (2011). How are osteoclasts induced to resorb bone? Ann. N. Y. Acad. Sci. 1240, 1–6 10.1111/j.1749-6632.2011.06249.x [DOI] [PubMed] [Google Scholar]
- Chen Q., Jin M., Yang F., Zhu J., Xiao Q., Zhang L. (2013). Matrix metalloproteinases: inflammatory regulators of cell behaviors in vascular formation and remodeling. Mediators Inflamm. 2013, 928315 10.1155/2013/928315 [DOI] [PMC free article] [PubMed] [Google Scholar]
- Chiron S., Bobkova A., Zhou H., Yaffe M. P. (2008). CLASP regulates mitochondrial distribution in Schizosaccharomyces pombe. J. Cell Biol. 182, 41–49 10.1083/jcb.200712147 [DOI] [PMC free article] [PubMed] [Google Scholar]
- Cornfine S., Himmel M., Kopp P., El Azzouzi K., Wiesner C., Krüger M., Rudel T., Linder S. (2011). The kinesin KIF9 and reggie/flotillin proteins regulate matrix degradation by macrophage podosomes. Mol. Biol. Cell 22, 202–215 10.1091/mbc.E10-05-0394 [DOI] [PMC free article] [PubMed] [Google Scholar]
- Destaing O., Saltel F., Géminard J. C., Jurdic P., Bard F. (2003). Podosomes display actin turnover and dynamic self-organization in osteoclasts expressing actin-green fluorescent protein. Mol. Biol. Cell 14, 407–416 10.1091/mbc.E02-07-0389 [DOI] [PMC free article] [PubMed] [Google Scholar]
- Destaing O., Saltel F., Gilquin B., Chabadel A., Khochbin S., Ory S., Jurdic P. (2005). A novel Rho-mDia2-HDAC6 pathway controls podosome patterning through microtubule acetylation in osteoclasts. J. Cell Sci. 118, 2901–2911 10.1242/jcs.02425 [DOI] [PubMed] [Google Scholar]
- Dovas A., Cox D. (2011). Signaling networks regulating leukocyte podosome dynamics and function. Cell. Signal. 23, 1225–1234 10.1016/j.cellsig.2011.02.004 [DOI] [PMC free article] [PubMed] [Google Scholar]
- Drabek K., van Ham M., Stepanova T., Draegestein K., van Horssen R., Sayas C. L., Akhmanova A., Ten Hagen T., Smits R., Fodde R. et al. (2006). Role of CLASP2 in microtubule stabilization and the regulation of persistent motility. Curr. Biol. 16, 2259–2264 10.1016/j.cub.2006.09.065 [DOI] [PubMed] [Google Scholar]
- Efimov A., Kharitonov A., Efimova N., Loncarek J., Miller P. M., Andreyeva N., Gleeson P., Galjart N., Maia A. R., McLeod I. X. et al. (2007). Asymmetric CLASP-dependent nucleation of noncentrosomal microtubules at the trans-Golgi network. Dev. Cell 12, 917–930 10.1016/j.devcel.2007.04.002 [DOI] [PMC free article] [PubMed] [Google Scholar]
- Etienne-Manneville S. (2013). Microtubules in cell migration. Annu. Rev. Cell Dev. Biol. 29, 471–499 10.1146/annurev-cellbio-101011-155711 [DOI] [PubMed] [Google Scholar]
- Evans J. G., Correia I., Krasavina O., Watson N., Matsudaira P. (2003). Macrophage podosomes assemble at the leading lamella by growth and fragmentation. J. Cell Biol. 161, 697–705 10.1083/jcb.200212037 [DOI] [PMC free article] [PubMed] [Google Scholar]
- Galjart N. (2005). CLIPs and CLASPs and cellular dynamics. Nat. Rev. Mol. Cell Biol. 6, 487–498 10.1038/nrm1664 [DOI] [PubMed] [Google Scholar]
- Gil-Henn H., Destaing O., Sims N. A., Aoki K., Alles N., Neff L., Sanjay A., Bruzzaniti A., De Camilli P., Baron R. et al. (2007). Defective microtubule-dependent podosome organization in osteoclasts leads to increased bone density in Pyk2(-/-) mice. J. Cell Biol. 178, 1053–1064 10.1083/jcb.200701148 [DOI] [PMC free article] [PubMed] [Google Scholar]
- Gimona M., Buccione R., Courtneidge S. A., Linder S. (2008). Assembly and biological role of podosomes and invadopodia. Curr. Opin. Cell Biol. 20, 235–241 10.1016/j.ceb.2008.01.005 [DOI] [PubMed] [Google Scholar]
- Goode N., Hughes K., Woodgett J. R., Parker P. J. (1992). Differential regulation of glycogen synthase kinase-3 beta by protein kinase C isotypes. J. Biol. Chem. 267, 16878–16882. [PubMed] [Google Scholar]
- Hai C. M., Hahne P., Harrington E. O., Gimona M. (2002). Conventional protein kinase C mediates phorbol-dibutyrate-induced cytoskeletal remodeling in a7r5 smooth muscle cells. Exp. Cell Res. 280, 64–74 10.1006/excr.2002.5592 [DOI] [PubMed] [Google Scholar]
- Hammond J. W., Huang C. F., Kaech S., Jacobson C., Banker G., Verhey K. J. (2010). Posttranslational modifications of tubulin and the polarized transport of kinesin-1 in neurons. Mol. Biol. Cell 21, 572–583 10.1091/mbc.E09-01-0044 [DOI] [PMC free article] [PubMed] [Google Scholar]
- Hoogenraad C. C., Akhmanova A. (2010). Dendritic spine plasticity: new regulatory roles of dynamic microtubules. Neurosci. 16, 650–661. [DOI] [PubMed] [Google Scholar]
- Hoshino D., Branch K. M., Weaver A. M. (2013). Signaling inputs to invadopodia and podosomes. J. Cell Sci. 126, 2979–2989 10.1242/jcs.079475 [DOI] [PMC free article] [PubMed] [Google Scholar]
- Jaulin F., Kreitzer G. (2010). KIF17 stabilizes microtubules and contributes to epithelial morphogenesis by acting at MT plus ends with EB1 and APC. J. Cell Biol. 190, 443–460 10.1083/jcb.201006044 [DOI] [PMC free article] [PubMed] [Google Scholar]
- Jurdic P., Saltel F., Chabadel A., Destaing O. (2006). Podosome and sealing zone: specificity of the osteoclast model. Eur. J. Cell Biol. 85, 195–202 10.1016/j.ejcb.2005.09.008 [DOI] [PubMed] [Google Scholar]
- Kaverina I., Straube A. (2011). Regulation of cell migration by dynamic microtubules. Semin. Cell Dev. Biol. 22, 968–974 10.1016/j.semcdb.2011.09.017 [DOI] [PMC free article] [PubMed] [Google Scholar]
- Kaverina I., Krylyshkina O., Small J. V. (1999). Microtubule targeting of substrate contacts promotes their relaxation and dissociation. J. Cell Biol. 146, 1033–1044 10.1083/jcb.146.5.1033 [DOI] [PMC free article] [PubMed] [Google Scholar]
- Kaverina I., Stradal T. E., Gimona M. (2003). Podosome formation in cultured A7r5 vascular smooth muscle cells requires Arp2/3-dependent de-novo actin polymerization at discrete microdomains. J. Cell Sci. 116, 4915–4924 10.1242/jcs.00818 [DOI] [PubMed] [Google Scholar]
- Kopp P., Lammers R., Aepfelbacher M., Woehlke G., Rudel T., Machuy N., Steffen W., Linder S. (2006). The kinesin KIF1C and microtubule plus ends regulate podosome dynamics in macrophages. Mol. Biol. Cell 17, 2811–2823 10.1091/mbc.E05-11-1010 [DOI] [PMC free article] [PubMed] [Google Scholar]
- Kumar P., Lyle K. S., Gierke S., Matov A., Danuser G., Wittmann T. (2009). GSK3beta phosphorylation modulates CLASP-microtubule association and lamella microtubule attachment. J. Cell Biol. 184, 895–908 10.1083/jcb.200901042 [DOI] [PMC free article] [PubMed] [Google Scholar]
- Lacolley P., Regnault V., Nicoletti A., Li Z., Michel J. B. (2012). The vascular smooth muscle cell in arterial pathology: a cell that can take on multiple roles. Cardiovasc. Res. 95, 194–204 10.1093/cvr/cvs135 [DOI] [PubMed] [Google Scholar]
- Lansbergen G., Grigoriev I., Mimori-Kiyosue Y., Ohtsuka T., Higa S., Kitajima I., Demmers J., Galjart N., Houtsmuller A. B., Grosveld F. et al. (2006). CLASPs attach microtubule plus ends to the cell cortex through a complex with LL5beta. Dev. Cell 11, 21–32 10.1016/j.devcel.2006.05.012 [DOI] [PubMed] [Google Scholar]
- Lener T., Burgstaller G., Crimaldi L., Lach S., Gimona M. (2006). Matrix-degrading podosomes in smooth muscle cells. Eur. J. Cell Biol. 85, 183–189 10.1016/j.ejcb.2005.08.001 [DOI] [PubMed] [Google Scholar]
- Linder S., Hüfner K., Wintergerst U., Aepfelbacher M. (2000). Microtubule-dependent formation of podosomal adhesion structures in primary human macrophages. J. Cell Sci. 113, 4165–4176. [DOI] [PubMed] [Google Scholar]
- Linder S., Wiesner C., Himmel M. (2011). Degrading devices: invadosomes in proteolytic cell invasion. Annu. Rev. Cell Dev. Biol. 27, 185–211 10.1146/annurev-cellbio-092910-154216 [DOI] [PubMed] [Google Scholar]
- Liu J. S., Schubert C. R., Fu X., Fourniol F. J., Jaiswal J. K., Houdusse A., Stultz C. M., Moores C. A., Walsh C. A. (2012). Molecular basis for specific regulation of neuronal kinesin-3 motors by doublecortin family proteins. Mol. Cell 47, 707–721 10.1016/j.molcel.2012.06.025 [DOI] [PMC free article] [PubMed] [Google Scholar]
- McMichael B. K., Cheney R. E., Lee B. S. (2010). Myosin X regulates sealing zone patterning in osteoclasts through linkage of podosomes and microtubules. J. Biol. Chem. 285, 9506–9515 10.1074/jbc.M109.017269 [DOI] [PMC free article] [PubMed] [Google Scholar]
- Miller P. M., Folkmann A. W., Maia A. R., Efimova N., Efimov A., Kaverina I. (2009). Golgi-derived CLASP-dependent microtubules control Golgi organization and polarized trafficking in motile cells. Nat. Cell Biol. 11, 1069–1080 10.1038/ncb1920 [DOI] [PMC free article] [PubMed] [Google Scholar]
- Mimori-Kiyosue Y., Grigoriev I., Lansbergen G., Sasaki H., Matsui C., Severin F., Galjart N., Grosveld F., Vorobjev I., Tsukita S. et al. (2005). CLASP1 and CLASP2 bind to EB1 and regulate microtubule plus-end dynamics at the cell cortex. J. Cell Biol. 168, 141–153 10.1083/jcb.200405094 [DOI] [PMC free article] [PubMed] [Google Scholar]
- Murphy D. A., Courtneidge S. A. (2011). The ‘ins’ and ‘outs’ of podosomes and invadopodia: characteristics, formation and function. Nat. Rev. Mol. Cell Biol. 12, 413–426 10.1038/nrm3141 [DOI] [PMC free article] [PubMed] [Google Scholar]
- Oikawa T., Itoh T., Takenawa T. (2008). Sequential signals toward podosome formation in NIH-src cells. J. Cell Biol. 182, 157–169 10.1083/jcb.200801042 [DOI] [PMC free article] [PubMed] [Google Scholar]
- Proszynski T. J., Gingras J., Valdez G., Krzewski K., Sanes J. R. (2009). Podosomes are present in a postsynaptic apparatus and participate in its maturation. Proc. Natl. Acad. Sci. USA 106, 18373–18378 10.1073/pnas.0910391106 [DOI] [PMC free article] [PubMed] [Google Scholar]
- Purev E., Neff L., Horne W. C., Baron R. (2009). c-Cbl and Cbl-b act redundantly to protect osteoclasts from apoptosis and to displace HDAC6 from beta-tubulin, stabilizing microtubules and podosomes. Mol. Biol. Cell 20, 4021–4030 10.1091/mbc.E09-03-0248 [DOI] [PMC free article] [PubMed] [Google Scholar]
- Quintavalle M., Elia L., Condorelli G., Courtneidge S. A. (2010). MicroRNA control of podosome formation in vascular smooth muscle cells in vivo and in vitro. J. Cell Biol. 189, 13–22 10.1083/jcb.200912096 [DOI] [PMC free article] [PubMed] [Google Scholar]
- Quintavalle M., Elia L., Price J. H., Heynen-Genel S., Courtneidge S. A. (2011). A cell-based high-content screening assay reveals activators and inhibitors of cancer cell invasion. Sci. Signal. 4, ra49 10.1126/scisignal.2002032 [DOI] [PMC free article] [PubMed] [Google Scholar]
- Reed N. A., Cai D., Blasius T. L., Jih G. T., Meyhofer E., Gaertig J., Verhey K. J. (2006). Microtubule acetylation promotes kinesin-1 binding and transport. Curr. Biol. 16, 2166–2172 10.1016/j.cub.2006.09.014 [DOI] [PubMed] [Google Scholar]
- Rottiers P., Saltel F., Daubon T., Chaigne-Delalande B., Tridon V., Billottet C., Reuzeau E., Génot E. (2009). TGFbeta-induced endothelial podosomes mediate basement membrane collagen degradation in arterial vessels. J. Cell Sci. 122, 4311–4318 10.1242/jcs.057448 [DOI] [PubMed] [Google Scholar]
- Saltel F., Daubon T., Juin A., Ganuza I. E., Veillat V., Génot E. (2011). Invadosomes: intriguing structures with promise. Eur. J. Cell Biol. 90, 100–107 10.1016/j.ejcb.2010.05.011 [DOI] [PubMed] [Google Scholar]
- Schoumacher M., Goldman R. D., Louvard D., Vignjevic D. M. (2010). Actin, microtubules, and vimentin intermediate filaments cooperate for elongation of invadopodia. J. Cell Biol. 189, 541–556 10.1083/jcb.200909113 [DOI] [PMC free article] [PubMed] [Google Scholar]
- Teti A., Marchisio P. C., Zallone A. Z. (1991). Clear zone in osteoclast function: role of podosomes in regulation of bone-resorbing activity. Am. J. Physiol. 261, C1–C7. [DOI] [PubMed] [Google Scholar]
- Theisen U., Straube E., Straube A. (2012). Directional persistence of migrating cells requires Kif1C-mediated stabilization of trailing adhesions. Dev. Cell 23, 1153–1166 10.1016/j.devcel.2012.11.005 [DOI] [PubMed] [Google Scholar]
- van Helden S. F., Hordijk P. L. (2011). Podosome regulation by Rho GTPases in myeloid cells. Eur. J. Cell Biol. 90, 189–197 10.1016/j.ejcb.2010.05.008 [DOI] [PubMed] [Google Scholar]
- Wiesner C., Faix J., Himmel M., Bentzien F., Linder S. (2010). KIF5B and KIF3A/KIF3B kinesins drive MT1-MMP surface exposure, CD44 shedding, and extracellular matrix degradation in primary macrophages. Blood 116, 1559–1569 10.1182/blood-2009-12-257089 [DOI] [PubMed] [Google Scholar]
- Wittmann T., Waterman-Storer C. M. (2005). Spatial regulation of CLASP affinity for microtubules by Rac1 and GSK3beta in migrating epithelial cells. J. Cell Biol. 169, 929–939 10.1083/jcb.200412114 [DOI] [PMC free article] [PubMed] [Google Scholar]
Associated Data
This section collects any data citations, data availability statements, or supplementary materials included in this article.