

Abstract
Objective
Protein-energy wasting and inflammation are common and associated with an increased risk of mortality in hemodialysis (HD) patients. We examined the extent to which they mediate the associations of each other with death in this population.
Study Design
Retrospective analysis of the Hemodialysis (HEMO) Study data.
Setting
Prevalent HD patients.
Participants
One-thousand HEMO study participants with data available on C-reactive protein (CRP), body mass index (BMI), and serum creatinine.
Intervention
None.
Main Outcome Measure
The associations of CRP, BMI, and serum creatinine with time to all-cause mortality separately and together in multivariate Cox models.
Results
In 1,437 patient-years of follow-up, there were 265 (26.5%) all-cause deaths. Compared with the lowest CRP quartile, the highest quartile was associated with a hazard ratio (HR) of 2.02 (95% confidence interval [CI], 1.31–3.10) for all-cause mortality. This association of highest CRP quartile with mortality was not attenuated with further adjustment for BMI and serum creatinine (HR, 2.13; 95% CI, 1.38–3.30). When serum albumin was added to the model, the hazard of death associated with highest CRP quartile was modestly attenuated (HR, 1.88; 95% CI, 1.21–2.92). In contrast, both BMI (for each kg/m2 increase; HR, 0.94; 95% CI, 0.91–0.96 for all-cause mortality) and serum creatinine (for each mg/dL increase; HR, 0.85; 95% CI, 0.79–0.90 for all-cause mortality) had strong, independent protective effects. Further adjustment with CRP had a negligible effect on these associations.
Conclusion
The associations of markers of nutrition and inflammation with mortality are largely independent of each other in HD patients.
Protein-energy wasting (as reflected by low muscle mass and low body size) and inflammation are both strong predictors of death in dialysis patients. Further, the associations of inflammation with nutritional status might be bidirectional.1 Thus, protein-energy wasting might mediate the associations of inflammation with death, or inflammation might mediate the known inverse associations of body mass index (BMI) and serum creatinine with death2–4 in hemodialysis patients. If nutritional status mediates the associations of inflammation with death, then adjusting for nutritional markers will attenuate or eliminate the associations of inflammation with death in multivariable models. The degree of this attenuation would depend on the extent to which nutritional status mediates the associations of inflammation with death. Similarly, if inflammation mediates the inverse associations of BMI and serum creatinine with death, adjusting for inflammation will attenuate or eliminate the associations of BMI and serum creatinine with death in multivariable models.
To examine the hypothesis that inflammation and protein-energy wasting mediate the associations of each other with death, we analyzed the database of the prospective Hemodialysis (HEMO) Study, in which various clinical measures were carefully collected in a large cohort.
Methods
The details of the HEMO Study design were described elsewhere.5,6 In brief, the HEMO Study was a 2 × 2 factorial-design, randomized, controlled trial of hemodialysis patients in 15 centers in the United States, to examine the impact of standard versus high dialysis dose and low-flux versus high-flux dialyzer membranes on clinical outcomes. Patients were enrolled in the study from March 1995 until October 2000, and followed through December 2001. The collection of serum for C-reactive protein (CRP), however, started only in September 1999.
The predialysis plasma CRP measurements were performed by the HEMO central laboratory, using an immunoturbidimetric assay with reagents from Diasorin, Inc. (Stillwater, MN) and a Hitachi 747 analyzer (Hitachi, Indianapolis, IN). The lower limit of detection by the assay used was 6.9 mg/L. The predialysis serum albumin level was determined monthly at the HEMO central laboratory by rate nephelometry. Predialysis serum creatinine was recorded from local laboratory measurements of individual dialysis units at 6-month intervals. The patient’s height, obtained at study entry, and postdialysis weight measurements, obtained monthly, were used to calculate body mass index (BMI).
The baseline CRP value for an individual subject in the current analysis was defined as the maximum of the first three consecutive monthly CRP measurements, when serum creatinine concurrent with the third CRP measurement was also available. All other demographic, comorbidity, and laboratory data collected at time of CRP collection or the closest previous annual visit were used as baseline values. The HEMO Study used the Index of Coexistent Diseases (ICED) and the individual component conditions of the ICED to assess comorbidity. These indices were shown to predict all-cause mortality in earlier analyses.
All-cause and cardiovascular deaths were the outcomes of interest in the present analyses. Vital statistics were available in 100% of the randomized patients. The HEMO Study Outcomes Committee reviewed all cases of death to determine individual causes, as described earlier.5,7 Cardiovascular death was defined as deaths due to coronary events, arrhythmias, sudden cardiac death, congestive heart failure, or cerebrovascular events.7,8
Statistical Methods
Baseline differences among serum creatinine quartiles and BMI quartiles were tested, using analysis of variance for continuous variables and the Cochran-Mantel-Haenszel test for dichotomous variables.
Time to all-cause and time to cardiovascular death were examined separately, using Cox models in which patients were censored on December 31, 2000 (administrative end of study) or at loss to follow-up. Four sets of multivariate Cox regression models were used to examine the associations of CRP quartiles, BMI, and serum creatinine for either all-cause or cardiovascular death. In each model, the associations were adjusted for demographics, years on dialysis, comorbidity, serum bicarbonate concentration, and HEMO treatment arms. In the first set, associations of serum CRP quartiles with all-cause or cardiovascular death were examined to study the effects of inflammation on these outcomes. In the second set, the associations of BMI and serum creatinine with all-cause or cardiovascular deaths were examined to study the effects of nutrition on outcomes. In the third set, to study the effects of adjusting for CRP on the associations of BMI and serum creatinine with all-cause or cardiovascular death and vice versa, serum creatinine, BMI, and serum CRP quartiles were examined together. In the fourth set, serum albumin was added to the models in the third set.
Sensitivity Analyses
It is possible that the effects of inflammation on body size and serum creatinine level were not acute but delayed, i.e., there was a lag phase between inflammation and changes in nutrition. Hence, adjusting for BMI and serum creatinine measured concurrently with CRP might not capture the delayed effects of inflammation. Therefore, we conducted sensitivity analyses by repeating the above analyses with BMI and serum creatinine values determined 3 months after CRP measurement.
Results
Out of 1846 subjects enrolled in the HEMO Study, 1000 met the inclusion criteria of the present analysis. In this cohort, the mean age (±SD) was 57 ± 14 years, 57% were men, and 67% were African-American. Diabetes (57%), congestive heart failure (49%), and ischemic or other heart diseases (80%) were prevalent. The mean (±SD) BMI was 25.7 ± 5.4 kg/m2. The mean serum creatinine level was 10.4 ± 2.9 mg/dL, and the mean serum albumin level was 3.6 ± 0.4 g/dL. The distribution of CRP was skewed to the right, and 13.4% of participants had a CRP concentration below the threshold limit of the assay (6.9 mg/L). The median CRP was 18.3 mg/L, and the interquartile range was 11.0 to 35.6 mg/L. There were 510 and 490 patients randomized to the standard-dose (urea kinetic modeling data [Kt/V]) and high-dose arms, respectively, and 496 and 504 patients were randomized to the low-flux and high-flux arms, respectively. During 1437 patient-years of follow-up, there were 265 (26.5%) all-cause and 116 (11.6%) cardiovascular deaths. The longest duration of follow-up was 2 years and 4 months.
Table 1 summarizes the clinical characteristics of the 1000 patients by serum creatinine quartiles. Younger age, black race, and randomization to standard urea Kt/V arm were associated with higher serum creatinine levels. It should be noted that the baseline of the current analysis was based on the availability of CRP measurements, and not the time when randomization to treatment groups occurred. Further, higher serum creatinine was associated with a lower prevalence of diabetes and baseline cardiovascular conditions, as well as lower concentrations of CRP (Table 1). On the other hand, a higher BMI was associated with a greater prevalence of diabetes (Table 2). There were no clear trends in the prevalence of cardiovascular conditions or CRP concentrations by BMI quartiles.
Table 1.
Baseline Characteristics According to Serum Creatinine Quartiles
| Serum Creatinine Q1 (<8.7) (N = 282) |
Serum Creatinine Q2 (8.7–10.5) (N = 248) |
Serum Creatinine Q3 (10.6–12.4) (N = 233) |
Serum Creatinine Q4 (>12.4) (N=5 237) |
P Value* | |
|---|---|---|---|---|---|
| Serum creatinine (mg/dL) | 7.1 ± 1.2 | 9.6 ± 0.5 | 11.4 ± 0.6 | 14.4 ± 1.9 | |
| BMI (kg/m2) | 25.3 ± 5.9 | 25.6 ± 5.1 | 26.1 ± 5.4 | 25.9 ± 5.3 | .34 |
| Demographics | |||||
| Age (y) | 63 ± 12 | 59 ± 14 | 57 ± 13 | 49 ± 13 | <.001 |
| Male gender | 71% | 62% | 57% | 37% | .01 |
| Black race | 51% | 68% | 74% | 80% | <.001 |
| Dialysis characteristics | |||||
| HEMO high Kt/V group | 60% | 52% | 47% | 35% | <.001 |
| HEMO high-flux group | 51% | 48% | 55% | 47% | .28 |
| Dialysis vintage (y) | 2.6 ± 3.7 | 3.6 ± 4.7 | 3.7 ± 4.2 | 3.7 ± 4.1 | .01 |
| Comorbidity | |||||
| Diabetes | 60% | 51% | 36% | 22% | <.001 |
| Congestive heart failure | 63% | 50% | 42% | 38% | <.001 |
| Arrhythmias and conduction defects | 52% | 42% | 43% | 28% | <.001 |
| Ischemic and other heart disease | 86% | 82% | 77% | 75% | .009 |
| Cerebral and peripheral vascular disease | 62% | 45% | 37% | 27% | <.001 |
| Gastrointestinal disease | 65% | 65% | 57% | 49% | .001 |
| Respiratory disease | 28% | 17% | 19% | 15% | .001 |
| Nonvascular nervous system disease | 61% | 52% | 47% | 35% | <.001 |
| Malignancy | 11% | 10% | 14% | 6% | .03 |
| Laboratory data | |||||
| Log CRP (mg/L) | 3.1 ± 0.8 | 3.0 ± 0.7 | 2.9± 0.7 | 2.8 ± 0.6 | <.001 |
| Serum albumin (g/dL) | 3.4 ± 0.5 | 3.5 ± 0.4 | 3.6 ± 0.4 | 3.8 ± 0.4 | <.001 |
| Serum bicarbonate (mEq/L) | 21.6 ± 4.1 | 21.1 ± 4.1 | 21.3 ± 4.0 | 20.5 ± 4.1 | .02 |
Q, quartile; BMI, body mass index; HEMO, Hemodialysis Study; CRP, C-reactive protein.
P values calculated by analysis of variance for continuous variables and Cochran-Mantel-Haenszel tests.
Table 2.
Baseline Characteristics by BMI Quartiles
| BMI Q1 (<21.8) (N = 254) |
BMI Q2 (21.8–25.0) (N = 248) |
BMI Q3 (25.1–28.7) (N = 238) |
BMI Q4 (>28.7) (N = 260) |
P Value* | |
|---|---|---|---|---|---|
| BMI (kg/m2) | 19.7 ± 1.6 | 23.3 ± 0.9 | 26.8 ± 1.0 | 32.9 ± 3.9 | |
| Serum creatinine (mg/dL) | 10.2 ± 3.0 | 10.5 ± 2.9 | 10.7 ± 3.1 | 10.4 ± 2.7 | .23 |
| Demographics | |||||
| Age (y) | 53 ± 16 | 56 ± 14 | 59 ± 12 | 59 ± 12 | <.001 |
| Male gender | 56% | 48% | 56% | 69% | <.001 |
| Black race | 69% | 64% | 73% | 64% | .14 |
| Dialysis characteristics | |||||
| HEMO high Kt/V group | 49% | 48% | 46% | 52% | .54 |
| HEMO high-flux group | 49% | 53% | 46% | 53% | .33 |
| Dialysis vintage (y) | 2.6 ± 3.7 | 3.6 ± 4.7 | 3.7 ± 4.2 | 3.7 ± 4.1 | .01 |
| Comorbidity | |||||
| Diabetes | 28% | 36% | 50% | 59% | <.001 |
| Congestive heart failure | 50% | 50% | 48% | 49% | .97 |
| Arrhythmias and conduction defects | 42% | 44% | 41% | 40% | .82 |
| Ischemic and other heart disease | 83% | 78% | 77% | 83% | .18 |
| Cerebral and peripheral vascular disease | 41% | 46% | 41% | 45% | .49 |
| Gastrointestinal disease | 61% | 61% | 56% | 59% | .60 |
| Respiratory disease | 22% | 18% | 16% | 24% | .10 |
| Nonvascular nervous system disease | 50% | 50% | 44% | 52% | .25 |
| Malignancy | 10% | 11% | 8% | 12% | .69 |
| Laboratory data | |||||
| Log CRP (mg/L) | 3.0 ± 0.8 | 2.9 ± 0.7 | 2.9 ± 0.7 | 3.0 ± 0.7 | .30 |
| Serum albumin (g/dL) | 3.6 ± 0.5 | 3.6 ± 0.5 | 3.6 ± 0.4 | 3.5 ± 0.4 | .08 |
| Serum bicarbonate (mEq/L) | 20.9 ± 4.7 | 21.1 ± 4.1 | 21.1 ± 3.9 | 21.4 ± 3.6 | .66 |
Q, quartile; BMI, body mass index; HEMO, Hemodialysis Study; CRP, C-reactive protein.
P values calculated by ANOVA for continuous variables and Cochran-Mantel-Haenszel tests.
Both BMI and serum creatinine had inverse associations with all-cause and cardiovascular deaths (Figs. 1–4) unadjusted for other variables. On the other hand, higher serum CRP concentrations were associated with an increased risk of all-cause and cardiovascular deaths (Figs. 5, 6). Adjusted associations of body size, serum creatinine, and CRP with all-cause and cardiovascular deaths are presented in Tables 3 and 4.
Figure 1.
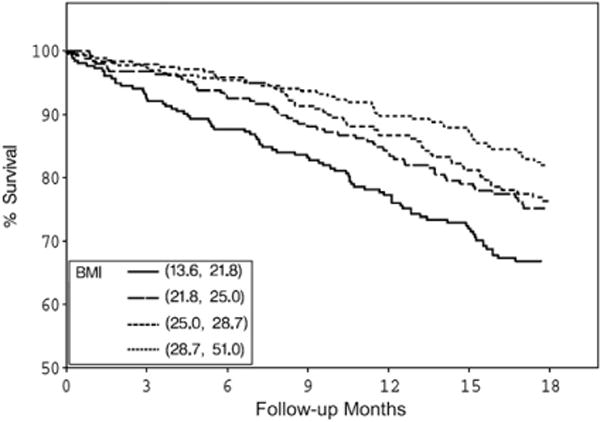
Survival by BMI quartiles. BMI, body mass index.
Figure 4.
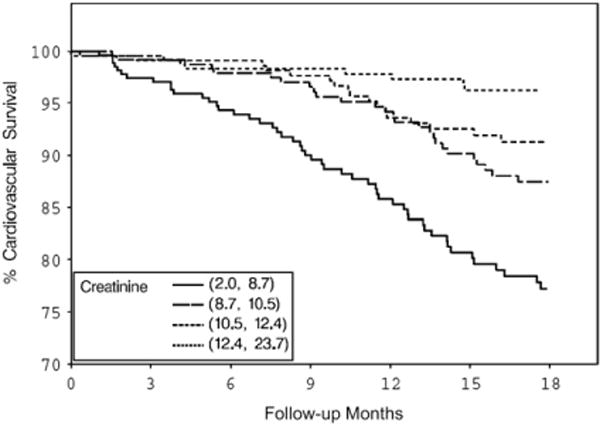
Cardiovascular survival by serum creatinine quartiles.
Figure 5.
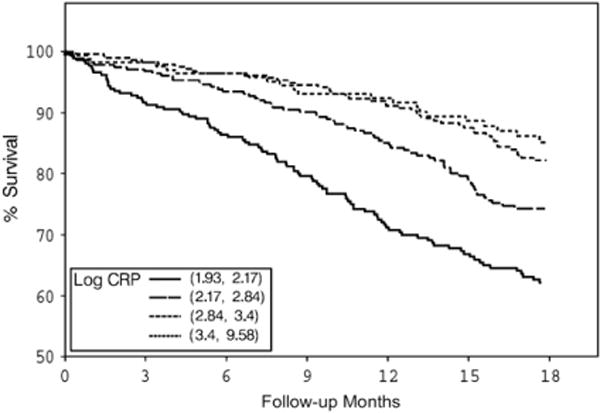
Survival by log of serum CRP quartiles. CRP, C-reactive protein.
Figure 6.
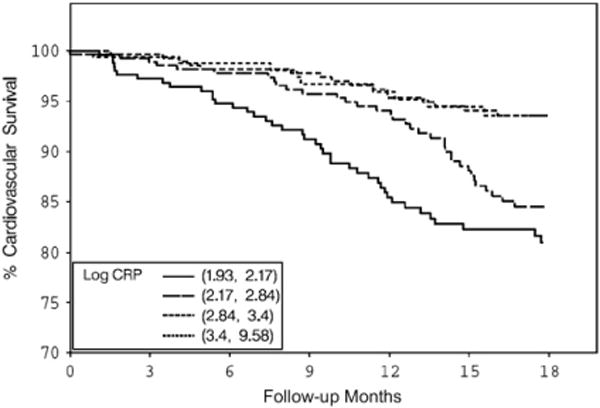
Cardiovascular survival by log of serum CRP quartiles. CRP, C-reactive protein.
Table 3.
Associations of Nutritional Parameters and CRP With All-Cause Mortality
| Model A* Hazard Ratio (95% CI) |
Model B† Hazard Ratio (95% CI) |
Model C‡ Hazard Ratio (95% CI) |
Model D§ Hazard Ratio (95% CI) |
|
|---|---|---|---|---|
| Log CRP (mg/L) quartiles | ||||
| <2.17 | Reference | Reference | Reference | |
| ≥2.17 and, 2.84 | 1.02 (0.64–1.64) | 1.07 (0.67–1.73) | 1.06 (0.66–1.70) | |
| ≥2.84 and, 3.40 | 1.37 (0.88–2.14) | 1.49 (0.95–2.34) | 1.44 (0.92–2.27) | |
| ≥3.40 | 2.02 (1.31–3.10) | 2.13 (1.38–3.30) | 1.88 (1.21–2.92) | |
| BMI (each kg/m2 increase) | 0.93 (0.90–0.96) | 0.93 (0.91–0.96) | 0.93 (0.91–0.96) | |
| Serum creatinine (each mg/dL increase) | 0.85 (0.80–0.91) | 0.85 (0.80–0.91) | 0.87 (0.81–0.92) | |
| Serum albumin (each g/dL increase) | 0.59 (0.43–0.82) |
BMI, body mass index; CRP, C-reactive protein; CI, confidence interval; HEMO, Hemodialysis Study.
CRP was adjusted for demographics, dialysis vintage, HEMO treatment groups, comorbidity, and serum bicarbonate.
BMI and serum creatinine were adjusted for above covariates.
CRP, BMI, and serum creatinine were adjusted for above covariates.
CRP, BMI, serum creatinine, and serum albumin were adjusted for above covariates.
Table 4.
Associations of CRP and Nutritional Parameters With Cardiovascular Mortality
| Model A* Hazard Ratio (95% CI) |
Model B† Hazard Ratio (95% CI) |
Model C‡ Hazard Ratio (95% CI) |
Model D§ Hazard Ratio (95% CI) |
|
|---|---|---|---|---|
| Log CRP (mg/L) quartiles | ||||
| <2.17 | Reference | Reference | Reference | |
| ≥2.17 and, 2.84 | 0.96 (0.45–2.05) | 0.97 (0.45–2.07) | 0.96 (0.45–2.05) | |
| ≥2.84 and, 3.40 | 1.91 (0.97–3.77) | 2.03 (1.03–4.02) | 1.98 (1.00–3.92) | |
| ≥3.40 | 2.20 (1.12–4.29) | 2.17 (1.10–4.27) | 2.01 (1.01–4.00) | |
| BMI (each kg/m2 increase) | 0.96 (0.92–1.00) | 0.95 (0.91–0.99) | 0.95 (0.91–0.99) | |
| Serum creatinine (each mg/dL increase) | 0.84 (0.76–0.92) | 0.86 (0.77–0.94) | 0.86 (0.78–0.95) | |
| Serum albumin (each g/dL increase) | 0.73 (0.45–1.21) |
BMI, body mass index; CRP, C-reactive protein; CI, confidence interval; HEMO, Hemodialysis Study.
CRP was adjusted for demographics, dialysis vintage, HEMO treatment groups, comorbidity, and serum bicarbonate.
BMI and serum creatinine were adjusted for above covariates.
CRP, BMI, and serum creatinine were adjusted for above covariates.
CRP, BMI, serum creatinine, and serum albumin were adjusted for above covariates.
When adjusted for demographics, years on dialysis, HEMO randomized groups, comorbidity, and serum bicarbonate (Model A in Tables 3 and 4), the highest compared to the lowest CRP quartile was associated with an increased hazard of all-cause and cardiovascular mortality. Further adjustment for BMI and serum creatinine (Model C in Tables 3 and 4) did not attenuate these associations. When serum albumin was added (Model D in Tables 3 and 4) to these models, the associations of CRP with all-cause and cardiovascular mortality were attenuated by ~20%. Thus, these data suggest that most of CRP’s influence on all-cause and cardiovascular deaths was not confounded or mediated through loss of muscle mass or low BMI.
On the other hand, both BMI and serum creatinine had a strong, independent protective effect on all-cause and cardiovascular mortality when adjusted for demographics, dialysis vintage, HEMO treatment groups, comorbidity, and serum bicarbonate (Model B in Tables 3 and 4). Further adjustment with CRP (Model C in Tables 3 and 4) or both CRP and serum albumin (Model D in Tables 3 and 4) had a negligible effect on these associations. Thus, these data suggest that the inverse associations of BMI and serum creatinine are largely independent of inflammation.
Sensitivity Analyses
To examine the hypothesis that the effects of inflammation on body size and muscle mass are delayed, the main analyses described above were repeated in 911 patients in whom serum creatinine and BMI measurements were available 3 months after CRP measurement. When adjusted for demographics and comorbidity, CRP was associated with a higher hazard of death (for each log unit increase in CRP: hazard ratio, 1.33; 95% confidence interval, 1.10–1.62). This was modestly attenuated (for each log unit increase in CRP: hazard ratio, 1.30; 95% confidence interval, 1.07–1.58) when further adjusted for BMI and serum creatinine measured 3 months after CRP measurement.
Discussion
The results of this study indicate that in hemodialysis patients, the associations of body size and serum creatinine with mortality are likely independent of inflammation. On the other hand, a modest attenuation of the associations of inflammation with mortality is seen when adjusted for body size and serum creatinine. Similar associations persisted with further adjustment for serum albumin. Hence, these results suggest that the complex of inflammation with protein-energy wasting could explain only a minor part of the mortality risk associated with either inflammation or protein-energy wasting. These results will be interpreted in the context of the current literature.
The National Kidney Foundation guidelines on nutrition in chronic kidney disease consider body size and serum creatinine (as an indicator of muscle mass) to be measures of nutritional status in hemodialysis patients.9 However, it was suggested that the state of low body weight, muscle mass, and serum proteins commonly seen in dialysis patients is not the result of deficient nutrition, and hence these are not indicators of nutritional status.10,11 For example, tumor necrosis factor-α activates the ubiquitin-proteasome proteolytic system,12–15 which is considered a major pathway for protein catabolism.16 Thus, it was suggested that inflammation may be a major determinant of muscle-wasting in dialysis patients.11 In a previous analysis of HEMO Study participants, very high serum levels of CRP were associated with decreased serum creatinine levels.17 In a separate study, the mid-thigh muscle mass estimated by computed tomography was also negatively associated with CRP.18 In addition to increased catabolism, inflammation may also suppress appetite, resulting in protein-energy wasting.19–22 Thus, it is biologically plausible that inflammation causes low body size and muscle mass in dialysis patients. Nonetheless, to our knowledge, longitudinal associations between inflammation and a change in BMI have not been reported in dialysis patients. Furthermore, an association between inflammation and protein-energy wasting does not necessarily indicate that inflammation is the explanation for the association of low body size and low muscle mass with mortality.
The term malnutrition-inflammation complex syndrome connotes a biological complex of malnutrition with inflammation, where the effects of inflammation and malnutrition on death are largely mediated through each other.19 If body size and muscle mass are either confounders or mediators of the associations of inflammation with mortality, adjusting for these variables would largely attenuate the associations of CRP with mortality. However, the hazard associated with CRP was not attenuated when adjusted for BMI and serum creatinine (Tables 3 and 4). Further adjustment for serum albumin resulted in an attenuation of ~20% of the associations of CRP with all-cause and cardiovascular mortality. Nonetheless, because serum albumin is predominantly influenced by inflammation in hemodialysis patients, it is unclear whether this attenuation is due to inflammatory or nutritional factors influencing serum albumin. Thus, even though it is difficult to draw inferences about serum albumin, the results suggest that the effects of inflammation on mortality in hemodialysis patients might not be predominantly mediated through a decrease in body size or muscle mass.
Moreover, if inflammation is either a confounder or mediator of the associations of BMI and serum creatinine with mortality, adjusting for CRP in multivariate models should largely attenuate these associations. On the contrary, the data presented in Tables 3 and 4 suggest that the strong associations of BMI and serum creatinine with all-cause and cardiovascular mortality might be largely independent of inflammation.
Thus the results of this study suggest that inflammation and protein-energy wasting have independent effects on survival in hemodialysis patients, and the complex of inflammation with protein-energy wasting is unlikely to account for either the associations of inflammation with death or of protein-energy wasting with death.
It should be noted that these results are based on a moderately sensitive CRP assay. However, a few issues need to be considered. First, the advantage of a high-sensitivity CRP assay over a moderately sensitive assay is its ability to measure lower concentrations of CRP, and thus detect low-grade inflammation. However, the median CRP in this cohort was 18.3 mg/L, and only 13.4% of patients had CRP below the lower threshold (6.9 mg/L) of detection of the assay. The reasons for the high CRP concentrations observed in the hemodialysis patients are not clear. Nonetheless, if severe inflammation as identified by a moderately sensitive CRP assay does not explain the associations of BMI and serum creatinine with mortality, it is less likely that the subtle inflammation identified by a more sensitive CRP assay would explain those associations. Second, in a study of 803 nondialysis patients, there was a high correlation between the high-sensitivity assay and older CRP assays, and the predictive values for death and myocardial infarction were similar among these assays; thus the conclusions of studies that used moderately sensitive CRP assays are still likely to be valid.23 Third, the results of the current study are in accordance with the findings of Pupim et al. in a single-center study of 194 hemodialysis patients, in whom phase angle by bioelectrical impedance analysis and serum levels of creatinine, albumin, and prealbumin predicted all-cause death independent of serum CRP concentrations, as measured by a high-sensitivity CRP assay.24 However, that study did not examine to what extent protein-energy wasting and inflammation mediated the associations between each other and mortality.
Because of its variability, CRP might not be the most sensitive and specific marker of inflammation. It remains to be seen whether other markers of inflammation, such as interleukin-6, better account for the associations of body size and muscle mass with mortality in hemodialysis patients.
The strengths of this study include the careful collection of data on a large number of hemodialysis patients across 15 centers in the United States. Further, three consecutive monthly CRP measurements were used as the baseline value in this subgroup of the HEMO cohort. There are also several limitations to this study. First, CRP data were available in only a subset of the HEMO cohort, and not in all participants. However, CRP was measured in all HEMO Study participants starting in 1999. Hence, the lack of CRP data on some HEMO Study participants is unlikely to bias the results of the present analysis. Second, the serum creatinine level used in the present analysis is only a crude indicator of muscle mass. Even though dialysis dose influenced serum creatinine concentrations (Table 1), the analyses were adjusted for HEMO treatment arm. Further, this study directly examined whether the known inverse association of serum creatinine with mortality in hemodialysis patients is explained by inflammation. Finally, this was a retrospective observational study, with all the shortcomings of such analyses.
In conclusion, the present analysis suggests that only a modest proportion of the associations of inflammation with mortality might be mediated through body size and muscle mass in chronic hemodialysis patients. Moreover, inflammation is unlikely to account for the inverse associations of serum creatinine concentration or BMI with all-cause and cardiovascular mortality in hemodialysis patients. Further studies are warranted to determine the mechanisms through which low BMI and low muscle mass contribute to increased mortality in this population.
Figure 2.
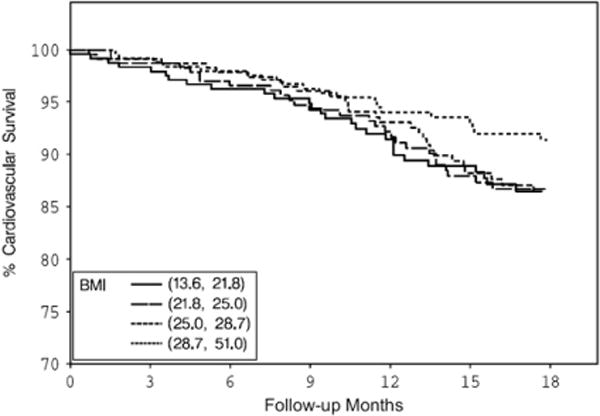
Cardiovascular survival by BMI quartiles. BMI, body mass index.
Figure 3.
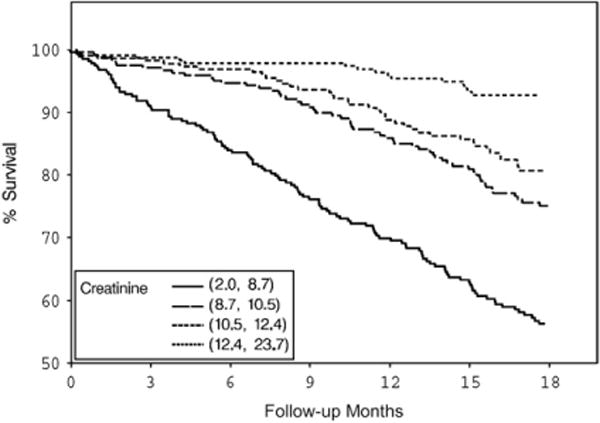
Survival by serum creatinine quartiles.
Acknowledgments
This work was funded by the National Institute of Diabetes and Digestive and Kidney Diseases (NIDDK).
Footnotes
This article has an online CPE activity available at www.kidney.org/professionals/CRN/ceuMain.cfm
References
- 1.Kalantar-Zadeh K, Abbott KC, Salahudeen AK, Kilpatrick RD, Horwich TB. Survival advantages of obesity in dialysis patients. Am J Clin Nutr. 2005;81:543–554. doi: 10.1093/ajcn/81.3.543. [DOI] [PubMed] [Google Scholar]
- 2.Johansen KL, Young B, Kaysen GA, Chertow GM. Association of body size with outcomes among patients beginning dialysis. Am J Clin Nutr. 2004;80:324–332. doi: 10.1093/ajcn/80.2.324. [DOI] [PubMed] [Google Scholar]
- 3.Kopple JD, Zhu X, Lew NL, Lowrie EG. Body weight-for-height relationships predict mortality in maintenance hemodialysis patients. Kidney Int. 1999;56:1136–1148. doi: 10.1046/j.1523-1755.1999.00615.x. [DOI] [PubMed] [Google Scholar]
- 4.Pifer TB, McCullough KP, Port FK, et al. Mortality risk in hemodialysis patients and changes in nutritional indicators: DOPPS. Kidney Int. 2002;62:2238–2245. doi: 10.1046/j.1523-1755.2002.00658.x. [DOI] [PubMed] [Google Scholar]
- 5.Eknoyan G, Beck GJ, Cheung AK, et al. Effect of dialysis dose and membrane flux in maintenance hemodialysis. N Engl J Med. 2002;347:2010–2019. doi: 10.1056/NEJMoa021583. [DOI] [PubMed] [Google Scholar]
- 6.Greene T, Beck GJ, Gassman JJ, et al. Design and statistical issues of the Hemodialysis (HEMO) Study. Control Clin Trials. 2000;21:502–525. doi: 10.1016/s0197-2456(00)00062-3. [DOI] [PubMed] [Google Scholar]
- 7.Cheung AK, Sarnak MJ, Kaufman A, et al. Cardiac diseases in maintenance hemodialysis patients: results of the HEMO Study. Kidney Int. 2004;65:2380–2389. doi: 10.1111/j.1523-1755.2004.00657.x. [DOI] [PubMed] [Google Scholar]
- 8.Delmez JA, Yan G, Bailey J, et al. Cerebrovascular disease in maintenance hemodialysis patients: results of the HEMO Study. Am J Kidney Dis. 2006;47:131–138. doi: 10.1053/j.ajkd.2005.09.031. [DOI] [PubMed] [Google Scholar]
- 9.Clinical practice guidelines for nutrition in chronic renal failure. K/DOQI, National Kidney Foundation. Am J Kidney Dis. 2000;35(Suppl):S1–S140. doi: 10.1053/ajkd.2000.v35.aajkd03517. [DOI] [PubMed] [Google Scholar]
- 10.Ahuja TS, Mitch WE. The evidence against malnutrition as a prominent problem for chronic dialysis patients. Semin Dial. 2004;17:427–431. doi: 10.1111/j.0894-0959.2004.17602.x. [DOI] [PubMed] [Google Scholar]
- 11.Mitch WE. Malnutrition: a frequent misdiagnosis for hemodialysis patients. J Clin Invest. 2002;110:437–439. doi: 10.1172/JCI16494. [DOI] [PMC free article] [PubMed] [Google Scholar]
- 12.Goldberg AL, Kettelhut IC, Furuno K, Fagan JM, Baracos V. Activation of protein breakdown and prostaglandin E2 production in rat skeletal muscle in fever is signaled by a macrophage product distinct from interleukin 1 or other known monokines. J Clin Invest. 1988;81:1378–1383. doi: 10.1172/JCI113466. [DOI] [PMC free article] [PubMed] [Google Scholar]
- 13.Pickering WP, Price SR, Bircher G, Marinovic AC, Mitch WE, Walls J. Nutrition in CAPD: serum bicarbonate and the ubiquitin-proteasome system in muscle. Kidney Int. 2002;61:1286–1292. doi: 10.1046/j.1523-1755.2002.00276.x. [DOI] [PubMed] [Google Scholar]
- 14.Goodman MN. Tumor necrosis factor induces skeletal muscle protein breakdown in rats. Am J Physiol. 1991;260:E727–E730. doi: 10.1152/ajpendo.1991.260.5.E727. [DOI] [PubMed] [Google Scholar]
- 15.Pupim LB, Flakoll PJ, Brouillette JR, Levenhagen DK, Hakim RM, Ikizler TA. Intradialytic parenteral nutrition improves protein and energy homeostasis in chronic hemodialysis patients. J Clin Invest. 2002;110:483–492. doi: 10.1172/JCI15449. [DOI] [PMC free article] [PubMed] [Google Scholar]
- 16.Mitch WE, Goldberg AL. Mechanisms of muscle wasting. The role of the ubiquitin-proteasome pathway. N Engl J Med. 1996;335:1897–1905. doi: 10.1056/NEJM199612193352507. [DOI] [PubMed] [Google Scholar]
- 17.Kaysen GA, Greene T, Daugirdas JT, et al. Longitudinal and cross-sectional effects of C-reactive protein, equilibrated normalized protein catabolic rate, and serum bicarbonate on creatinine and albumin levels in dialysis patients. Am J Kidney Dis. 2003;42:1200–1211. doi: 10.1053/j.ajkd.2003.08.021. [DOI] [PubMed] [Google Scholar]
- 18.Kaizu Y, Ohkawa S, Odamaki M, et al. Association between inflammatory mediators and muscle mass in long-term hemodialysis patients. Am J Kidney Dis. 2003;42:295–302. doi: 10.1016/s0272-6386(03)00654-1. [DOI] [PubMed] [Google Scholar]
- 19.Kalantar-Zadeh K, Ikizler TA, Block G, Avram MM, Kopple JD. Malnutrition-inflammation complex syndrome in dialysis patients: causes and consequences. Am J Kidney Dis. 2003;42:864–881. doi: 10.1016/j.ajkd.2003.07.016. [DOI] [PubMed] [Google Scholar]
- 20.Kalantar-Zadeh K, Kopple JD, Block G, Humphreys MH. A malnutrition-inflammation score is correlated with morbidity and mortality in maintenance hemodialysis patients. Am J Kidney Dis. 2001;38:1251–1263. doi: 10.1053/ajkd.2001.29222. [DOI] [PubMed] [Google Scholar]
- 21.Stenvinkel P, Heimburger O, Lindholm B, Kaysen GA, Bergstrom J. Are there two types of malnutrition in chronic renal failure? Evidence for relationships between malnutrition, inflammation and atherosclerosis (MIA syndrome) Nephrol Dial Transplant. 2000;15:953–960. doi: 10.1093/ndt/15.7.953. [DOI] [PubMed] [Google Scholar]
- 22.Stenvinkel P, Heimburger O, Paultre F, et al. Strong association between malnutrition, inflammation, and atherosclerosis in chronic renal failure. Kidney Int. 1999;55:1899–1911. doi: 10.1046/j.1523-1755.1999.00422.x. [DOI] [PubMed] [Google Scholar]
- 23.Clarke JL, Anderson JL, Carlquist JF, et al. Intermountain Heart Collaborative Study Group Comparison of differing C-reactive protein assay methods and their impact on cardiovascular risk assessment. Am J Cardiol. 2005;95:155–158. doi: 10.1016/j.amjcard.2004.08.087. [DOI] [PubMed] [Google Scholar]
- 24.Pupim LB, Caglar K, Hakim RM, Shyr Y, Ikizler TA. Uremic malnutrition is a predictor of death independent of inflammatory status. Kidney Int. 2004;66:2054–2060. doi: 10.1111/j.1523-1755.2004.00978.x. [DOI] [PubMed] [Google Scholar]