Abstract
The fabrication of scaffolds for tissue engineering requires elements of customization depending on the application and is often limited due to the flexibility of the processing technique. This investigation seeks to address this obstacle by utilizing an open-source three-dimensional printing (3DP) system that allows vast customizability and facilitates reproduction of experiments. The effects of processing parameters on printed poly(ε-caprolactone) scaffolds with uniform and gradient pore architectures have been characterized with respect to fiber and pore morphology and mechanical properties. The results demonstrate the ability to tailor the fiber diameter, pore size, and porosity through modification of pressure, printing speed, and programmed fiber spacing. A model was also used to predict the compressive mechanical properties of uniform and gradient scaffolds, and it was found that modulus and yield strength declined with increasing porosity. The use of open-source 3DP technologies for printing tissue engineering scaffolds provides a flexible system that can be readily modified at a low cost and is supported by community documentation. In this manner, the 3DP system is more accessible to the scientific community, which further facilitates the translation of these technologies toward successful tissue engineering strategies.
Keywords: poly(ε-caprolactone), pore architecture, pore gradient, rapid prototyping, scaffold fabrication
Introduction
Polymers have been widely used in the fabrication of scaffolds for tissue engineering applications due to their desirable mechanical properties and ease of processing.1–3 Depending on the fabrication method, several processing parameters are known to have an impact on the polymer scaffold morphology. For instance, the effects of tunable parameters associated with electrospinning techniques, including voltage, collection distance, and polymer concentration, on the fiber diameter of poly(ε-caprolactone) (PCL) meshes have been investigated.4,5 Furthermore, the melting temperature of the material, polymer viscosity, operating pressure, and deposition speed are some parameters in three-dimensional printing (3DP) that can be modulated to create scaffolds of varying fiber diameter and pore size.6,7
The characterization of an appropriate scaffold architecture to encourage cell attachment, proliferation, migration, and differentiation is of primary importance.8 Moreover, it is beneficial to identify the range of pore sizes that is suitable to promote cell infiltration into the scaffold and allow nutrient and waste transport.9,10 The effects of fabrication parameters on pore size and porosity can then be evaluated to facilitate production of scaffolds with optimal architecture for a particular tissue engineering application.
3DP has been introduced as a promising rapid prototyping (RP) technique, as it enables the production of scaffolds with high pore interconnectivity and precise control over scaffold architecture.11,12 Several investigators have looked to expand the tissue engineering applications of RP to fabricate scaffolds with heterogeneous properties13–15 and drug delivery components.16 However, most of these proposed systems are either commercially available at a high cost or are custom-made, which limit the feasibility of replication of 3DP methods across the tissue engineering community.
In this investigation, a previously available open-source technology is applied, which greatly reduces production costs in terms of printer assembly and maintenance, as well as provides user support for those who seek to build similar systems. Additionally, open-source systems allow great flexibility in the material choice and scaffold design, enabling the fabrication of scaffolds with a wide variety of shapes and pore organizations. In the established system investigated herein, any CAD/CAM file can be uploaded to the printer software and printed with an open-source 3D printer. As an added benefit to the scientific community, the nature of the open-source technology allows any user to build an identical machine and repeat the same experiments at a relatively low cost.
This work utilizes an open-source system for the fabrication of 3DP PCL scaffolds. PCL is both biocompatible and biodegradable, acting as a mechanically robust support material with a low melting temperature to accommodate printing capabilities.17,18 In the first study, 3DP scaffolds were fabricated based on varying printing parameters to characterize the effects of printing speed, fiber spacing, and pressure on overall porosity and pore and fiber morphology. Optimal parameters were then used in the second study to print scaffolds for mechanical testing to determine the effects of fiber spacing and porosity on compressive mechanical properties.
Materials and Methods
Fabrication of uniform pore scaffolds for pore and fiber analysis
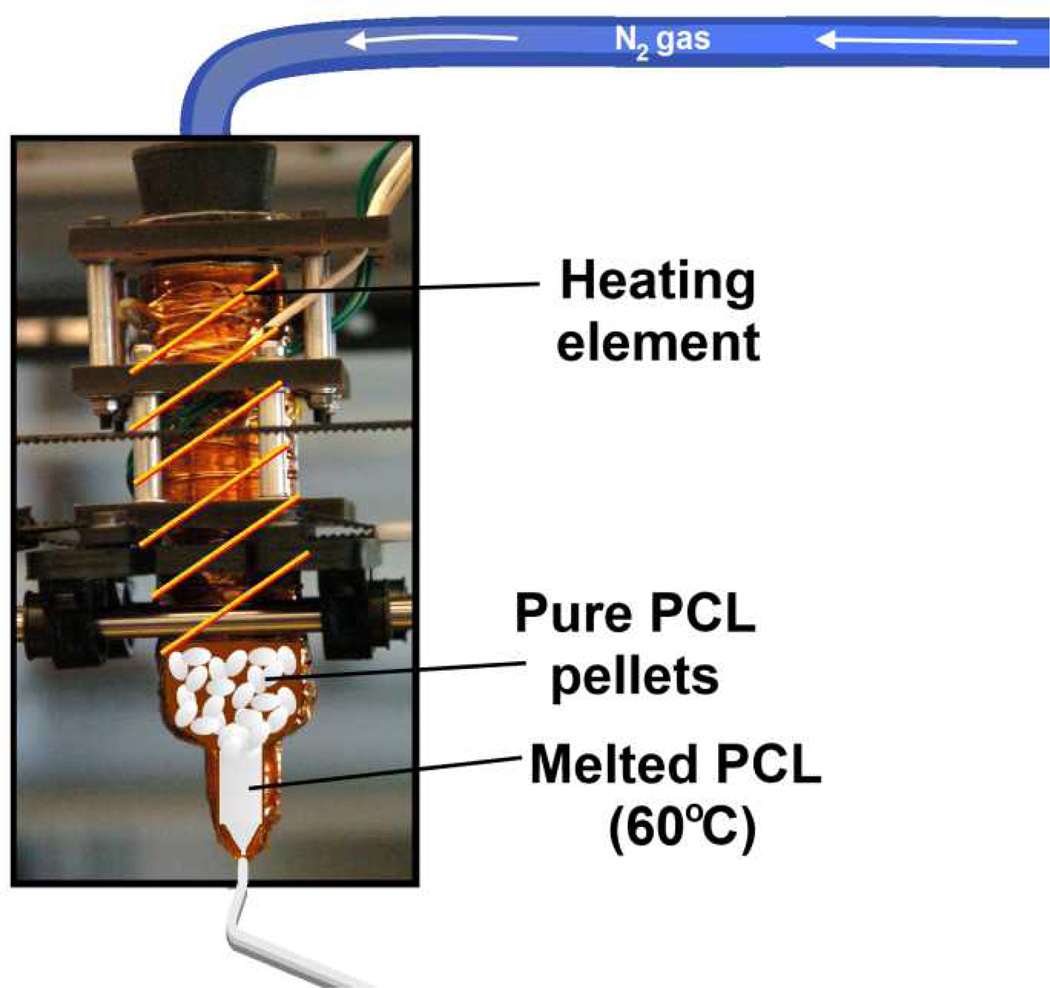
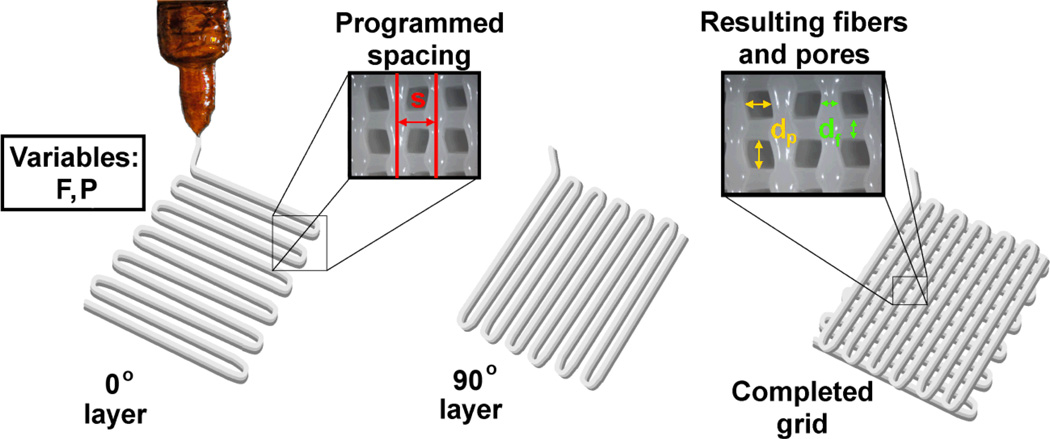
PCL (Mn = 10,000, Aldrich, St. Louis, MO) pellets were poured into a 50mL syringe-based extruder and heated above the melting temperature at 75°C for 3min. Once the PCL was melted, the temperature was lowered to 60°C for the remainder of the printing. The extruder (Figure 1) (BariCUDA, Thingiverse.com)19 and the RepRap Mendel 3D printer (MendelMax 1.5, Maker’s Tools Works, Oklahoma City, OK) were built using open-source electronics (RAMBo, Ultimachine, South Pittsburg, TN). The grid-shaped scaffolds were fabricated with varying programmed parameters (printing speed, F (mm/min); pressure, P (psi); fiber spacing, s (mm)) using custom Python scripts via open-source Pronterface software. Python scripts are provided in the supplemental materials section. PCL scaffolds were printed at 60°C through an 18-gauge (0.84mm inner diameter) stainless steel nozzle, and fiber extrusion was controlled pneumatically under nitrogen pressure (8–20psi). Each PCL layer was allowed to cool for a programmed amount of time (30s after a 0° layer (0°), 120s after a 90° layer (90°)) before the subsequent layer was printed (Figure 2). Samples were stored in petri dishes at room temperature before analysis.
Figure 1.
Photograph of BariCUDA extruder with schematic representations of heating and PCL components superimposed. Nitrogen gas is used to pneumatically control extrusion through a syringe-based extruder. Nichrome wire acts as a heating element around the entire surface of the syringe and melts the PCL pellets for facilitated extrusion. No solvents are needed for polymer extrusion in this system.
Figure 2.
Programmed fiber spacing (s, mm), printing speed (F, mm/min), and operating pressure (P, psi) are specified in the Python code to print 0° and 90° PCL layers. One 0° and one 90° layer are considered to be a complete grid with square pores. Pore size (dp, mm) and fiber diameter (df, mm) can be measured using optical microscopy and later used to calculate the experimental fiber spacing to compare to its corresponding programmed value (s).
In this study, scaffolds of uniform pore architecture (n = 4 per group) were fabricated following a full factorial design at varying pressures (8 < P < 20psi), printing speeds (300 or 400mm/min), and with varying fiber spacing (1.8, 2.0, 2.5mm) as described in Table 1. Printed layers were deposited in a 0–90° fashion as 20×20mm grids with 6 layers (3 of 0° and 3 of 90°) total. Figure 2 shows a schematic of the printing process, which details the parameters varied, as well as the architectures achieved with the custom code.
Table 1.
3D Printing Processing Conditions for Uniform PCL Scaffolds in a Full Factorial Design
| Factor | Print head speed (F, mm/min) |
Fiber spacing (s, mm) |
Temperature (T, °C) |
Operating pressure (P, psi) |
Delay time between layers (D, sec)* |
Layer height (z, mm) |
|---|---|---|---|---|---|---|
| # Levels/Factor | 2 | 3 | 1 | 7 | 1 | 1 |
| Levels | 300, 400 | 1.8, 2.0, 2.5 | 60 | 8, 10, 12, 14, 16, 18, 20 | 30 (0°), 120 (90°) | 0.2 (0°), 0.6 (90°) |
| Total printing formulations tested | 42 | |||||
(0°): after a 0° layer is printed, (90°): after a 90° layer is printed
Porosity measurements
According to previous methods,4 the porosity of the 3DP scaffolds for both the first and second studies was measured using gravimetry. Scaffold length (L), width (W), and thickness (T) were measured using micro-calipers in order to calculate the scaffold volume. Scaffolds were weighed (wscaffold) to determine the total porosity (ε) according to the following equation, where ρscaffold is the scaffold density, and ρmaterial is the density of PCL (1.146 g/mL) (Mn = 10,000, Aldrich, St. Louis, MO):
| (Equation 1) |
Fiber diameter and pore size measurements
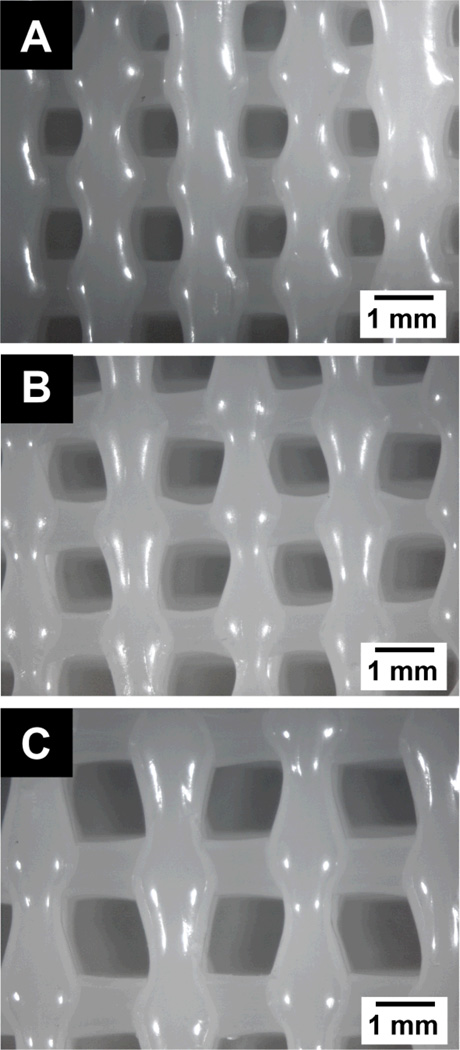
3DP PCL scaffolds were imaged with a stereomicroscope (MZ6, Leica Microsystems, Wetzlar, Germany), and representative images are shown in Figure 3. Fiber diameter and pore size measurements were made digitally by placing a caliper with a known span separation adjacent to the sample in the field of view – establishing a scale – and were recorded in the×and y direction. x and y measurements were combined and are reported as a total mean ± standard deviation.
Figure 3.
Representative optical micrograph (0.9× magnification) of a top view of a 3DP PCL scaffold with (A) s = 1.8mm, (B) s = 2.0mm, (C) s = 2.5mm.
Fiber spacing measurements
With the pore size and fiber diameter known, it was possible to calculate the experimental pore spacing, sexp, and compare it to the programmed (theoretical) pore spacing, where dp is the pore size, and Σdf is the sum of the two neighboring fiber diameters.
| (Equation 2) |
Fabrication of uniform and gradient pore scaffolds for mechanical testing
Uniform PCL scaffolds were printed as described above. However, scaffolds with gradient pore architectures were also printed according to the factorial design in Table 2. Both uniform (s = 1.2, 1.5, 2.0, 2.5mm) and gradient (s = 1.5/2.0, 1.5/2.5, 2.0/2.5) fiber spacings were investigated. Scaffolds with two pore sizes were printed with the smaller pore size (Pore A) on the bottom and the larger pore size (Pore B) on the top. Based on results from the pore and fiber analysis in the first study, scaffolds were printed (n = 3 per group) with a speed of F = 400mm/min at 60°C and 16psi. Scaffold dimensions were programmed as 20 × 20mm square grids with 8 total layers (4 layers each of Pore A and Pore B; approximately 3mm thickness). Since limited data exist providing the bulk compressive properties of PCL,20 a value of s = 1.2mm was selected as the standard fiber spacing that would result in a solid scaffold (based on fiber diameter results from the first study for scaffolds with F = 400mm/min, P = 16psi), which would allow for comparison of mechanical results to porous scaffolds.
Table 2.
3D Printing Processing Conditions for Uniform and Gradient PCL Scaffolds in a Full Factorial Design
| Factor | Print head speed (F, mm/min) |
Fiber spacing (s, mm) | Temperature (T, °C) |
Operating pressure (P, psi) |
Delay time between layers (D, sec) |
Layer height (z, mm)** |
||
|---|---|---|---|---|---|---|---|---|
| Uniform | Gradient | |||||||
| # Levels/Factor | 1 | 4 | 3 | 2* | 1 | 1 | 1 | 1 |
| Levels | 400 | 1.2, 1.5, 2.0, 2.5 | 1.5/2.0, 1.5/2.5, 2.0/2.5 | (Pa), (Pb) | 60 | 16 | 30 (0°), 120 (90°) | 0.2 (0°), 0.6 (90°) |
| Total printing formulations tested | 10*** | |||||||
(Pa) Scaffold was tested with smaller pore size on bottom
(Pb) Scaffold was tested with smaller pore size on top
(0°): 0° layer, (90°): 90° layer
4 + 3 × 2 = 10 formulations
Compressive mechanical measurements
Scaffold mechanical properties were measured to evaluate the influence of pore size and organization (gradient vs. uniform scaffolds) on compressive modulus and yield strength. Samples were subjected to compressive loading using a mechanical testing system (MTS, 858 Mini Bionix, Eden Prairie, MN) equipped with a 10kN load cell. Samples were compressed along their short axis (height) between two parallel fixed steel platens at a cross-head speed of 0.5mm/min after a preload of 25N was applied. Force and displacement were measured during compressive testing and later converted to stress and strain based on the initial dimensions of the scaffold.21 The compressive modulus and compressive yield strength were analyzed using the TestStar 790.90 mechanical data analysis package (MTS), where the modulus was calculated as the slope of the linear (elastic) region of the stress-strain curve. A parallel line was drawn to the linear region and was offset at 0.2% strain to calculate the compressive yield strength, which was applicable in cases where the offset line intersected with the stress-strain curve.22
Statistical analysis
All measurements are represented as the mean ± standard deviation. For statistical analysis, the means were compared using a one-way analysis of variance for each F/s combination (n = 4 for each pressure tested for the 6 groups in the first study, n = 3 for mechanical samples in the second study). Data were tested on a normal distribution and a p-value < 0.05 was considered to indicate significance, in which statistical differences were determined using Tukey’s Honestly Significant Differences test. Calculations were performed in Microsoft Excel. For mechanical testing, a linear regression was fit to the data using JMP Pro 10 software. For a best fit to the experimental data, natural logarithm transformations were applied to both the dependent and independent variables, corresponding to a power-law relationship. For theoretical predictions, the same natural logarithm transformations were applied, but the slope was fixed to m = 2 and n = 1.5 for compressive modulus and yield strength, respectively.
Results
Pore and fiber morphology of uniform pore scaffolds
In this study, the 3DP of PCL scaffolds was investigated using open-source technology. The effect of processing parameters (printing speed, pressure, and fiber spacing) on porosity, pore size, and fiber diameter was evaluated. In general, faster printing speeds required a higher operating pressure to achieve repeatable fabrication. It was found that at some pressures, it was not possible to print certain F/s combinations, which is indicated in Figures 4–6. Consequently, statistical comparisons among F/s combinations were not performed at a given pressure. Printing was possible for all combinations at 14psi, which was the mid-range pressure (8 < P < 20psi) tested in this study.
Figure 4.
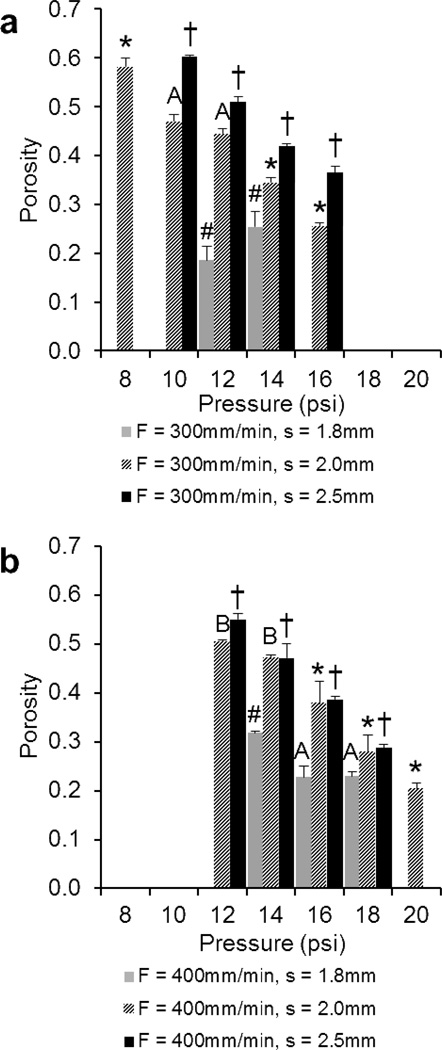
Comparison of the porosities of 3DP scaffolds printed at a) F = 300mm/min and b) 400mm/min measured using gravimetry. The data represent means of four samples with the error bars representing the standard deviations. One-way ANOVA was used to determine significant differences within each F/s combination (p < 0.05). Significance in (#) s = 1.8 group, (*) s = 2.0 group, (†) s = 2.5 group. A–B Values marked with same letter do not differ. Note: It was not possible to print all F/s combinations at P = 8, 10, 12, 16, 18, 20psi (where bars are absent).
Figure 6.
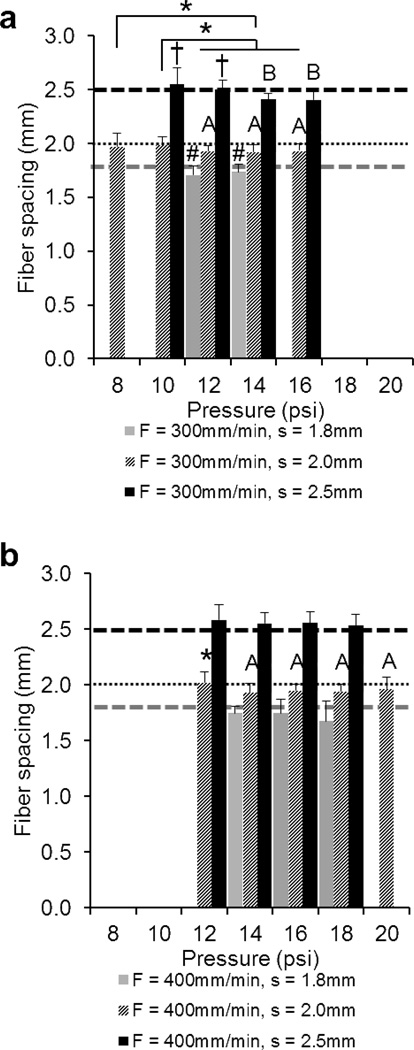
Comparison of the fiber spacings of 3DP scaffolds printed at a) F = 300mm/min and b) 400mm/min. The data represent means of four samples with the error bars representing the standard deviations. One-way ANOVA was used to determine significant differences within each F/s combination (p < 0.05). Significance in (#) s = 1.8 group, (*) s = 2.0 group, (†) s = 2.5 group. A–B Values marked with same letter do not differ. Note: It was not possible to print all F/s combinations at P = 8, 10, 12, 16, 18, 20psi (where bars are absent).
Porosity measurements
At printing speeds of 300 and 400mm/min, it was possible to fabricate scaffolds with a minimum porosity of 19±3% and 20±1% and a maximum of 60±0% and 55±1%, respectively. Average porosities for F = 300 and 400 were 40±13% and 36±12%, respectively. As shown in Figures 4a and b, porosity generally decreased with increasing pressure. Furthermore, for scaffolds with s = 2.5mm, a change in pressure resulted in a significant difference in porosity for both groups (F = 300 and 400).
Fiber diameter and pore size measurements
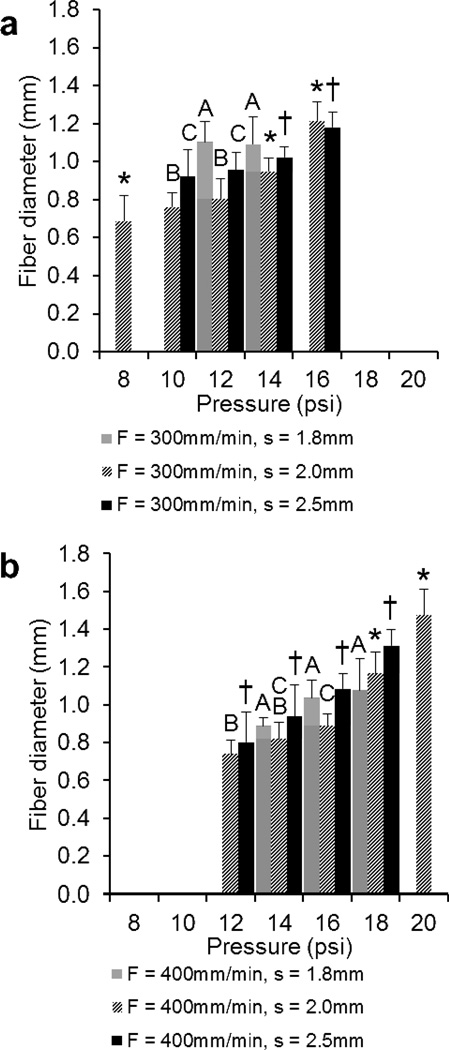
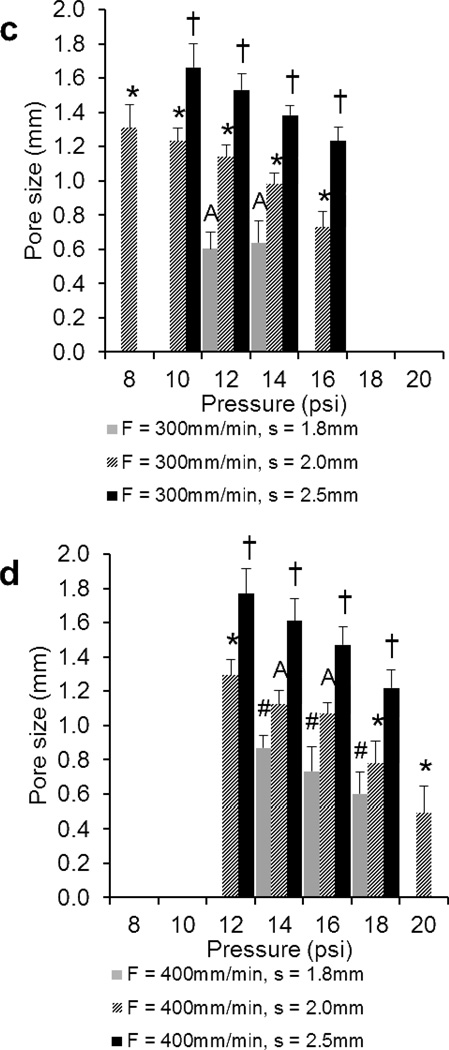
For scaffolds printed at speeds of 300 and 400mm/min (Figure 5a and 5b, respectively), results demonstrate a minimum fiber diameter of 0.69±0.13mm and 0.74±0.08mm and a maximum of 1.22±0.10mm and 1.47±0.14mm, respectively. Average fiber diameters for F = 300 and 400 were 0.97±0.17mm and 1.02±0.22mm, respectively, with some significant differences for F/s combinations (F/s: 300/2.0, 300/2.5, 400/2.0, 400/2.5). Significant differences were observed at all pressures for the F = 400mm/min, s = 2.5mm group. Additionally, a minimum pore size of 0.60±0.10mm and 0.49±0.15mm and a maximum of 1.66±0.14mm and 1.77±0.14mm were measured for scaffolds printed at speeds of 300 and 400mm/min, respectively. Average pore sizes for F = 300 and 400 (Figure 5c and 5d, respectively) were 1.13±0.34mm and 1.09±0.39mm, respectively. For F = 300, s = 2.0 and 2.5mm groups, and F = 400, s = 1.8 and 2.5mm groups, significant differences in pore size were observed at all pressures.
Figure 5.
Comparison of the a), b) fiber diameters and c), d) pore sizes of 3DP scaffolds printed at a), c) F = 300mm/min and b), d) 400mm/min measured using optical microscopy. The data represent means of four samples with the error bars representing the standard deviations. One-way ANOVA was used to determine significant differences within each F/s combination (p < 0.05). Significance in (#) s = 1.8 group, (*) s = 2.0 group, (†) s = 2.5 group. A–C Values marked with same letter do not differ. Note: It was not possible to print all F/s combinations at P = 8, 10, 12, 16, 18, 20psi (where bars are absent).
Fiber spacing measurements
While significant differences (p < 0.05) were observed for some of the F/s combinations (F/s: 300/1.8, 300/2.0, 300/2.5, 400/2.0), experimental fiber spacing stayed constant overall with varying pressure (Table 3). Figures 6a and b show the experimental values for F = 300 and 400mm/min, respectively, as compared to the programmed spacing, which is indicated by the dashed line for each respectives.
Table 3.
| Programmed fiber spacing (mm) |
Experimental fiber spacing, F = 300 (mm) |
Experimental fiber spacing, F = 400 (mm) |
Total experimental fiber spacing (mm) |
|---|---|---|---|
| 1.8 | 1.72 ± 0.02 | 1.72 ± 0.09 | 1.72 ± 0.07 |
| 2 | 1.95 ± 0.03 | 1.96 ± 0.04 | 1.96 ± 0.03 |
| 2.5 | 2.47 ± 0.07 | 2.56 ± 0.03 | 2.51 ± 0.07 |
Measurements represent the means and standard deviations of 5 X and 5 Y fiber spacings on the top of each scaffold (n = 4 per programmed fiber spacing group). Total experimental fiber spacing measurements represent the means and standard deviations for both printing speeds (F = 300 and 400).
Mechanical testing of uniform and gradient scaffolds
In this study, uniform and gradient scaffolds were fabricated and tested mechanically. Processing parameters, such as printing speed, pressure, and temperature were kept constant to evaluate the effect of fiber spacing on compressive modulus and yield strength. The effect of porosity on these mechanical properties was also evaluated based on previous analysis in our laboratory.23 In general, it was more feasible to print scaffolds with smaller pore sizes on the bottom (Pa) than on the top (Pb). It was possible to repeatably print scaffolds with layers comprising distinct pore sizes in this manner. For the 1.5/2.5mm (Pa) and (Pb) groups, only two of the three samples exhibited a point of intersection with the offset line and the stress strain curve (i.e., the point of compressive yield strength). Thus, Tukey’s HSD was modified to consider comparisons of unequal sample size in appropriate cases.
Porosity measurements
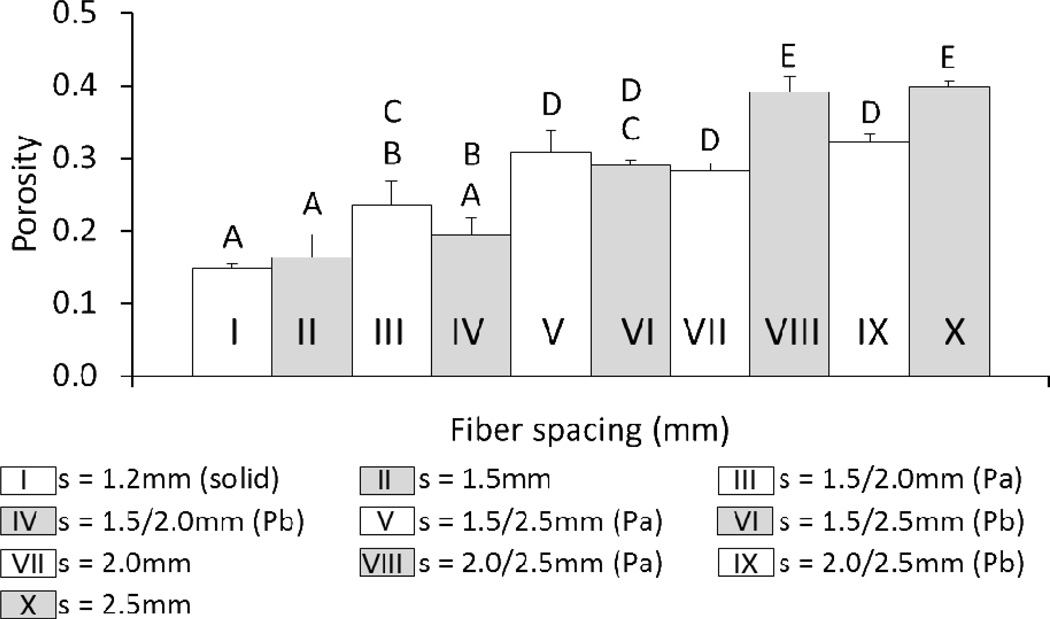
At a printing speed of 400mm/min and pressure of 16psi, it was possible to fabricate scaffolds with porosities ranging from 15±9% to 40±9%. As shown in Figure 7, porosity was not significantly different for (Pa)/(Pb) pairs (gradient scaffolds with the same pore morphology but tested with opposite pore sizes facing up) except for the s = 2.0/2.5mm group. Again, a general increase in porosity was observed with increasing fiber spacing.
Figure 7.
Comparison of the porosities of uniform and gradient 3DP scaffolds printed at F = 400mm/min, P = 16psi. (solid) indicates a fiber spacing that produces 0% theoretical porosity at the given F and p values. Groups with dashed lines are printed in the same manner as their solid counterpart. (Pa) Scaffold was tested with smaller pore size on bottom. (Pb) Scaffold was tested with smaller pore size on top. The data represent means of three samples with the error bars representing the standard deviations. One-way ANOVA was used to determine significant differences among groups (p < 0.05). A–E Values marked with the same letter do not differ.
Compressive mechanical properties
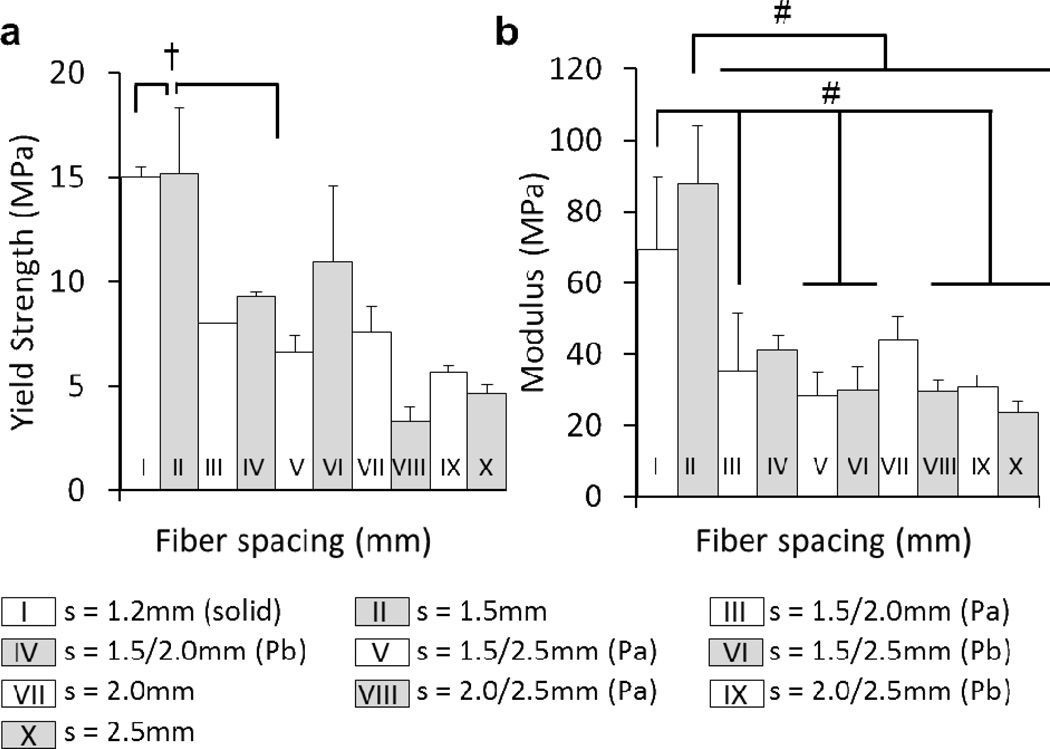
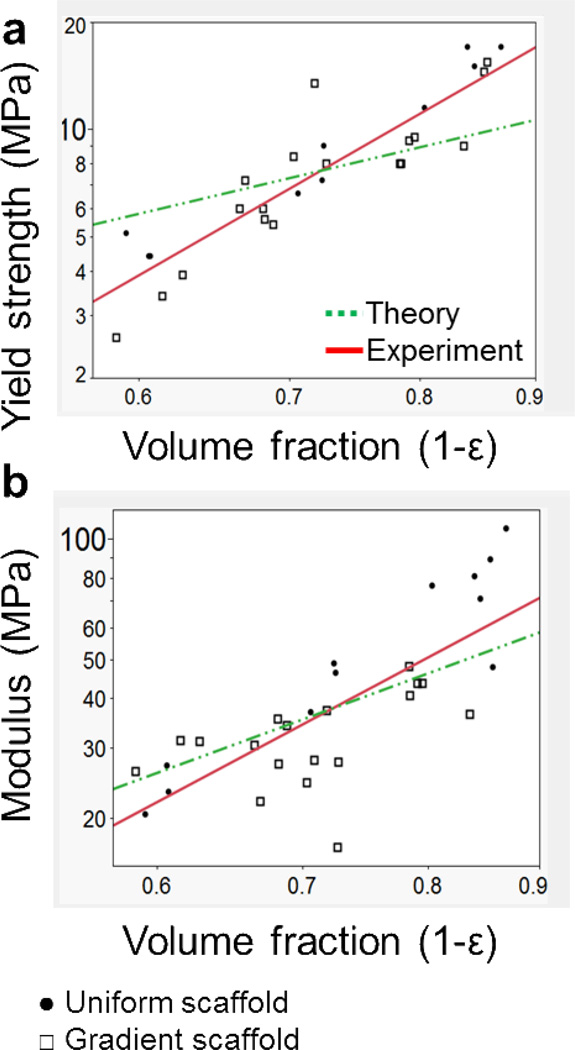
Figures 8a and b show the effect of fiber spacing (which accounts for pore size and fiber diameter) on mechanical properties. Some significant differences were present for both compressive yield strength and modulus with respect to the 1.2mm and 1.5mm groups, but no differences were present among the other groups. Furthermore, Figures 9a and b, respectively, illustrate trends for compressive yield strength (fc) and compressive modulus (E) versus volume fraction (1 − ε). Table 4 also summarizes the mechanical properties reported as mean ± standard deviation, as well as the experimental power law relationship as determined by linear regression.
Figure 8.
Compressive testing a) yield strength, b) modulus, of porous 3DP scaffolds (uniform and gradient) printed at F = 400mm/min, P = 16psi. (solid) indicates a fiber spacing that produces 0% theoretical porosity at the given F and p values. Groups with dashed lines are printed in the same manner as their solid counterpart. (Pa) Scaffold was tested with smaller pore size on bottom. (Pb) Scaffold was tested with smaller pore size on top. † and # indicate statistical significance (p < 0.05, n = 3) within compressive yield strength and modulus values, respectively.
Figure 9.
Mechanical properties of both uniform and gradient scaffolds. a) Scaffold compressive yield strength and b) compressive modulus as a function of volume fraction, where ε = porosity and both axes are on a logarithmic scale (base 10). Predicted values for dotted line (Theory) a) slope = 1.5 and b) = 2, follow a power law relationship of an isotropic cubic cell. Experimental values follow a best fit power law relationship as stated in Table 4.
Table 4.
Summary of Mechanical Results and Experimental Power Law Relationships for Uniform and Gradient PCL 3DP Scaffolds Using the Conditions Described in Table 2
| Property | Min (MPa) | Max (MPa) | Average ± SD (MPa) | Power Law Equation |
|---|---|---|---|---|
| Compressive Yield Strength | 3.3 | 15.2 | 8.6 ± 4.1 | fc= 25.0 (1−ε)3.64 |
| Compressive Modulus | 23.6 | 87.9 | 42.0 ± 20.7 | E= 97.0 (1−ε)2.91 |
Discussion
The results from this investigation demonstrate the ability to print scaffolds with varying architectures and optimize scaffold fabrication at desired settings. Specifically, porosity, pore size, and fiber diameter can be tuned with operating pressure, printing speed, and programmed fiber spacing. Furthermore, open-source printing can be employed to fabricate PCL scaffolds with uniform and gradient pore architectures. While a main effects analysis for pore and fiber morphology would have been a powerful tool to interpret the results, performing this analysis on the present data would eliminate a majority of the groups from consideration, limiting the usefulness and impact of the interpretation. Important information can be gleaned, however, by qualitatively comparing results between the two printing speeds and among groups printed at the same speed.
Macroscopically, individual fibers could be observed. Optical microscopy provided aid in visualizing individual layers (Figure 3) and identifying any areas of fiber fusion. Microscopic imaging also showed fibers that were slightly tapered. During the printing process, this tapering became more noticeable as scaffold height increased, while the first layers tended to have more uniformly cylindrical fibers. This tapering may have been circumvented by printing at a lower printing speed or using a syringe tip with a smaller cross-sectional area (gauge > 18G). While there were some irregularities with the fiber morphology, fiber diameter and pore size were measured in the center and a uniform morphology was assumed in order to standardize and simplify measurements.
Assuming that the molten PCL is viscous and non-compressible (Newtonian) and exhibits a laminar flow profile, its flow rate can be characterized by the following Hagen-Poiseuille equation,
| (Equation 3) |
where ΔP is the pressure differential, d is the nozzle inner diameter, L is the nozzle length, and η is the polymer viscosity.24 The observation that porosity decreased with increasing pressure (Figure 4) is in agreement with both the Hagen-Poiseuille equation, since flow rate and pressure are directly proportional, and the fact that printing temperature and scaffold dimensions remained constant throughout the study. When comparing porosity results for the same fiber spacing (s), scaffolds printed at F = 400mm/min generally exhibited a higher porosity than F = 300mm/min groups, an observation which could be strengthened by an analysis of main effects. The results in Figure 5 demonstrate that fiber diameter increased with increasing pressure, which agrees with the Hagen-Poiseuille equation as well, since flow rate is directly proportional to pressure and nozzle diameter, and nozzle diameter remained constant. A decrease in fiber diameter was generally observed at a higher printing speed when comparing F = 300 and 400mm/min groups at the same fiber spacing, which is consistent with previous results using the same printing system.19 However, this observation could be supported by additional testing at different printing speeds with the same fiber spacing combinations and pressure ranges, which was beyond the scope of this study. Figure 5 also demonstrates that pore size decreased with increasing pressure, which agrees with both decreasing porosity and increasing fiber diameter. To achieve pore sizes smaller than 400µm, slower printing speeds could be investigated, since slower speeds facilitate printing at lower operating pressures. As with porosity, an increase in pore size was generally observed for F = 400 groups as compared to F = 300 groups with the same fiber spacing. When comparing F = 300 and 400 groups, experimental fiber spacing corresponded to its theoretical value (programmed fiber spacing) despite varying printing speed (Figure 6). These results confirm the accuracy and repeatability of the printer at different speeds and pressures.
With respect to mechanical properties, scaffolds subjected to compressive loading exhibit a higher compressive modulus and yield strength when they contain a lower overall porosity (Figure 9). The compressive mechanical properties of the scaffolds may be predicted based on governing equations of porous materials. Juxtaposition of the two relationships on the same graph allows comparison between the theoretical prediction and experimental fit. Experimental results indicate a power law relationship consistent with theoretical predictions of an isotropic cubic cell.23,25 These equations relate the compressive modulus (E) or the yield strength (fc) to the volume fraction (1 − ε),
| (Equation 4) |
| (Equation 5) |
where slopes m and n are predicted as 2 and 1.5, respectively, and C1 and C2 are constants.23 The power law relationship demonstrates a decline in compressive properties with increased porosity (ε). These results indicate that while porosity (ε) had an effect on mechanical properties, pore size did not, which is consistent with previous mechanical results in our laboratory.23 As a primary method of analyzing the effect of pore size on mechanical properties, it was assumed that all pores were isotropic for both uniform and gradient scaffolds. While distinct pores of the gradient scaffolds were considered to be isotropic, a more rigorous model could be applied to predict compressive properties of these scaffolds by considering an anisotropic pore morphology.
Conclusion
The objective of this investigation was to characterize the effects of fabrication parameters on printed PCL scaffold architecture for tissue engineering. The novelty of this approach incorporates the use of an established open-source printing system that allows vast customizability and facilitates reproduction of experiments to manufacture PCL scaffolds with uniform and gradient pore architectures. An investigation has been performed on 3DP scaffolds regarding the effect of key processing parameters on scaffold fiber and pore morphology and mechanical properties. While the ability to provide an analysis of main effects was hindered due to fabrication limitations, a qualitative difference in porosity, fiber diameter, and pore size between groups with two different printing speeds and the same fiber spacing could be reported. Upon evaluating the compressive yield strength and modulus of uniform and gradient scaffolds, these results demonstrated the ability to print PCL as a mechanically robust support material with varied structure. Furthermore, the use of open-source 3DP technologies allows flexibility in the fabrication of scaffolds for tissue engineering, as the printing apparatus can be adapted based on the application at a low cost, and further modification can be provided and supported by the open-source community to produce optimal technologies for the laboratory and the clinic.
Supplementary Material
Acknowledgments
We acknowledge the variety of open-source projects that facilitated this research, including Arduino.cc, RepRap.org, Ultimachine.com, Python.org, Paint.NET, and Fiji.sc. Additionally, we would like to acknowledge that the Python code was modified from a previous version on Thingiverse, entitled “Parametric GCode Starter Kit.” We acknowledge support by the National Institutes of Health (R01 AR048756 and R01 AR057083) and the Armed Forces Institute of Regenerative Medicine (W81XWH-08-2-0032) for work in the areas of bone and cartilage tissue engineering. J.E.T. acknowledges funding from the National Science Foundation Graduate Research Fellowship Program and the Howard Hughes Medical Institute.
References
- 1.Ekenseair AK, Boere KW, Tzouanas SN, Vo TN, Kasper FK, Mikos AG. Structure-property evaluation of thermally and chemically gelling injectable hydrogels for tissue engineering. Biomacromolecules. 13(9):2821–2830. doi: 10.1021/bm300797m. [DOI] [PMC free article] [PubMed] [Google Scholar]
- 2.Fong EL, Watson BM, Kasper FK, Mikos AG. Building bridges: leveraging interdisciplinary collaborations in the development of biomaterials to meet clinical needs. Adv Mater. 24(36):4995–5013. doi: 10.1002/adma.201201762. [DOI] [PMC free article] [PubMed] [Google Scholar]
- 3.Kohane DS, Langer R. Polymeric biomaterials in tissue engineering. Pediatr. Res. 2008;63(5):487–491. doi: 10.1203/01.pdr.0000305937.26105.e7. [DOI] [PubMed] [Google Scholar]
- 4.Pham QP, Sharma U, Mikos AG. Electrospun poly(epsilon-caprolactone) microfiber and multilayer nanofiber/microfiber scaffolds: characterization of scaffolds and measurement of cellular infiltration. Biomacromolecules. 2006;7(10):2796–2805. doi: 10.1021/bm060680j. [DOI] [PubMed] [Google Scholar]
- 5.Nezarati RM, Eifert MB, Cosgriff-Hernandez E. Effects of Humidity and Solution Viscosity on Electrospun Fiber Morphology. Tissue Eng Part C Methods. doi: 10.1089/ten.tec.2012.0671. [DOI] [PMC free article] [PubMed] [Google Scholar]
- 6.Fedorovich NE, Moroni L, Malda J, Alblas J, Blitterswijk CA, Dhert WJA. Chapter 13: 3D-Fiber Deposition for Tissue Engineering and Organ Printing Applications. In: Ringeisen BR, Spargo BJ, Wu PK, editors. Cell and Organ Printing. Part 6. Netherlands: Springer; 2010. pp. 225–239. [Google Scholar]
- 7.Ursan ID, Chiu L, Pierce A. Three-dimensional drug printing: a structured review. J Am Pharm Assoc. 2003;53(2):136–144. doi: 10.1331/JAPhA.2013.12217. [DOI] [PubMed] [Google Scholar]
- 8.Levorson EJ, Raman Sreerekha P, Chennazhi KP, Kasper FK, Nair SV, Mikos AG. Fabrication and characterization of multiscale electrospun scaffolds for cartilage regeneration. Biomed Mater. 8(1):014103. doi: 10.1088/1748-6041/8/1/014103. [DOI] [PMC free article] [PubMed] [Google Scholar]
- 9.Solchaga LA, Temenoff JS, Gao J, Mikos AG, Caplan AI, Goldberg VM. Repair of osteochondral defects with hyaluronan- and polyester-based scaffolds. Osteoarthritis Cartilage. 2005;13(4):297–309. doi: 10.1016/j.joca.2004.12.016. [DOI] [PubMed] [Google Scholar]
- 10.Sobral JM, Caridade SG, Sousa RA, Mano JF, Reis RL. Three-dimensional plotted scaffolds with controlled pore size gradients: Effect of scaffold geometry on mechanical performance and cell seeding efficiency. Acta Biomater. 2011;7(3):1009–1018. doi: 10.1016/j.actbio.2010.11.003. [DOI] [PubMed] [Google Scholar]
- 11.Trachtenberg J, Mountziaris P, Kasper F, Mikos A. Fiber-based composite tissue engineering scaffolds for drug delivery. Isr. J. Chem. 2013 Submitted. [Google Scholar]
- 12.Trachtenberg JE, Kasper FK, Mikos AG. Polymer Scaffold Fabrication. In: Lanza R, editor. Principles of Tissue Engineering. 2013. In Press. [Google Scholar]
- 13.Schuurman W, Khristov V, Pot MW, van Weeren PR, Dhert WJA, Malda J. Bioprinting of hybrid tissue constructs with tailorable mechanical properties. Biofabrication. 2011;3:2. doi: 10.1088/1758-5082/3/2/021001. [DOI] [PubMed] [Google Scholar]
- 14.Sun Y, Finne-Wistrand A, Albertsson AC, Xing Z, Mustafa K, Hendrikson WJ, Grijpma DW, Moroni L. Degradable amorphous scaffolds with enhanced mechanical properties and homogeneous cell distribution produced by a three-dimensional fiber deposition method. J Biomed Mater Res A. 100(10):2739–2749. doi: 10.1002/jbm.a.34210. [DOI] [PubMed] [Google Scholar]
- 15.Nandakumar A, Barradas A, de Boer J, Moroni L, van Blitterswijk C, Habibovic P. Combining technologies to create bioactive hybrid scaffolds for bone tissue engineering. Biomatter. 3(2) doi: 10.4161/biom.23705. [DOI] [PMC free article] [PubMed] [Google Scholar]
- 16.Rattanakit P, Moulton SE, Santiago KS, Liawruangrath S, Wallace GG. Extrusion printed polymer structures: a facile and versatile approach to tailored drug delivery platforms. Int. J. Pharm. 422(1–2):254–263. doi: 10.1016/j.ijpharm.2011.11.007. [DOI] [PubMed] [Google Scholar]
- 17.Hutmacher DW, Schantz T, Zein I, Ng KW, Teoh SH, Tan KC. Mechanical properties and cell cultural response of polycaprolactone scaffolds designed and fabricated via fused deposition modeling. J. Biomed. Mater. Res. 2001;55(2):203–216. doi: 10.1002/1097-4636(200105)55:2<203::aid-jbm1007>3.0.co;2-7. [DOI] [PubMed] [Google Scholar]
- 18.Zein I, Hutmacher DW, Tan KC, Teoh SH. Fused deposition modeling of novel scaffold architectures for tissue engineering applications. Biomaterials. 2002;23(4):1169–1185. doi: 10.1016/s0142-9612(01)00232-0. [DOI] [PubMed] [Google Scholar]
- 19.Miller JS, Stevens KR, Yang MT, Baker BM, Nguyen D-HT, Cohen DM, Toro E, Chen Aa, Galie Pa, Yu X, et al. Rapid casting of patterned vascular networks for perfusable engineered three-dimensional tissues. Nature materials. 2012;11(7):1–7. doi: 10.1038/nmat3357. [DOI] [PMC free article] [PubMed] [Google Scholar]
- 20.Eshraghi S, Das S. Mechanical and microstructural properties of polycaprolactone scaffolds with one-dimensional, two-dimensional, and three-dimensional orthogonally oriented porous architectures produced by selective laser sintering. Acta Biomater. 6(7):2467–2476. doi: 10.1016/j.actbio.2010.02.002. [DOI] [PMC free article] [PubMed] [Google Scholar]
- 21.Henslee AM, Gwak DH, Mikos AG, Kasper FK. Development of a biodegradable bone cement for craniofacial applications. J Biomed Mater Res A. 100(9):2252–2259. doi: 10.1002/jbm.a.34157. [DOI] [PMC free article] [PubMed] [Google Scholar]
- 22.Williams JM, Adewunmi A, Schek RM, Flanagan CL, Krebsbach PH, Feinberg SE, Hollister SJ, Das S. Bone tissue engineering using polycaprolactone scaffolds fabricated via selective laser sintering. Biomaterials. 2005;26(23):4817–4827. doi: 10.1016/j.biomaterials.2004.11.057. [DOI] [PubMed] [Google Scholar]
- 23.Thomson RC, Yaszemski MJ, Powers JM, Mikos AG. Fabrication of biodegradable polymer scaffolds to engineer trabecular bone. J. Biomater. Sci. Polym. Ed. 1995;7(1):23–38. doi: 10.1163/156856295x00805. [DOI] [PubMed] [Google Scholar]
- 24.Woodfield TBF, Malda J, de Wijn J, Péters F, Riesle J, van Blitterswijk CA. Design of porous scaffolds for cartilage tissue engineering using a three-dimensional fiber-deposition technique. Biomaterials. 2004;25(18):4149–4161. doi: 10.1016/j.biomaterials.2003.10.056. [DOI] [PubMed] [Google Scholar]
- 25.Gibson LJ, Ashby MF. Cellular solids : structure and properties. Cambridge, NY: Cambridge University Press; 1999. [Google Scholar]
Associated Data
This section collects any data citations, data availability statements, or supplementary materials included in this article.


