

Abstract
Nanoparticles used for biological and biomedical applications encounter a host of extracellular proteins. These proteins rapidly adsorb onto the nanoparticle surface, creating a protein corona. Poly(ethylene glycol) can reduce, but not eliminate, the nonspecific adsorption of proteins. As a result, the adsorbed proteins, rather than the nanoparticle itself, determine the cellular receptors used for binding, the internalization mechanism, the intracellular transport pathway, and the subsequent immune response. Using fluorescence microscopy and flow cytometry, we first characterize a set of polystyrene nanoparticles in which the same adsorbed protein, bovine serum albumin, leads to binding to two different cell surface receptors: native albumin receptors and scavenger receptors. Using a combination of circular dichroism spectroscopy, isothermal titration calorimetry, and fluorescence spectroscopy, we demonstrate that the secondary structure of the adsorbed bovine serum albumin protein controls the cellular receptors used by the protein–nanoparticle complexes. These results show that protein secondary structure is a key parameter in determining the cell surface receptor used by a protein–nanoparticle complex. We expect this link between protein structure and cellular outcomes will provide a molecular basis for the design of nanoparticles for use in biological and biomedical applications.
Nanoparticles (NPs) are important tools for biology and medicine.1−7 Current applications include gold NPs for photothermal cancer therapy,8−10 quantum dots for cellular imaging and sensing,5−7 and spherical nucleic acid NPs for gene regulation.11−13 In the course of these applications, NPs are exposed to a complex mixture of extracellular proteins.14−16 These proteins adsorb onto the surface of NPs forming a protein layer or “corona” on the NP surface.17−24 Poly(ethylene glycol) (PEG) can reduce, but not eliminate, the formation of a corona.25−27 The interaction between adsorbed extracellular proteins, NPs, and cells is a complex problem, as the adsorbed proteins control the interaction of NPs with cells,17,28−31 but the NP itself changes the structure of the protein.31−36 We describe a comprehensive study that relates the structure of proteins adsorbed on the NP surface to the cellular receptors used by the protein–NP complex, providing a molecular foundation for the design of NPs for applications in biology and medicine.
The protein corona controls the cellular interaction of the NP by determining the cell surface receptor to which the protein–NP complex binds.17,30,37−39 The cell surface receptor then directs the internalization and intracellular transport of the NP,28,29,40−42 as well as the immune response.41−44 The interaction between blood serum proteins, NPs, and cell surface receptors is especially important for NP targeting, as the protein corona can mask the targeting capabilities of the NP. For example, Dawson et al. observed that transferrin-coated NPs are recognized by the transferrin receptor in an isolated in vitro system.45 However, in the presence of serum proteins, targeting capabilities are lost as the transferrin on the NPs is masked by the adsorption of serum proteins.
Previous work has characterized the composition of the protein corona as a function of NP material, surface modification, and time.18,21−24,36−38,46,47 Following exposure to blood serum proteins, the protein corona is dominated by albumin,17−19,37,38,46,48,49 the most abundant protein in serum (55%).14−16 Less-abundant proteins such as apolipoproteins, fibrinogen, and immunoglobulins can also participate.21,27,46,48,50 The composition of the protein corona changes over time as distinct serum proteins bind to NP surfaces with a range of association strengths and rate constants.19,49,50
In addition to corona composition, the other, equally important, aspect to consider is the structure of the proteins adsorbed on the NP. Adsorption of proteins on surfaces,51−53 including NPs,31−36,43,54,55 will alter the structure of the protein, often leading to a partial denaturation. For example, lysozyme and chymotrypsin lose secondary structure and activity upon adsorption to 10 nm gold NPs and cytochrome c is disrupted upon binding to sulfonated polystyrene NPs and magnetic NPs.56−58 However, not all proteins are disrupted by adsorption onto NPs. A comparison of chymotrypsin and cytochrome c adsorbed onto 7 nm gold NPs showed that while the structure of chymotrypsin was disrupted, cytochrome c retained its secondary structure.59 In the case of albumin, previous work has shown the disruption of secondary structure following adsorption to silver NPs,36,60 zinc oxide NPs,61 gold NPs,62,63 and gold nanorods.63
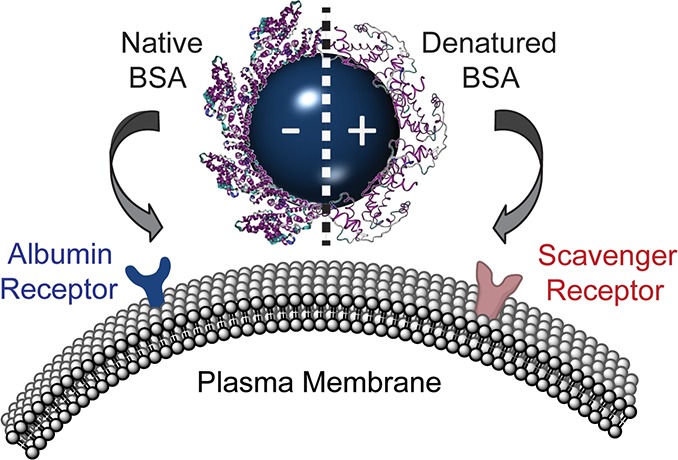
To unravel the relationship between the structure of the corona proteins and the cell surface receptors used by the protein–NP complex, we characterized a model system of anionic, carboxylate-modified and cationic, amine-modified polystyrene NPs with similar diameters. Bovine serum albumin (BSA) adsorbs onto the surface of both anionic and cationic NPs, resulting in nearly identical net anionic BSA–NP complexes. Although the same protein forms the corona, the BSA–NP complexes bind to different cellular receptors. BSA–NP complexes formed with anionic NPs bind to native protein receptors, while BSA–NP complexes formed with cationic NPs bind to scavenger receptors. Given that the same protein results in two different cellular outcomes, this provides an ideal system to probe the relationship between protein structure and cell surface receptors. Using circular dichroism (CD) spectroscopy, we determined that the native structure of BSA is retained after binding to anionic NPs, while BSA structure is disrupted following incubation with cationic NPs. Isothermal titration calorimetry (ITC) was used to determine equilibrium association constants, enthalpy of adsorption, and binding stoichiometry. Fluorescence quenching experiments support the trends observed with ITC. As all NPs in a physiological environment are likely to acquire some extent of protein corona, it is important to understand how the protein corona will control the interaction of the NP with the cell.64−66 Our studies illustrate the relationship between serum protein secondary structure, NPs, and cell surface receptors, providing a foundation for rational targeting of diagnostic and therapeutic NPs.
Results
Experiments were carried out using polystyrene NPs with either an anionic, carboxylate-modified or cationic, amine-modified surface (Table 1). We used fluorescent NPs for fluorescence microscopy and flow cytometry experiments. Dark, nonfluorescent NPs were used for experiments in which the NP fluorescence would interfere with the measurement. We use the diameter supplied by the manufacturer, which can differ from the hydrodynamic diameter depending on characterization method, to denote the NP throughout the text. Adsorption of proteins onto both anionic and cationic NPs has been observed previously by our group and others.17,20−24,28,29,37,38 Gel electrophoresis and dynamic light scattering experiments confirm that BSA–NP complexes are formed from both anionic and cationic NPs (Figures S1, S2, and S3 of the Supporting Information). Importantly, BSA–NP complexes formed with anionic and cationic NPs have identical corona compositions and surface charges (−18.5 mV and −19.0 mV, respectively, Figure S2 of the Supporting Information).
Table 1. Hydrodynamic Diameter (dh) and Zeta Potential (ZP) of the NPs Used in the Course of Experiments.
| NPs | dh (nm) | ZP (mV) | |
|---|---|---|---|
| fluorescent | 93 nm COOH | 102.5 ± 1.6 | –30.1 ± 5.4 |
| 87 nm NH2 | 152.7 ± 3.2 | 39.2 ± 3.6 | |
| 200 nm COOH | 236.2 ± 3.3 | –31.0 ± 1.6 | |
| 200 nm NH2 | 270.1 ± 9.3 | 19.9 ± 3.4 | |
| dark | 60 nm COOH | 64.1 ± 1.4 | –39.8 ± 3.9 |
| 58 nm NH2 | 63.4 ± 1.2 | 40.3 ± 4.0 |
Fluorescence Microscopy Shows that BSA–NP Complexes Formed from Anionic and Cationic NPs Bind to Distinct Cellular Receptors
Cells are commonly cultured in a buffered solution, such as minimum essential medium (MEM), containing inorganic salts, amino acids, and vitamins. The medium is supplemented with serum proteins, typically fetal bovine serum (FBS). Since our goal was to observe molecular-level effects, we used isolated BSA for the majority of experiments. Fluorescent NPs were incubated with monkey kidney epithelial (BS-C-1) cells in MEM or in MEM supplemented with 10 mg mL–1 BSA. This concentration of BSA is approximately equal to the total protein concentration used in typical cell culture (Materials and Methods). Cellular binding studies were carried out at 4 °C, which allows NP binding to the cell surface but blocks cellular internalization of the NPs.67−70 For the anionic, carboxylate-modified NPs, we observed NP binding in MEM (Figure 1A). The addition of BSA significantly inhibited NP binding. Interestingly, we observe the opposite trend for the cationic, amine-modified NPs. Minimal cellular binding was observed in MEM, while BSA enhances cationic NP binding (Figure 1B). Similar results were observed for Chinese hamster ovary (CHO) cells, indicating that this trend is independent of cell type (Figure S4 of the Supporting Information).
Figure 1.
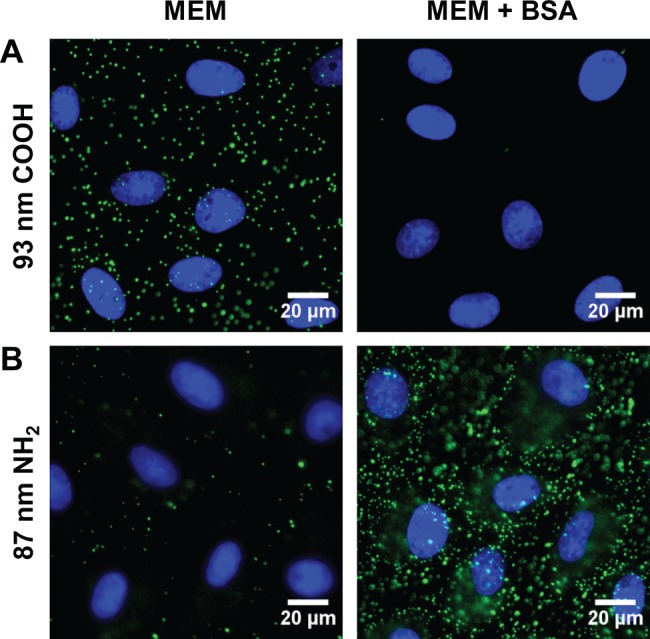
Fluorescence microscopy images show cellular binding of NPs (green) in MEM and MEM supplemented with 10 mg mL–1 BSA (MEM + BSA) to monkey kidney epithelial cells (BS-C-1) at 4 °C. (A) 93 nm carboxylate-modified NPs. (B) 87 nm amine-modified NPs. Nuclei are stained with DAPI (blue).
Cellular Binding Competition Studies Identify the Cellular Receptors used by BSA–NPs
Cellular binding of the anionic, carboxylate-modified NPs was inhibited by BSA (Figure 1A), suggesting that BSA–NP complexes formed from anionic NPs compete with BSA for binding to the native albumin receptor. To test this hypothesis, we carried out cellular binding competition studies with increasing concentrations of BSA. Using flow cytometry as a high-throughput, quantitative measure of cellular binding, we observe decreased BSA–NP binding in the presence of increasing concentrations of BSA (Figure 2A). At a BSA concentration of 10 mg mL–1, similar to the concentration used in cell culture, BSA–NP binding was reduced to 32% relative to 100% in the absence of BSA. This supports the hypothesis that BSA–NPs formed from anionic NPs bind to native albumin receptors on the cell surface.
Figure 2.

Identification of cell surface receptors using cellular binding competition assays measured with flow cytometry. (A) Cellular binding of 93 nm anionic, carboxylate-modified NPs in MEM with increasing concentrations of BSA. (B) Cellular binding of 87 nm cationic, amine-modified NPs in MEM supplemented with 10 mg mL–1 BSA with increasing concentrations of fucoidan. (C) Cellular binding of 87 nm cationic, amine-modified NPs in MEM supplemented with 10 mg mL–1 BSA with increasing concentrations of polyinosinic acid. (D) Control experiments show cellular binding of 87 nm amine-modified NPs in the presence of polyadenylic acid (PolyA) and the autofluorescence from cells in the absence of NPs (cells only, error bar is too small to see).
Previous studies have shown that some NPs and protein–NP complexes bind to scavenger receptors,11,37,40 specifically scavenger receptors with an affinity for modified albumins.71−73 To determine if the BSA–NPs formed from cationic NPs bind to scavenger receptors, we carried out competition studies in the presence of both fucoidan (Figure 2B) and polyinosinic acid (Figure 2C), known competitors for scavenger receptors.72 Increasing concentrations of fucoidan and polyinosinic acid both led to decreased cellular binding of the BSA–NP complexes, although fucoidan was a stronger competitor (11% binding at 2500 μg mL–1 compared to 25%). As a control, we measured cellular binding of BSA–NPs formed from cationic NPs in the presence of polyadenylic acid (Figure 2D). Polyadenylic acid has a similar structure to polyinosinic acid but is not a competitor for scavenger receptors.74 We did not observe competition in the presence of polyadenylic acid (88% binding compared to a control normalized to 100%).
Protein Secondary Structure in the Presence of Anionic and Cationic NPs
The same protein binding to different cell surface receptors, especially scavenger receptors, suggests a structural difference in BSA following adsorption on the anionic and cationic NPs. We used circular dichroism (CD) spectroscopy to probe the structure of BSA following incubation with dark, nonfluorescent, polystyrene NPs. For isolated BSA, a primarily α-helix protein, the far-UV CD spectrum contains a positive band at 195 nm and two negative bands at 208 and 222 nm (Figure 3A), in good agreement with previous CD measurements.75,76 Incubation with 60 nm anionic, carboxylate-modified NPs shows little change in the CD spectrum (Figure 3A). In comparison, incubation with 58 nm cationic, amine-modified NPs results in more positive mean residue ellipticity (MRE) values, indicating a loss in protein secondary structure (Figure 3A). CD difference spectra were calculated by subtracting the spectrum of BSA alone from the spectrum of BSA in the presence of NPs (Figure 3B). The difference spectra reveal a larger change in BSA secondary structure in the presence of cationic, compared to anionic, NPs. We observe similar results for BSA in the presence of 200 nm NPs (Figure S5 of the Supporting Information). Percent α-helicity was calculated using the CD peak at 208 nm (Table 2, Materials and Methods). The α-helicity of BSA alone was 65%, consistent with previous reports.77,78 For BSA in the presence of the 58 and 200 nm cationic, amine-modified NPs, a loss in α-helicity was observed (48% and 37%, respectively). For BSA in the presence of 60 nm anionic, carboxylate-modified NPs, a slight increase in α-helicity to 71% was observed. For the 200 nm carboxylate-modified NPs, there was little change (63%).
Figure 3.
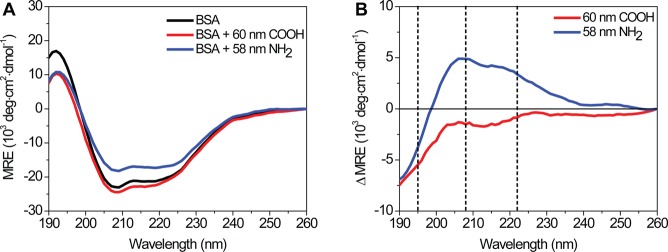
CD spectra of BSA in the presence of 60 nm carboxylate-modified NPs (red), 58 nm amine-modified NPs (blue), and in the absence of NPs (black). Spectra, in units of mean residue ellipticity (MRE), are the average of 10 consecutive scans. (A) Raw CD spectra. (B) CD difference spectra were calculated by subtracting the spectrum of BSA from BSA in the presence of 60 nm carboxylate-modified (red) or 58 nm amine-modified NPs (blue). Black dashed lines correspond to spectral peaks at 195, 208, and 222 nm. Similar results were obtained for 200 nm NPs (Figure S5 of the Supporting Information).
Table 2. Percent α-Helicity as a Function of NP Size and Charge.
| sample | % α-helix |
|---|---|
| BSA | 65 |
| BSA + 60 nm COOH | 71 |
| BSA + 58 nm NH2 | 48 |
| BSA + 200 nm COOH | 63 |
| BSA + 200 nm NH2 | 37 |
Thermodynamic Parameters of BSA Adsorption on NPs using Isothermal Titration Calorimetry (ITC)
The equilibrium association constant, enthalpy, and binding stoichiometry of BSA adsorbed on NPs was determined using ITC (Figure 4 and Figures S6 and S7 of the Supporting Information).
Figure 4.

Isothermal titration calorimetry (ITC) plots of differential power throughout the titration (top) and integrated heat as a function of the mole ratio of BSA adsorbed on NPs (bottom). The heat of dilution of BSA into buffer (Figure S6 of the Supporting Information) was subtracted for each injection from the heat of BSA titrated into a NP solution. (A) BSA titrated into a solution of 60 nm carboxylate-modified NPs. (B) BSA titrated into a solution of 58 nm amine-modified NPs. Raw data plotted in the TA Instruments software, NanoAnalyze, is shown in Figure S7 of the Supporting Information.
An independent site model was used to fit the integrated titration curves and extract thermodynamic parameters (Table 3, Materials and Methods). The association constant was nearly an order of magnitude higher for BSA adsorbed on anionic NPs with Ka values of 2.4 ± 0.9 × 10⁵ M–1 and 4.0 ± 0.5 × 10⁴ M–1 for 60 nm anionic, carboxylate-modified and 58 nm cationic, amine-modified NPs, respectively. The enthalpy of BSA binding to the 60 nm carboxylate-modified (−1.4 ± 0.4 × 10⁴ kJ mol–1) and 58 nm amine-modified NPs (−1.4 ± 0.7 × 10⁴ kJ mol–1) was almost identical. A significantly greater number of BSA molecules adsorbed onto the surface of the 60 nm carboxylate-modified NPs (871 ± 21 proteins per NP) compared to the 58 nm amine-modified NPs (27 ± 8 proteins per NP), although this is likely an underestimate for the 58 nm NPs due to dimerization of these NPs under these conditions (Figure S8 of the Supporting Information). The percent coverage, relative to a monolayer of 100%, was calculated assuming BSA binds end-on, maximizing the number of BSA molecules in a monolayer.22,79 The coverage of BSA on the 60 nm carboxylate-modified NPs was 230 ± 6%, compared with 8 ± 2% on the 58 nm amine-modified NPs.
Table 3. Thermodynamic Parameters of BSA Adsorption to NPs.
| NP | Ka (105 M–1) | ΔH (104 kJ mol–1) | proteins/NP | % coverage |
|---|---|---|---|---|
| 60 nm COOH | 2.4 ± 0.9 | –1.4 ± 0.4 | 871 ± 21 | 230 ± 6% |
| 58 nm NH2 | 0.40 ± 0.05 | –1.4 ± 0.7 | 27 ± 8 | 8 ± 2% |
Fluorescence Spectroscopy of BSA in the Presence of Anionic and Cationic NPs
Fluorescence spectroscopy was used as a complementary technique to measure equilibrium association constants by monitoring the quenching of tryptophan at ∼340 nm (Figure 5A).80−82 The ratio of fluorescence intensities in the absence and presence of NPs were plotted versus NP concentration in a Stern–Volmer plot (Figure 5B). As the plots were nonlinear at higher NP concentrations, the first four points were used for a linear fit to extract an effective KSV, equivalent to an effective Ka (Materials and Methods). For BSA in the presence of 60 nm carboxylate-modified NPs, the effective Ka is 1.8 ± 0.1 × 10⁹ M–1, compared to the 58 nm amine-modified NPs with an effective Ka of 7.7 ± 0.1 × 10⁸ M–1.
Figure 5.
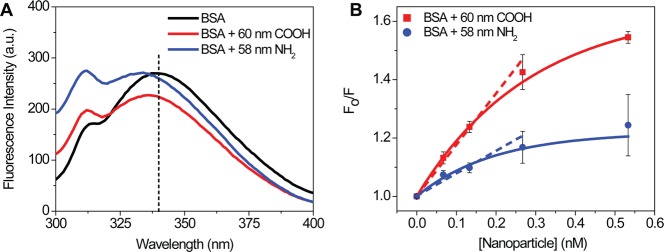
(A) Raw fluorescence spectra of BSA in the presence of 60 nm carboxylate-modified NPs (red), 58 nm amine-modified NPs (blue), and in the absence of NPs (black). The black dashed line at 340 nm corresponds to the emission from tryptophan residues in BSA. (B) Stern–Volmer plot of BSA quenching in the presence of increasing concentrations of NPs. The contribution from NPs alone and buffer were subtracted, and initial emission at 250 nm was set to zero. The solid lines correspond to an exponential fit of the raw data. Dashed lines are the initial slope used to calculate an effective equilibrium constant (eq 3).
Discussion
NPs used in any biological application are exposed to a complex mixture of extracellular proteins that form a protein corona on the NP surface.14−24 Although PEG can reduce corona formation, complete inhibition remains a challenge.25−27 We have characterized the changes in protein secondary structure that result from adsorption of BSA on NP surfaces and then relate these structural changes to the cell surface receptor used by the protein–NP complex.
Although BSA–NP complexes formed with anionic and cationic NPs have identical corona compositions and surface charges (Figures S1 and S2 of the Supporting Information), the cellular binding trends are drastically different. Cellular binding of BSA–NP complexes formed with anionic NPs is inhibited by the presence of excess BSA (Figure 1A). In comparison, the cellular binding of complexes formed with cationic NPs is strongly enhanced by BSA (Figure 1B). This difference in binding is independent of cell type, as similar results were obtained for CHO cells (Figure S4 of the Supporting Information). The differences in cellular binding suggest that the BSA–NP complexes formed with anionic and cationic NPs bind to different receptors. In a series of cellular binding competition studies, we observe that BSA–NP complexes formed from anionic NPs bind to native albumin receptors (Figure 2A). Albumin has a dedicated receptor on the cell surface as it is an essential blood serum protein.83,84 In comparison, BSA–NP complexes formed with initially cationic NPs bind to scavenger receptors (Figure 2, panels B and C). Scavenger receptors are a broad class of receptors that bind modified proteins, polysaccharides, and polyribonucleotides,71−73,85,86 as well as NPs and protein–NP complexes.11,40,71−73 Schnitzer et al. determined that chemically or structurally modified albumins, including albumin–gold NP complexes, bind preferentially to the glycoprotein scavenger receptors gp30 and gp18 rather than the general class of modified protein receptors.71−73 Mirkin et al. have observed that oligonucleotide-conjugated gold NPs bind to scavenger receptors.11,40 Previous results using a complete mixture of FBS showed identical binding trends,37 demonstrating that this result is not specific to isolated BSA.
Interestingly, for the BSA–NP complexes formed from cationic NPs, we observed that fucoidan is a much stronger competitor than polyinosinic acid (Figure 2, panels B and C). At the highest competitor concentration (2500 μg mL–1), BSA–NP binding was 11% in the presence of fucoidan compared to 25% in the presence of polyinosinic acid. It is important to note that this concentration of polyinosinic acid is relatively high compared to previously reported concentrations for cellular binding competition,37,40 further confirming that polyinosinic acid is a less efficient competitor. Polyinosinic acid is a competitor for both gp30 and gp18,71−73 as well as the general class of modified protein receptors.87 In comparison, fucoidan is only a competitor for the gp30 and gp18 receptors.71−73 We propose that BSA–NP complexes formed from the cationic NPs only bind to the receptors for modified albumins, gp30 and gp18, and not the general receptors for modified proteins. This highlights the subtle differences in molecular-level interactions of NPs with cells.
The opposite binding trends observed for BSA–NP complexes formed from anionic and cationic NPs provided an ideal model system to study the effect of protein structure on the cellular receptors used by BSA–NP complexes. We hypothesized that BSA adsorbed on anionic NPs retained its native structure, allowing the BSA–NP complexes to be recognized by the native albumin receptor. BSA adsorbed on cationic NPs was disrupted, likely partially denatured, such that it is no longer recognizable by the native protein receptor and is instead redirected to a scavenger receptor. CD spectra of BSA in the presence of 60 nm anionic NPs show that the secondary structure of BSA is retained (Figure 3). In comparison, there is a loss in α-helicity for BSA in the presence of 58 nm cationic NPs (65% to 48%, Table 2). Similar results were obtained for BSA in the presence of 200 nm NPs (Figure S5 of the Supporting Information, Table 2). The greater loss in α-helicity in the presence of the 200 nm NPs is attributed to greater BSA adsorption on the larger NP. Although the decrease in α-helicity appears modest, it should be noted that boiled BSA has a similar percent α-helicity as BSA incubated with carboxylate-modified NPs (71% α-helix, data not shown). This indicates both a significant change in α-helicity for BSA following exposure to cationic NPs, as well as a difference in secondary structure for BSA disrupted by heat denaturation compared to NP exposure. Changes in protein secondary structure can be accompanied by the exposure of new peptide sequences. While epitope exposure and structural changes are difficult to separate, changes in secondary structure are the driving force for both and ultimately determine the cellular receptors used by the protein.
A change in protein secondary structure should be associated with changes in adsorption of the protein on the NP surface. Using ITC (Figure 4), we observe that fewer proteins adsorbed on the cationic, amine-modified NPs (27 ± 8 proteins per NP, compared to 871 ± 21 proteins per NP for anionic NPs). Similar results were obtained for sulfate-modified polystyrene NPs, which showed less than monolayer adsorption of BSA and disruption of the BSA secondary structure.78 The lower binding stoichiometry is likely due to the loss of the BSA secondary structure. When spread out on the NP surface, fewer BSA molecules can access the surface without an energy cost. This hypothesis is reinforced by the thermodynamic data. The enthalpy of BSA binding to anionic and cationic NPs is identical (−1.4 ± 0.4 × 10⁴ kJ mol–1 and −1.4 ± 0.7 × 10⁴ kJ mol–1, respectively), which is surprising given that the maximum BSA adsorption to the surface of the 60 nm carboxylate-modified NPs is approximately 30-fold greater than on the 58 nm amine-modified NPs. However, the association of BSA is much stronger on the anionic NP surface (2.4 ± 0.9 × 10⁵ M–1 compared with 4.0 ± 0.5 × 10⁴ M–1), which we attribute to more energetically favorable packing of native BSA as well as some degree of binding cooperativity. Previous ITC experiments have examined protein adsorption on NPs as a function of protein species and hydrophobicity.24,88−90 Most similar to our measurements are experiments carried out by Landfester et al. examining BSA adsorption onto ∼200 nm polystyrene NPs.24 Equilibrium association constants and enthalpies are similar to our results, taking into consideration the variability in ITC measurements. However, 27% coverage was observed for carboxylate-modified NPs and 63% coverage for amine-modified NPs,24 compared to 230% and 8%, respectively, in our experiments (Table 3). This difference could be due to multiple factors, including differences in NP diameter, pH, buffer, and surface modification ligand. Previous fluorescence correlation spectroscopy measurements showed that the number of human serum albumin proteins adsorbed onto the surface of 10–15 nm cationic and anionic gold NPs were similar.91 While the difference between the values we obtained with ITC and the fluorescence correlation spectroscopy measurements could be due to NP diameter or surface modification, it should also be noted that fluorescence correlation spectroscopy is insensitive to protein conformation and can only be used to measure the hydrodynamic diameter of NPs with and without a protein corona. These results highlight the difficulty of comparing results obtained with different experimental methods as well as ITC experiments under even slightly different conditions.
As a complementary method to ITC, fluorescence quenching was used to measure equilibrium association constants (Figure 5). The nonlinear Stern–Volmer plot (Figure 5B) is indicative of a selective quenching mechanism.82,92 At low NP concentrations, readily accessible tryptophan residues on BSA are quenched uniformly. At higher NP concentrations, the NP has limited access to BSA residues that can be quenched. Lower accessibility of the NP leads to selective quenching. The stronger association of BSA on 60 nm anionic compared to 58 nm cationic NPs was observed in both the ITC and fluorescence spectroscopy data, although the absolute values differ by several orders of magnitude (e.g., Ka = 2.4 ± 0.9 × 10⁵ M–1 with ITC versus 1.8 ± 0.1 × 10⁹ M–1 from fluorescence spectroscopy for 60 nm anionic NPs). Thermodynamic parameters are highly sensitive to experimental conditions and, for our experiments, the buffers required to optimize ITC and fluorescence spectroscopy experiments were not identical. While ITC provides a better quantitative measure of the association constant as it is a direct, label-free measurement,93 the use of multiple methods to confirm thermodynamic parameters is essential.26 Fluorescence quenching has been used previously to study the adsorption of BSA on gold,26,62 silver,94 and silver–titanium dioxide NPs.95 Equilibrium binding constants of 1010 to 1011 were reported for gold, 105 for silver–titanium dioxide, and from 1010 to 1016 M–1 for silver NPs, depending on temperature. The high variability in equilibrium binding constants in the literature could be due to the fluorescence spectroscopy method itself, in addition to the fact that binding strength is highly sensitive to NP material, size, and surface modification.
Conclusions
Our experiments provide a molecular link between the structure of the proteins that comprise the corona and the specific cellular receptors used by the protein–NP complex. We show that changes in protein structure upon adsorption to NPs determine the specific cell surface receptor used by the protein–NP complex. In the case of BSA, protein secondary structure is retained upon adsorption to anionic NPs, allowing the BSA–NP complex to bind to native albumin receptors. The denaturation of BSA following adsorption to cationic NPs directs the BSA–NP complexes to bind to scavenger receptors. These results have important implications for the in vivo targeted delivery of NPs. Beyond merely confirming the presence of a protein corona, it is critical to characterize the structure of the corona proteins.
Materials and Methods
Nanoparticles (NPs)
Polystyrene NPs were used in all experiments (Table 1). The diameter provided by the supplier is used to identify the NP: 93 nm carboxylate-modified (Bang’s Laboratories, FC02F), 87 nm amine-modified (Invitrogen, C29029), 200 nm carboxylate-modified (Invitrogen, F8811), 200 nm amine-modified (Invitrogen, F8764), 60 nm carboxylate-modified (Bang’s Laboratories, PC02N), and 58 nm amine-modified (Bang’s Laboratories, PA02N).
Dynamic Light Scattering and Zeta Potential Measurements
The hydrodynamic diameter and zeta potential of the NPs was measured with a Malvern Zetasizer (Malvern Instruments, Nano-ZS, Table 1). NPs were measured at the following concentrations: 93 nm carboxylate-modified (37 pM), 87 nm amine-modified (173 pM), 200 nm carboxylate-modified (13 pM), 200 nm amine-modified (15 pM), 60 nm carboxylate-modified (1.4 nM), and 58 nm amine-modified (1.4 nM). NP concentrations were optimized based on the stock NP solution. The 60 nm carboxylate-modified NPs and 58 nm amine-modified NPs were also measured in colorless MEM (Invitrogen, 51200038) and MEM supplemented with either 10 mg mL–1 bovine serum albumin (BSA, Fisher, BP1600) or 10% (v/v) fetal bovine serum (FBS, Invitrogen, 10437028). From the UV–Vis spectrum of FBS, using the extinction coefficient of BSA (43,824 M–1 cm–1), the total protein concentration in 10% (v/v) FBS is approximately 10 mg mL–1. Solutions prepared with MEM were diluted by 10% (v/v) for zeta potential measurements to reduce the conductivity. For the 58 nm amine-modified NPs, solutions in MEM supplemented with 10% (v/v) FBS were filtered with a 0.2 μm syringe filter to remove aggregates formed in the presence of protein. Triplicate measurements were acquired for each sample. All experiments were carried out with three samples, and the mean and standard deviation are reported. Hydrodynamic diameter measurements were acquired from 12 runs per measurement. Zeta potential measurements were acquired from 30 runs per measurement. The Smoluchowski approximation was used to calculate zeta potential from electrophoretic mobility.
Gel Electrophoresis
60 nm carboxylate-modified (14 nM) and 58 nm amine-modified (0.4 nM) NPs were incubated in MEM supplemented with 10 mg mL–1 BSA or 10% (v/v) FBS at 4 °C for 10 min and washed four times via centrifugation (16000g, 4 °C, 10 min). NP concentrations were optimized based on the solubility and stability of the NPs in solution. Previous studies have demonstrated that four wash steps with centrifugation followed by resuspension in water removes all observable unbound protein from solution.37 Pellets of protein–NP complexes were resuspended in water after each washing step. After the final wash, the protein–NP complex was resuspended in either buffer containing 6% (w/v) SDS (New England Biolabs, #B7703S) or water. Samples were diluted with a 4X Laemmli buffer (Boston Bioproducts, BP-110R) and boiled for 5 min before loading onto the gel. Mini-protean gradient gels (Bio-Rad, 456–1094, 4–20%) were used to separate proteins at 40 mA and 100 V along with a 5–225 kDa molecular weight marker (Lonza, 50547). Proteins were stained for 1 h with Simply Blue Safe Stain (Invitrogen, LC6060) and imaged using a Li-Cor Odyssey imaging system.
Cell Culture
African green monkey kidney epithelial cells (BS-C-1, ATCC) and Chinese hamster ovary cells (CHO, ATCC) were maintained in a 37 °C, 5% carbon dioxide environment and passaged every 3 days. BS-C-1 cells were cultured in minimum essential medium (MEM, Invitrogen, 61100061) and CHO cells in Ham’s F-12 (F-12, Invitrogen, 21700075). Both were supplemented with 10% (v/v) FBS. For all cell experiments, cells were grown in 35 mm glass-bottom dishes (MatTek). For fluorescence imaging experiments, nuclei were stained with 27 μM 4′,6-diamidino-2-phenylindole dilactate (DAPI, Invitrogen, D35671) at 37 °C for 30 min.
Fluorescence Microscopy
Cellular binding of NPs was imaged with an epifluorescence microscope (Olympus IX71) using a 1.20 N.A., 60× water immersion objective (Olympus). Fluorescence emission was collected with an EMCCD (Andor, DU-897). Images for comparison were recorded with the same exposure time and gain. Brightness and contrast were set to equal values. ImageJ (http://rsb.info.nih.gov/ij/) was used for image analysis and processing.
Competition Assays
Binding competition studies have been described previously.37 Briefly, BSA was used as a competitor for the serum albumin receptor. Fucoidan (Sigma-Aldrich, F5631) and polyinosinic acid (Sigma-Aldrich, P4154) were used as competitors for scavenger receptors. Polyadenylic acid (Sigma-Aldrich, P9403) was used as a control. The competitor or control molecule was incubated with cells at 4 °C for 20 min in MEM for 93 nm carboxylate-modified NPs or in MEM supplemented with 10 mg mL–1 BSA for 87 nm amine-modified NPs. The NPs were then incubated with cells in the presence of the competitor molecule for 10 min. Cells were rinsed twice with phosphate-buffered saline with calcium and magnesium (PBS, Invitrogen, 14040182) to remove unbound NPs, twice with PBS without calcium and magnesium (Invitrogen, 14190250), and incubated in 10 mM ethylenediaminetetraacetic acid (Mallinckrodt, 49310-04) at 37 °C for 30 min to remove the adherent cells from the MatTek dishes. Cells were rinsed twice with Leibovitz’s L-15 buffer (Invitrogen, 21083027) via centrifugation at 10000g for 10 min, filtered with a 40 μm cell strainer (BD Falcon, 352340), and kept on ice for 1 h prior to analysis with flow cytometry (BD Biosciences, LSR-II). A 488 nm laser was used to excite the NP fluorescence, and fluorescence emission was collected on a 530/30 nm bandpass filter. The mean and standard deviation are reported for each concentration. Scatter plots and fluorescence histograms were analyzed with Weasel 3.0.1 (Walter and Eliza Hall Institute of Medical Research, Victoria, Australia).
Circular Dichroism (CD) Spectroscopy
CD spectra were acquired on an Olis CD spectrophotometer with the sample chamber maintained at 20 °C. Measurements were made using a 0.5 mm path length quartz cell (Starna, 20/O-Q-0.5). The bandwidth was set to 2 nm, and the integration time was a function of the photomultiplier tube voltage. Samples were measured in 10% (v/v) PBS without calcium and magnesium. Buffer alone without protein was used as a blank. BSA (0.098 mg mL–1) was measured alone and in the presence of 60 nm carboxylate-modified NPs (0.4 nM), 58 nm amine-modified NPs (0.4 nM), 200 nm carboxylate-modified NPs (13 pM), and 200 nm amine-modified NPs (13 pM). The NP concentration was optimized to reduce scatter and absorbance from the NPs. Samples were incubated for 10 min prior to acquisition. Spectra are an average of 10 consecutive scans. All measurements were repeated in triplicate. Spectra were smoothed with a Savitzy–Golay least-squares fitting (digital filter =13), and the value at 260 nm was set to zero to account for spectral drift. Spectra were acquired in millidegrees and converted to mean residue ellipticity using eq 1.
| 1 |
The mean residue ellipticity in units of degrees cm2 dmol–1 ([θ]) is a function of the observed signal in millidegrees, [θ]obs, the average molecular weight of the protein (MW), path length in cm (l), protein concentration in g L–1 (C), and the total number of amino acids (n). Percent α-helicity was calculated from eq 2.96,97
| 2 |
The percent α-helix of a protein is a function of the mean residue ellipticity at 208 nm ([θ]MRE), minus the contribution from the β-form and random coil conformations at 208 nm (4000). The observed value is compared to the mean residue ellipticity of a pure α-helix protein (33000).
Isothermal Titration Calorimetry (ITC)
ITC measurements were made on a Nano ITC (TA Instruments, low volume) at 25 °C with a constant stirring speed of 250 rpm. For all titrations, 16 3 μL injections were made with a 300 s equilibration time before and after each injection. All solutions were prepared in a 20 mM HEPES buffer (pH 7.4). Titration of BSA (75 μM) alone into HEPES buffer was subtracted injection-by-injection from BSA titrations into NP solutions. The 60 nm carboxylate-modified NPs (5.0 pM) or 58 nm amine-modified NPs (1.4 nM) were loaded into the sample cell. The baseline between peaks was selected manually. Integration of differential power plots as a function of time gave binding curves, and the raw data was fit with the one independent site model using NanoAnalyze (TA Instruments).98 The first injection was excluded from the fit. Each titration curve was repeated 3–4 times. The mean and standard deviation are reported for all thermodynamic parameters. The theoretical monolayer coverage of BSA molecules per NP was calculated using the assumption that BSA binds end-on to the NP surface with a footprint of 3.3 × 10¹² BSA molecules per cm2.22
Fluorescence Spectroscopy
Fluorescence spectra were acquired on a spectrofluorophotometer (Shimadzu, RF-5301). All solutions were prepared in 10% (v/v) PBS without calcium and magnesium. Samples were excited at 280 nm, and emission was collected between 250 and 500 nm using 5 nm slit widths for both excitation and emission. BSA (9.8 μg mL–1) was measured in the presence of nonfluorescent 60 nm carboxylate-modified and 58 nm amine-modified NPs. Working NP concentration ranged from 67 to 533 pM. Experiments were repeated in triplicate, and the mean and standard deviation are plotted for each data point. Corrected spectra are the raw spectra with the NP scatter peak and buffer contribution subtracted out and the initial emission value at 250 nm set to zero. The Stern–Volmer equation was used to calculate the equilibrium constant (eq 3).
| 3 |
The fluorescence intensity ratio of BSA at λmax in the absence (Fo) and presence (F) of a quencher is calculated and plotted versus the NP quencher concentration ([NP]). The slope of the line is equal to the Stern–Volmer equilibrium constant (KSV, M–1). For static quenching, KSV is equal to the equilibrium association constant.92 The first four points were fit linearly to calculate an effective equilibrium constant.
Acknowledgments
This research was supported by a NIH Director’s New Innovator Award (1DP2OD006470) to C.K.P. and a U.S. DoEd Molecular Biophysics and Biotechnology GAANN fellowship (P200A120190) to C.C.F.
Supporting Information Available
Characterization of protein corona formation, cellular binding studies in CHO cells, CD data for 200 nm NPs, and raw ITC data. This material is available free of charge via the Internet at http://pubs.acs.org.
The authors declare no competing financial interest.
Funding Statement
National Institutes of Health, United States
Supplementary Material
References
- De M.; Ghosh P. S.; Rotello V. M. Applications of Nanoparticles in Biology. Adv. Mater. 2008, 20, 4225–4241. [Google Scholar]
- Giljohann D. A.; Seferos D. S.; Daniel W. L.; Massich M. D.; Patel P. C.; Mirkin C. A. Gold Nanoparticles for Biology and Medicine. Angew. Chem., Int. Ed. 2010, 49, 3280–3294. [DOI] [PMC free article] [PubMed] [Google Scholar]
- Dreaden E. C.; Alkilany A. M.; Huang X.; Murphy C. J.; El-Sayed M. A. The Golden Age: Gold Nanoparticles for Biomedicine. Chem. Soc. Rev. 2012, 41, 2740–2779. [DOI] [PMC free article] [PubMed] [Google Scholar]
- Pelaz B.; Jaber S.; de Aberasturi D. J.; Wulf V.; Aida T.; de la Fuente J. M.; Feldmann J.; Gaub H. E.; Josephson L.; Kagan C. R.; et al. The State of Nanoparticle-Based Nanoscience and Biotechnology: Progress, Promises, and Challenges. ACS Nano 2012, 6, 8468–8483. [DOI] [PubMed] [Google Scholar]
- Alivisatos A. P.; Gu W.; Larabell C. Quantum Dots as Cellular Probes. Annu. Rev. Biomed. Eng. 2005, 7, 55–76. [DOI] [PubMed] [Google Scholar]
- Medintz I. L.; Uyeda H. T.; Goldman E. R.; Mattoussi H. Quantum Dot Bioconjugates for Imaging, Labelling and Sensing. Nat. Mater. 2005, 4, 435–446. [DOI] [PubMed] [Google Scholar]
- Michalet X.; Pinaud F. F.; Bentolila L. A.; Tsay J. M.; Doose S.; Li J. J.; Sundaresan G.; Wu A. M.; Gambhir S. S.; Weiss S. Quantum Dots for Live Cells, in Vivo Imaging, and Diagnostics. Science 2005, 307, 538–544. [DOI] [PMC free article] [PubMed] [Google Scholar]
- Dreaden E. C.; Mackey M. A.; Huang X.; Kang B.; El-Sayed M. A. Beating Cancer in Multiple Ways Using Nanogold. Chem. Soc. Rev. 2011, 40, 3391–3404. [DOI] [PMC free article] [PubMed] [Google Scholar]
- Jain P. K.; El-Sayed I. H.; El-Sayed M. A. Au Nanoparticles Target Cancer. Nano Today 2007, 2, 18–29. [Google Scholar]
- Hirsch L. R.; Stafford R. J.; Bankson J. A.; Sershen S. R.; Rivera B.; Price R. E.; Hazle J. D.; Halas N. J.; West J. L. Nanoshell-Mediated Near-Infrared Thermal Therapy of Tumors under Magnetic Resonance Guidance. Proc. Natl. Acad. Sci. U.S.A. 2003, 100, 13549–13554. [DOI] [PMC free article] [PubMed] [Google Scholar]
- Choi C. H. J.; Hao L.; Narayan S. P.; Auyeung E.; Mirkin C. A. Mechanism for the Endocytosis of Spherical Nucleic Acid Nanoparticle Conjugates. Proc. Natl. Acad. Sci. U.S.A. 2013, 110, 7625–7630. [DOI] [PMC free article] [PubMed] [Google Scholar]
- Cutler J. I.; Auyeung E.; Mirkin C. A. Spherical Nucleic Acids. J. Am. Chem. Soc. 2012, 134, 1376–1391. [DOI] [PubMed] [Google Scholar]
- Jensen S. A.; Day E. S.; Ko C. H.; Hurley L. A.; Luciano J. P.; Kouri F. M.; Merkel T. J.; Luthi A. J.; Patel P. C.; Cutler J. I.; et al. Spherical Nucleic Acid Nanoparticle Conjugates as an RNAi-Based Therapy for Glioblastoma. Sci. Transl. Med. 2013, 5, 209ra152. [DOI] [PMC free article] [PubMed] [Google Scholar]
- Adkins J. N.; Varnum S. M.; Auberry K. J.; Moore R. J.; Angell N. H.; Smith R. D.; Springer D. L.; Pounds J. G. Toward a Human Blood Serum Proteome: Analysis by Multidimensional Separation Coupled with Mass Spectrometry. Mol. Cell. Proteomics 2002, 1, 947–955. [DOI] [PubMed] [Google Scholar]
- Pieper R.; Gatlin C. L.; Makusky A. J.; Russo P. S.; Schatz C. R.; Miller S. S.; Su Q.; McGrath A. M.; Estock M. A.; Parmar P. P.; et al. The Human Serum Proteome: Display of Nearly 3700 Chromatographically Separated Protein Spots on Two-Dimensional Electrophoresis Gels and Identification of 325 Distinct Proteins. Proteomics 2003, 3, 1345–1364. [DOI] [PubMed] [Google Scholar]
- Anderson N. L.; Anderson N. G. The Human Plasma Proteome: History, Character, and Diagnostic Prospects. Mol. Cell. Proteomics 2002, 1, 845–867. [DOI] [PubMed] [Google Scholar]
- Doorley G. W.; Payne C. K. Cellular Binding of Nanoparticles in the Presence of Serum Proteins. Chem. Commun. 2011, 47, 466–468. [DOI] [PubMed] [Google Scholar]
- Walczyk D.; Bombelli F. B.; Monopoli M. P.; Lynch I.; Dawson K. A. What the Cell “Sees” in Bionanoscience. J. Am. Chem. Soc. 2010, 132, 5761–5768. [DOI] [PubMed] [Google Scholar]
- Cedervall T.; Lynch I.; Lindman S.; Berggård T.; Thulin E.; Nilsson H.; Dawson K. A.; Linse S. Understanding the Nanoparticle–Protein Corona Using Methods to Quantify Exchange Rates and Affinities of Proteins for Nanoparticles. Proc. Natl. Acad. Sci. U.S.A. 2007, 104, 2050–2055. [DOI] [PMC free article] [PubMed] [Google Scholar]
- Treuel L.; Nienhaus G. Toward a Molecular Understanding of Nanoparticle–Protein Interactions. Biophys. Rev. 2012, 4, 137–147. [DOI] [PMC free article] [PubMed] [Google Scholar]
- Gessner A.; Lieske A.; Paulke B.-R.; Müller R. H. Functional Groups on Polystyrene Model Nanoparticles: Influence on Protein Adsorption. J. Biomed. Mater. Res., Part A 2003, 65A, 319–326. [DOI] [PubMed] [Google Scholar]
- Brewer S. H.; Glomm W. R.; Johnson M. C.; Knag M. K.; Franzen S. Probing BSA Binding to Citrate-Coated Gold Nanoparticles and Surfaces. Langmuir 2005, 21, 9303–9307. [DOI] [PubMed] [Google Scholar]
- Alkilany A. M.; Nagaria P. K.; Hexel C. R.; Shaw T. J.; Murphy C. J.; Wyatt M. D. Cellular Uptake and Cytotoxicity of Gold Nanorods: Molecular Origin of Cytotoxicity and Surface Effects. Small 2009, 5, 701–708. [DOI] [PubMed] [Google Scholar]
- Baier G.; Costa C.; Zeller A.; Baumann D.; Sayer C.; Araujo P. H. H.; Mailaender V.; Musyanovych A.; Landfester K. BSA Adsorption on Differently Charged Polystyrene Nanoparticles Using Isothermal Titration Calorimetry and the Influence on Cellular Uptake. Macromol. Biosci. 2011, 11, 628–638. [DOI] [PubMed] [Google Scholar]
- Walkey C. D.; Chan W. C. W. Understanding and Controlling the Interaction of Nanomaterials with Proteins in a Physiological Environment. Chem. Soc. Rev. 2012, 41, 2780–2799. [DOI] [PubMed] [Google Scholar]
- Boulos S. P.; Davis T. A.; Yang J. A.; Lohse S. E.; Alkilany A. M.; Holland L. A.; Murphy C. J. Nanoparticle–Protein Interactions: A Thermodynamic and Kinetic Study of the Adsorption of Bovine Serum Albumin to Gold Nanoparticle Surfaces. Langmuir 2013, 29, 14984–14996. [DOI] [PubMed] [Google Scholar]
- Gref R.; Lück M.; Quellec P.; Marchand M.; Dellacherie E.; Harnisch S.; Blunk T.; Müller R. H. ‘Stealth’ Corona-Core Nanoparticles Surface Modified by Polyethylene Glycol (PEG): Influences of the Corona (PEG Chain Length and Surface Density) and of the Core Composition on Phagocytic Uptake and Plasma Protein Adsorption. Colloids Surf., B 2000, 18, 301–313. [DOI] [PubMed] [Google Scholar]
- Doorley G. W.; Payne C. K. Nanoparticles Act as Protein Carriers During Cellular Internalization. Chem. Commun. 2012, 48, 2961–2963. [DOI] [PubMed] [Google Scholar]
- Lunov O.; Syrovets T.; Loos C.; Beil J.; Delecher M.; Tron K.; Nienhaus G. U.; Musyanovych A.; Mailaender V.; Landfester K.; et al. Differential Uptake of Functionalized Polystyrene Nanoparticles by Human Macrophages and a Monocytic Cell Line. ACS Nano 2011, 5, 1657–1669. [DOI] [PubMed] [Google Scholar]
- Monopoli M. P.; Aberg C.; Salvati A.; Dawson K. A. Biomolecular Coronas Provide the Biological Identity of Nanosized Materials. Nat. Nanotechnol. 2012, 7, 779–786. [DOI] [PubMed] [Google Scholar]
- Nel A. E.; Madler L.; Velegol D.; Xia T.; Hoek E. M. V.; Somasundaran P.; Klaessig F.; Castranova V.; Thompson M. Understanding Biophysicochemical Interactions at the Nano-Bio Interface. Nat. Mater. 2009, 8, 543–557. [DOI] [PubMed] [Google Scholar]
- Lacerda S. H. D.; Park J. J.; Meuse C.; Pristinski D.; Becker M. L.; Karim A.; Douglas J. F. Interaction of Gold Nanoparticles with Common Human Blood Proteins. ACS Nano 2010, 4, 365–379. [DOI] [PubMed] [Google Scholar]
- You C.-C.; Verma A.; Rotello V. M. Engineering the Nanoparticle-Biomacromolecule Interface. Soft Matter 2006, 2, 190–204. [DOI] [PubMed] [Google Scholar]
- Aubin-Tam M. E.; Hamad-Schifferli K. Structure and Function of Nanoparticle-Protein Conjugates. Biomed. Mater. 2008, 3, 034001. [DOI] [PubMed] [Google Scholar]
- Shemetov A. A.; Nabiev I.; Sukhanova A. Molecular Interaction of Proteins and Peptides with Nanoparticles. ACS Nano 2012, 6, 4585–4602. [DOI] [PubMed] [Google Scholar]
- Treuel L.; Malissek M.; Grass S.; Diendorf J.; Mahl D.; Meyer-Zaika W.; Epple M. Quantifying the Influence of Polymer Coatings on the Serum Albumin Corona Formation around Silver and Gold Nanoparticles. J. Nanopart. Res. 2012, 14, 1–12.22448125 [Google Scholar]
- Fleischer C. C.; Payne C. K. Nanoparticle Surface Charge Mediates the Cellular Receptors Used by Protein–Nanoparticle Complexes. J. Phys. Chem. B 2012, 116, 8901–8907. [DOI] [PMC free article] [PubMed] [Google Scholar]
- Fleischer C. C.; Kumar U.; Payne C. K. Cellular Binding of Anionic Nanoparticles Is Inhibited by Serum Proteins Independent of Nanoparticle Composition. Biomater. Sci. 2013, 1, 975–982. [DOI] [PMC free article] [PubMed] [Google Scholar]
- Mao Z.; Zhou X.; Gao C. Influence of Structure and Properties of Colloidal Biomaterials on Cellular Uptake and Cell Functions. Biomater. Sci. 2013, 1, 896–911. [DOI] [PubMed] [Google Scholar]
- Patel P. C.; Giljohann D. A.; Daniel W. L.; Zheng D.; Prigodich A. E.; Mirkin C. A. Scavenger Receptors Mediate Cellular Uptake of Polyvalent Oligonucleotide-Functionalized Gold Nanoparticles. Bioconjugate Chem. 2010, 21, 2250–2256. [DOI] [PMC free article] [PubMed] [Google Scholar]
- Yan Y.; Gause K. T.; Kamphuis M. M. J.; Ang C.-S.; O’Brien-Simpson N. M.; Lenzo J. C.; Reynolds E. C.; Nice E. C.; Caruso F. Differential Roles of the Protein Corona in the Cellular Uptake of Nanoporous Polymer Particles by Monocyte and Macrophage Cell Lines. ACS Nano 2013, 7, 10960–10970. [DOI] [PubMed] [Google Scholar]
- Tenzer S.; Docter D.; Kuharev J.; Musyanovych A.; Fetz V.; Hecht R.; Schlenk F.; Fischer D.; Kiouptsi K.; Reinhardt C.; et al. Rapid Formation of Plasma Protein Corona Critically Affects Nanoparticle Pathophysiology. Nat. Nanotechnol. 2013, 8, 772–781. [DOI] [PubMed] [Google Scholar]
- Deng Z. J.; Liang M.; Monteiro M.; Toth I.; Minchin R. F. Nanoparticle-Induced Unfolding of Fibrinogen Promotes Mac-1 Receptor Activation and Inflammation. Nat. Nanotechnol. 2011, 6, 39–44. [DOI] [PubMed] [Google Scholar]
- Liu X.; Huang N.; Li H.; Jin Q.; Ji J. Surface and Size Effects on Cell Interaction of Gold Nanoparticles with Both Phagocytic and Nonphagocytic Cells. Langmuir 2013, 29, 9138–9148. [DOI] [PubMed] [Google Scholar]
- Salvati A.; Pitek A. S.; Monopoli M. P.; Prapainop K.; Bombelli F. B.; Hristov D. R.; Kelly P. M.; Aberg C.; Mahon E.; Dawson K. A. Transferrin-Functionalized Nanoparticles Lose Their Targeting Capabilities When a Biomolecule Corona Adsorbs on the Surface. Nat. Nanotechnol. 2013, 8, 137–143. [DOI] [PubMed] [Google Scholar]
- Cedervall T.; Lynch I.; Foy M.; Berggard T.; Donnelly S. C.; Cagney G.; Linse S.; Dawson K. A. Detailed Identification of Plasma Proteins Adsorbed on Copolymer Nanoparticles. Angew. Chem., Int. Ed. 2007, 46, 5754–5756. [DOI] [PubMed] [Google Scholar]
- Dominguez-Medina S.; McDonough S.; Swanglap P.; Landes C. F.; Link S. In Situ Measurement of Bovine Serum Albumin Interaction with Gold Nanospheres. Langmuir 2012, 28, 9131–9139. [DOI] [PMC free article] [PubMed] [Google Scholar]
- Monopoli M. P.; Walczyk D.; Campbell A.; Elia G.; Lynch I.; Bombelli F. B.; Dawson K. A. Physical-Chemical Aspects of Protein Corona: Relevance to in Vitro and in Vivo Biological Impacts of Nanoparticles. J. Am. Chem. Soc. 2011, 133, 2525–2534. [DOI] [PubMed] [Google Scholar]
- Casals E.; Pfaller T.; Duschl A.; Oostingh G. J.; Puntes V. Time Evolution of the Nanoparticle Protein Corona. ACS Nano 2010, 4, 3623–3632. [DOI] [PubMed] [Google Scholar]
- Barrán-Berdón A. L.; Pozzi D.; Caracciolo G.; Capriotti A. L.; Caruso G.; Cavaliere C.; Riccioli A.; Palchetti S.; Laganà A. Time Evolution of Nanoparticle–Protein Corona in Human Plasma: Relevance for Targeted Drug Delivery. Langmuir 2013, 29, 6485–6494. [DOI] [PubMed] [Google Scholar]
- Hlady V.; Buijs J. Protein Adsorption on Solid Surfaces. Curr. Opin. Biotechnol. 1996, 7, 72–77. [DOI] [PMC free article] [PubMed] [Google Scholar]
- Gray J. J. The Interaction of Proteins with Solid Surfaces. Curr. Opin. Struct. Biol. 2004, 14, 110–115. [DOI] [PubMed] [Google Scholar]
- Rabe M.; Verdes D.; Seeger S. Understanding Protein Adsorption Phenomena at Solid Surfaces. Adv. Colloid Interface Sci. 2011, 162, 87–106. [DOI] [PubMed] [Google Scholar]
- Roach P.; Farrar D.; Perry C. C. Interpretation of Protein Adsorption: Surface-Induced Conformational Changes. J. Am. Chem. Soc. 2005, 127, 8168–8173. [DOI] [PubMed] [Google Scholar]
- Pan H.; Qin M.; Meng W.; Cao Y.; Wang W. How Do Proteins Unfold Upon Adsorption on Nanoparticle Surfaces?. Langmuir 2012, 28, 12779–12787. [DOI] [PubMed] [Google Scholar]
- Aubin-Tam M. E.; Zhou H.; Hamad-Schifferli K. Structure of Cytochrome C at the Interface with Magnetic CoFe2O4 Nanoparticles. Soft Matter 2008, 4, 554–559. [DOI] [PubMed] [Google Scholar]
- Gagner J. E.; Lopez M. D.; Dordick J. S.; Siegel R. W. Effect of Gold Nanoparticle Morphology on Adsorbed Protein Structure and Function. Biomaterials 2011, 32, 7241–7252. [DOI] [PubMed] [Google Scholar]
- Gong J.; Yao P.; Duan H.; Jiang M.; Gu S.; Chunyu L. Structural Transformation of Cytochrome C and Apo Cytochrome C Induced by Sulfonated Polystyrene. Biomacromolecules 2003, 4, 1293–1300. [DOI] [PubMed] [Google Scholar]
- Srivastava S.; Verma A.; Frankamp B. L.; Rotello V. M. Controlled Assembly of Protein–Nanoparticle Composites through Protein Surface Recognition. Adv. Mater. 2005, 17, 617–621. [Google Scholar]
- Podila R.; Chen R.; Ke P. C.; Brown J. M.; Rao A. M. Effects of Surface Functional Groups on the Formation of Nanoparticle-Protein Corona. Appl. Phys. Lett. 2012, 101, 263701. [DOI] [PMC free article] [PubMed] [Google Scholar]
- Chakraborti S.; Joshi P.; Chakravarty D.; Shanker V.; Ansari Z. A.; Singh S. P.; Chakrabarti P. Interaction of Polyethyleneimine-Functionalized ZnO Nanoparticles with Bovine Serum Albumin. Langmuir 2012, 28, 11142–11152. [DOI] [PubMed] [Google Scholar]
- Wangoo N.; Suri C. R.; Shekhawat G. Interaction of Gold Nanoparticles with Protein: A Spectroscopic Study to Monitor Protein Conformational Changes. Appl. Phys. Lett. 2008, 92, 133104. [Google Scholar]
- Chakraborty S.; Joshi P.; Shanker V.; Ansari Z. A.; Singh S. P.; Chakrabarti P. Contrasting Effect of Gold Nanoparticles and Nanorods with Different Surface Modifications on the Structure and Activity of Bovine Serum Albumin. Langmuir 2011, 27, 7722–7731. [DOI] [PubMed] [Google Scholar]
- Verma A.; Stellacci F. Effect of Surface Properties on Nanoparticle-Cell Interactions. Small 2010, 6, 12–21. [DOI] [PubMed] [Google Scholar]
- Gagner J. E.; Shrivastava S.; Qian X.; Dordick J. S.; Siegel R. W. Engineering Nanomaterials for Biomedical Applications Requires Understanding the Nano-Bio Interface: A Perspective. J. Phys. Chem. Lett. 2012, 3, 3149–3158. [DOI] [PubMed] [Google Scholar]
- Pelaz B.; Charron G.; Pfeiffer C.; Zhao Y.; de la Fuente J. M.; Liang X.-J.; Parak W. J.; del Pino P. Interfacing Engineered Nanoparticles with Biological Systems: Anticipating Adverse Nano–Bio Interactions. Small 2013, 9, 1573–1584. [DOI] [PubMed] [Google Scholar]
- Pastan I.; Willingham M. Journey to the Center of the Cell: Role of the Receptosome. Science 1981, 214, 504–509. [DOI] [PubMed] [Google Scholar]
- Szymanski C. J.; Yi H.; Liu J. T.; Wright E. R.; Payne C. K.. Imaging Intracellular Quantum Dots: Fluorescence Microscopy and Transmission Electron Microscopy. In Nanobiotechnology Protocols; Rosenthal S. J., Wright D. X., Eds.; Humana Press: New York, 2012. [Google Scholar]
- Callaini G.; Dallai R.; Riparbelli M. G. Microfilament Distribution in Cold-Treated Drosophila Embryos. Exp. Cell Res. 1991, 194, 316–321. [DOI] [PubMed] [Google Scholar]
- Harding C.; Heuser J.; Stahl P. Receptor-Mediated Endocytosis of Transferrin and Recycling of the Transferrin Receptor in Rat Reticulocytes. J. Cell Biol. 1983, 97, 329–339. [DOI] [PMC free article] [PubMed] [Google Scholar]
- Schnitzer J. E.; Sung A.; Horvat R.; Bravo J. Preferential Interaction of Albumin-Binding Proteins, gp30 and gp18, with Conformationally Modified Albumins. Presence in Many Cells and Tissues with a Possible Role in Catabolism. J. Biol. Chem. 1992, 267, 24544–24553. [PubMed] [Google Scholar]
- Schnitzer J. E.; Bravo J. High Affinity Binding, Endocytosis, and Degradation of Conformationally Modified Albumins. Potential Role of gp30 and gp18 as Novel Scavenger Receptors. J. Biol. Chem. 1993, 268, 7562–7570. [PubMed] [Google Scholar]
- Schnitzer J. E.; Oh P. Albondin-Mediated Capillary Permeability to Albumin. Differential Role of Receptors in Endothelial Transcytosis and Endocytosis of Native and Modified Albumins. J. Biol. Chem. 1994, 269, 6072–6082. [PubMed] [Google Scholar]
- Pearson A. M.; Rich A.; Krieger M. Polynucleotide Binding to Macrophage Scavenger Receptors Depends on the Formation of Base-Quartet-Stabilized Four-Stranded Helices. J. Biol. Chem. 1993, 268, 3546–3554. [PubMed] [Google Scholar]
- Greenfield N. J. Using Circular Dichroism Spectra to Estimate Protein Secondary Structure. Nat. Protoc. 2007, 1, 2876–2890. [DOI] [PMC free article] [PubMed] [Google Scholar]
- Holzwarth G.; Doty P. The Ultraviolet Circular Dichroism of Polypeptides. J. Am. Chem. Soc. 1965, 87, 218–228. [DOI] [PubMed] [Google Scholar]
- Norde W.; Favier J. P. Structure of Adsorbed and Desorbed Proteins. Colloids Surf. 1992, 64, 87–93. [Google Scholar]
- Norde W.; Giacomelli C. E. BSA Structural Changes During Homomolecular Exchange between the Adsorbed and the Dissolved States. J. Biotechnol. 2000, 79, 259–268. [DOI] [PubMed] [Google Scholar]
- Rezwan K.; Meier L. P.; Rezwan M.; Voros J.; Textor M.; Gauckler L. J. Bovine Serum Albumin Adsorption onto Colloidal Al2O3 Particles: A New Model Based on Zeta Potential and UV–Vis Measurements. Langmuir 2004, 20, 10055–10061. [DOI] [PubMed] [Google Scholar]
- Walton A. G.; Maenpa F. C. Application of Fluorescence Spectroscopy to the Study of Proteins at Interfaces. J. Colloid Interface Sci. 1979, 72, 265–278. [Google Scholar]
- Feldman I.; Young D.; McGuire R. Static and Dynamic Quenching of Protein Fluorescence. I. Bovine Serum Albumin. Biopolymers 1975, 14, 335–351. [DOI] [PubMed] [Google Scholar]
- Eftink M. R.; Ghiron C. A. Exposure of Tryptophanyl Residues in Proteins. Quantitative Determination by Fluorescence Quenching Studies. Biochemistry 1976, 15, 672–680. [DOI] [PubMed] [Google Scholar]
- Tiruppathi C.; Finnegan A.; Malik A. B. Isolation and Characterization of a Cell Surface Albumin-Binding Protein from Vascular Endothelial Cells. Proc. Natl. Acad. Sci. U.S.A. 1996, 93, 250–254. [DOI] [PMC free article] [PubMed] [Google Scholar]
- Vogel S. M.; Minshall R. D.; Pilipovic M.; Tiruppathi C.; Malik A. B. Albumin Uptake and Transcytosis in Endothelial Cells in Vivo Induced by Albumin-Binding Protein. Am. J. Physiol.: Lung Cell. Mol. Physiol. 2001, 281, L1512–L1522. [DOI] [PubMed] [Google Scholar]
- Krieger M.; Acton S.; Ashkenas J.; Pearson A.; Penman M.; Resnick D. Molecular Flypaper, Host Defense, and Atherosclerosis. Structure, Binding Properties, and Functions of Macrophage Scavenger Receptors. J. Biol. Chem. 1993, 268, 4569–4572. [PubMed] [Google Scholar]
- Brown M. S.; Basu S. K.; Falck J. R.; Ho Y. K.; Goldstein J. L. The Scavenger Cell Pathway for Lipoprotein Degradation: Specificity of the Binding Site That Mediates the Uptake of Negatively-Charged LDL by Macrophages. J. Supramol. Struct. 1980, 13, 67–81. [DOI] [PubMed] [Google Scholar]
- Zhang H.; Yang Y.; Steinbrecher U. P. Structural Requirements for the Binding of Modified Proteins to the Scavenger Receptor of Macrophages. J. Biol. Chem. 1993, 268, 5535–5542. [PubMed] [Google Scholar]
- Lindman S.; Lynch I.; Thulin E.; Nilsson H.; Dawson K. A.; Linse S. Systematic Investigation of the Thermodynamics of HSA Adsorption to N-iso-Propylacrylamide/N-tert-Butylacrylamide Copolymer Nanoparticles. Effects of Particle Size and Hydrophobicity. Nano Lett. 2007, 7, 914–920. [DOI] [PubMed] [Google Scholar]
- Cedervall T.; Lynch I.; Lindman S.; Berggard T.; Thulin E.; Nilsson H.; Dawson K. A.; Linse S. Understanding the Nanoparticle-Protein Corona Using Methods to Quantify Exchange Rates and Affinities of Proteins for Nanoparticles. Proc. Natl. Acad. Sci. U.S.A. 2007, 104, 2050–2055. [DOI] [PMC free article] [PubMed] [Google Scholar]
- De M.; You C.-C.; Srivastava S.; Rotello V. M. Biomimetic Interactions of Proteins with Functionalized Nanoparticles: A Thermodynamic Study. J. Am. Chem. Soc. 2007, 129, 10747–10753. [DOI] [PubMed] [Google Scholar]
- Hühn D.; Kantner K.; Geidel C.; Brandholt S.; De Cock I.; Soenen S. J. H.; Rivera-Gil P.; Montenegro J.-M.; Braeckmans K.; Müllen K.; et al. Polymer-Coated Nanoparticles Interacting with Proteins and Cells: Focusing on the Sign of the Net Charge. ACS Nano 2013, 7, 3253–3263. [DOI] [PubMed] [Google Scholar]
- Lakowicz J. R.Principles of Fluorescence Spectroscopy, 3rd ed.; Springer: New York, 2006; pp 277–330. [Google Scholar]
- Ladbury J. E.; Chowdhry B. Z. Sensing the Heat: The Application of Isothermal Titration Calorimetry to Thermodynamic Studies of Biomolecular Interactions. Chem. Biol. 1996, 3, 791–801. [DOI] [PubMed] [Google Scholar]
- Mariam J.; Dongre P. M.; Kothari D. C. Study of Interaction of Silver Nanoparticles with Bovine Serum Albumin Using Fluorescence Spectroscopy. J. Fluoresc. 2011, 21, 2193–2199. [DOI] [PubMed] [Google Scholar]
- Kathiravan A.; Renganathan R.; Anandan S. Interaction of Colloidal AgTiO2 Nanoparticles with Bovine Serum Albumin. Polyhedron 2009, 28, 157–161. [Google Scholar]
- Shang L.; Wang Y.; Jiang J.; Dong S. pH-Dependent Protein Conformational Changes in Albumin:Gold Nanoparticle Bioconjugates: A Spectroscopic Study. Langmuir 2007, 23, 2714–2721. [DOI] [PubMed] [Google Scholar]
- Bardhan M.; Mandal G.; Ganguly T. Steady State, Time Resolved, and Circular Dichroism Spectroscopic Studies to Reveal the Nature of Interactions of Zinc Oxide Nanoparticles with Transport Protein Bovine Serum Albumin and to Monitor the Possible Protein Conformational Changes. J. Appl. Phys. 2009, 106, 034701. [Google Scholar]
- Freire E.; Mayorga O. L.; Straume M. Isothermal Titration Calorimetry. Anal. Chem. 1990, 62, 950A–959A. [Google Scholar]
Associated Data
This section collects any data citations, data availability statements, or supplementary materials included in this article.