Abstract
Protectants which are cell membrane permeable, such as glycerol, have been used effectively in the cryopreservation field for a number of decades, for both slow cooling and vitrification applications. In the latter case, the glass transition temperature (Tg) of the vitrification composition is key to its application, dictating the ultimate storage conditions. It has been observed that the addition of some electrolytes to glycerol, such as MgCl2, could elevate the Tg of the mixture, thus potentially providing more storage condition flexibility. The microscopic mechanisms that give rise to the Tg-enhancing behavior of these electrolytes are not yet well understood. The current study focuses on molecular dynamics simulation of glycerol mixed with a variety of metal chlorides (i.e., NaCl, KCl, MgCl2, and CaCl2), covering a temperature range that spans both the liquid and glassy states. The characteristics of the ion–dipole interactions between metal cations and hydroxyl groups of glycerol were analyzed. The interruption of the original hydrogen-bonding network among glycerol molecules by the addition of ions was also investigated in the context of hydrogen-bonding quantity and lifetime. Divalent metal cations were found to significantly increase the Tg by strengthening the interacting network in the electrolyte/glycerol mixture via strong cation–dipole attractions. In contrast, monovalent cations increased the Tg insignificantly, as the cation–dipole attraction was only slightly stronger than the original hydrogen-bonding network among glycerol molecules. The precursor of crystallization of NaCl and KCl was also observed in these compositions, potentially contributing to weak Tg-enhancing ability. The Tg-enhancing mechanisms elucidated in this study suggest a structure-enhancing role for divalent ions that could be of benefit in the design of protective formulations for biopreservation purposes.
1. Introduction
The cryoprotective effect of glycerol has been established for over six decades, since Polge et al.1 discovered that fowl spermatozoa frozen to −79 or −192 °C in media containing glycerol resumed almost complete motility upon thawing. Glycerol is a small, poly-hydroxylated solute that is highly soluble in water and has a low toxicity during short-term exposure to living cells.2 As a cell-membrane-permeable cryoprotectant, glycerol can facilitate the formation of the glassy matrix by increasing the low-temperature viscosity, inhibiting ice crystal growth on a kinetic basis, as well as depressing the freezing point of the bulk media due to colligative effects. For biopreservation-oriented vitrification, the glass transition temperature (Tg) is regarded as one of the primary parameters for determining the ultimate storage conditions. Despite its decades-long role as a cryoprotectant, one of the downsides of its use is the relatively low Tg (190 K3), especially when compared with saccharides, such as trehalose (388 K4,5), which has been attracting considerable attention in the biopreservation field in recent years.6−8 There have been continuous efforts to tailor Tg-enhanced compositions based on existing penetrating, low-Tg protectants. For example, some structurally simple salts have been found to be effective in increasing the Tg of a variety of protectants, such as in magnesium chloride (MgCl2)/glycerol mixtures.9−12
Compared to nonpenetrating disaccharide compounds, compositions with salt and penetrating protectant may promote the effectiveness of anhydrous vitrification significantly by realizing the intracellular presence of protectants.9 Anhydrous preservation takes advantage of vitrification by solvent removal, and can be achieved by liquid water evaporation and/or sublimation of ice instead of ultrafast cooling.13 The highly concentrated matrix has a high Tg, and it is possible to achieve an amorphous state at ambient temperatures. High-Tg, large-sized molecules such as di-/poly-saccharides are commonly used in this context; however, because they do not easily pass through cell membranes, without sophisticated loading technologies intracellular organelles and important biomolecules are oftentimes not adequately protected.14 Protective compositions that contain penetrating compounds, while also possessing a Tg that allows ambient-temperature storage, would be very desirable.
There have been several studies that have demonstrated an increase in Tg upon addition of electrolytes to standard protectants. MacFarlane et al.9 demonstrated that the addition of MgCl2, calcium chloride (CaCl2), or calcium nitrate (CaNO3) to glycerol significantly elevated the final Tg as the molar ratio (R) of electrolyte to glycerol increased. For instance, the MgCl2/glycerol mixture of R = 1.5 yielded a value for Tg of ∼320 K, about 130 K higher than glycerol alone. It was also proposed that monovalent cations such as Na+ could show a similar but weaker Tg increase.9 Even though sucrose is nonpenetrating, the sodium citrate/sucrose mixtures dehydrated by either freeze-drying or convective drying were also found to exhibit a higher Tg than pure sucrose.10,12 In these studies, FTIR analysis revealed that citrate interacted with the hydroxyl (−OH) groups of sucrose via its carboxylate groups.10 It was also observed that freeze-dried trehalose/phosphate mixtures exhibited different Tg behaviors when the pH values of their prelyophilized aqueous solutions were adjusted.11 For example, the addition of potassium or sodium phosphate could increase the Tg only at pH values greater than 6.6, the range where phosphate was in the divalent form.11
In order to gain a better understanding of molecular interactions that lead to an increase in Tg, the current study focused on molecular dynamics (MD) simulation of glycerol mixed with a variety of electrolytes (i.e., NaCl, KCl, MgCl2, and CaCl2), spanning a temperature range that included both the liquid and glassy states. It is expected that the Tg behaviors of sugar/salt mixtures would be mainly related to the hydrogen-bonding (H-bonding) characteristics between the sugar molecules and the anions,15,16 but the nature of the interaction of glycerol with simple metal or halide ions is not obvious, as these ions may not significantly form H-bonds with glycerol molecules. The microscopic mechanisms controlling the Tg-enhancing behavior of metal chlorides have not been elucidated so far for glycerol, so this system was the focus of study. The characteristics of the ion–dipole interactions between the metal ions and −OH groups of glycerol were analyzed, and the interruption of the original H-bonding among glycerol molecules was also investigated. Cation–dipole attractions were found to be central to the Tg-enhancement effects.
2. MD Simulation Methods
The MD simulations in this study were conducted using the NAMD17 simulation program. We employed the all-atom CHARMM36 force fields for glycerol,18 ions19 including Mg2+, Ca2+, Na+, K+, and Cl–, and the modified TIP3P water model.20 512 glycerol molecules were randomly mixed with 0–2048 Mg2+ or Na+ cations (Cl– anions were added to maintain the electrical neutrality in the mixture) to generate the molar ratios (R, electrolyte:glycerol) of 0, 0.5, 1, 1.5, 2, 3, and 4. A 10 ns isothermal–isobaric equilibration was conducted at 560 K to achieve the equilibrium of the solvation of electrolytes in liquid glycerol. The simulation systems were then subjected to a temperature step decrease of 20 K for every 1 ns until 100 K; the cooling rate (i.e., 2 × 10¹⁰ K/s) was consistent with the rates used in other MD modeling efforts in the literature.21−24 Other simulation parameters are the same as those reported in the previous study25 except that a time step of 1 fs was used in the stepwise cooling simulations. For comparison, the CaCl2/glycerol and KCl/glycerol simulation boxes (R = 1 and 2; 512 glycerol molecules in total) were also set up for the 10 ns isothermal–isobaric equilibration at 560 K only.
H-bonds among glycerol molecules and those between Cl– and glycerol were identified via the geometric criteria. A certain aggregate between two O atoms or between Cl– and O was determined to be a H-bond only if the distance between them does not exceed 3.5 or 4 Å, respectively, and the angle O–H···O or O–H···Cl– is greater than 150°. The dynamics of the H-bonding network among glycerol molecules was studied by examining the lifetime of H-bonds. The H-bond time correlation function CHB(t) for the pairs i and j is defined as
| 1 |
where hij(t) equals 1 if the O atom i is H-bonded with O atom j at 0 and t and the bond has not been broken in the meantime for a period longer than t*.26 Thus, the two extreme cases from this definition give the continuous H-bond time correlation function CHBc(t) (when t* = 0) and the intermittent H-bond time correlation function CHB(t) (when t* = ∞). Theoretically, CHBc(t) (when t* = 0) requires a time step of 0 fs which is impossible in the practice of MD simulation. The trajectory was recorded every 0.5 ps in our simulation; thus, we calculated an approximate CHB(t) based on t* = 0.5 ps. The H-bond lifetime τHB can be obtained from the following equation:26
| 2 |
3. Results and Discussion
Strengthened Interacting Network in MgCl2/Glycerol and NaCl/Glycerol Mixtures
The specific volumes (ν) of glycerol and its mixtures with MgCl2 and NaCl are shown in Figure 1 as a function of temperature. The specific volume of pure glycerol at 300 K given by our MD simulation is 76.74 cm3/mol, which is in good agreement with the experimental value (73.21 cm3/mol) at 298 K.27 It can be observed that the specific volume of MgCl2/glycerol and NaCl/glycerol mixtures is considerably reduced compared to glycerol alone (i.e., R = 0). For example, at 300 K, ν is only 34.07 cm3/mol when Mg2+ ions are equimolar with glycerol (i.e., R = 1) and 35.12 cm3/mol in the case of equimolar Na+ ions. The inset graph displays the molar volume from MD simulations as a function of the mole fraction of NaCl (xNaCl) as well as the ideal mixing curve (solid line). The apparent molar volume of NaCl in glycerol at its infinite concentration (xNaCl = 1) was determined to be 16.88 cm3/mol by best-fit of an exponential decay function (ν = −3.272 exp(−xNaCl/0.011) + 16.878, R2 = 0.98) to published data of the apparent molar volume of NaCl in glycerol as a function of xNaCl.28 For cations of a given type, the molar volume of the electrolyte/glycerol mixtures decreases with increasing mole fraction of electrolyte, as seen in the inset graph. Comparison of the MD simulations with ideal solution behavior suggests that the observed reduction in volume is not entirely caused by the additive effect of the denser electrolytes. As ions fill in around glycerol molecules, attractive forces can contribute to the negative deviation of ν from the ideal mixing curve. The molar volume of the NaCl/glycerol mixture is observed to decrease gradually with descending temperature in a manner similar to glycerol, while the MgCl2/glycerol mixtures are less sensitive to the effects of temperature. Flory–Fox theory supports the idea that a system of smaller free volume typically has a higher glass transition temperature,29 so from the perspective of free volume alone, one might expect that the addition of MgCl2 or NaCl into glycerol could increase the composition Tg.
Figure 1.
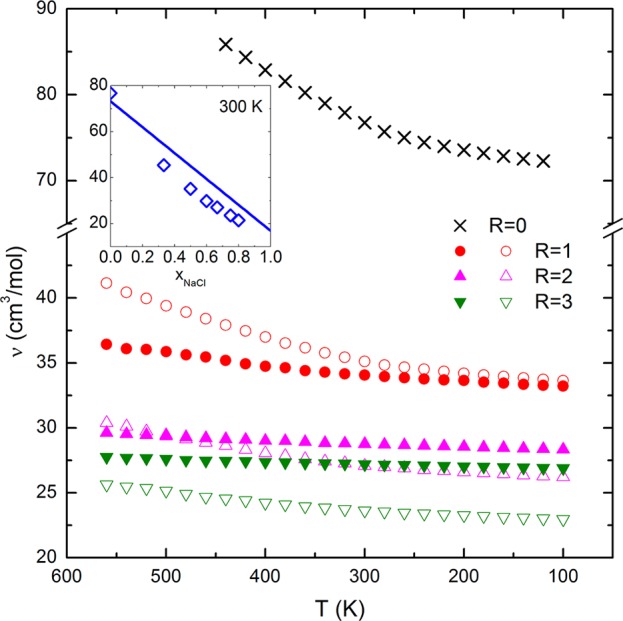
Specific volume (ν) of the MgCl2/glycerol (closed symbols) and NaCl/glycerol (open symbols) mixtures as a function of temperature (only R = 0, 1, 2, and 3 were presented for clarity). Inset graph: the ν of the NaCl/glycerol mixtures as a function of xNaCl at 300 K (solid line, the ideal mixing curve; diamond symbols, the MD simulation results).
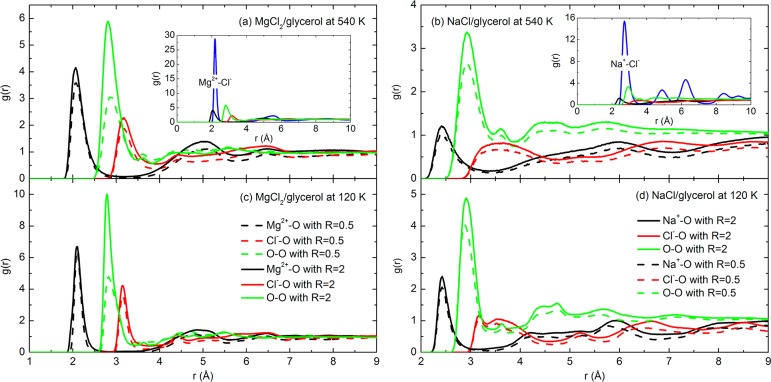
Figure 2 presents the radial distribution functions (g(r)) of a variety of ion–ion, ion–O, or O–O pairs in the MgCl2/glycerol and NaCl/glycerol mixtures. It was found that the interactions between cations and the O atoms of glycerol occurred at a closer distance than any other pairs. The first g(r) peaks for either Mg2+–O or Na+–O were well resolved from the others (including the O–O pairs) at r < 2.5 Å, regardless of the temperature and the molar ratio. For example, for any R value, the first g(r) peak for Mg2+–O pairs existed at 2.07 Å at 540 K (see Figure 2a) and 2.08 Å at 120 K (see Figure 2c), both shorter distances than those for Na+–O pairs (2.42 Å at 540 K, see Figure 2b, and 2.43 Å at 120 K, see Figure 2d). The O–O interactions that characterize the H-bonds among glycerol molecules occurred most frequently at approximately 2.9 Å. In addition, compared to the other pairs, the g(r) peaks for Cl––O pairs were broader and existed at distances larger than 3 Å. We also found that the position of the g(r) peak varied insignificantly with the physical state of the mixture (540 K indicates the liquid state and 120 K the glassy state in Figure 2, with respect to the Tg values reported in the literature9), which implies that the interacting geometry was preserved through the liquid-to-glass transition.
Figure 2.
Radial distribution functions (g(r)) of various ion–ion, ion–atom, and atom–atom pairs in the liquid (540 K) (a and b) and glassy (120 K) (c and d) states of MgCl2/glycerol (a and c) and NaCl/glycerol mixtures (b and d).
The above comparisons of g(r) peaks were also carried out for CaCl2/glycerol and KCl/glycerol mixtures of R = 1 and 2, respectively, with an additional MD simulation for 10 ns at 560 K. The most pronounced g(r) peaks were located at 2.31 Å for the Ca2+–O pairs and at 2.79 Å for the K+–O pairs, both closer than the corresponding distance of the first g(r) peak for O–O pairs. Hence, we suggest that the g(r) peak positions for cation–O pairs may depend mainly on the cation type or, more specifically, the charge density of the cation, with the higher charge density cation creating the shortest “bond” with the oxygen in glycerol.
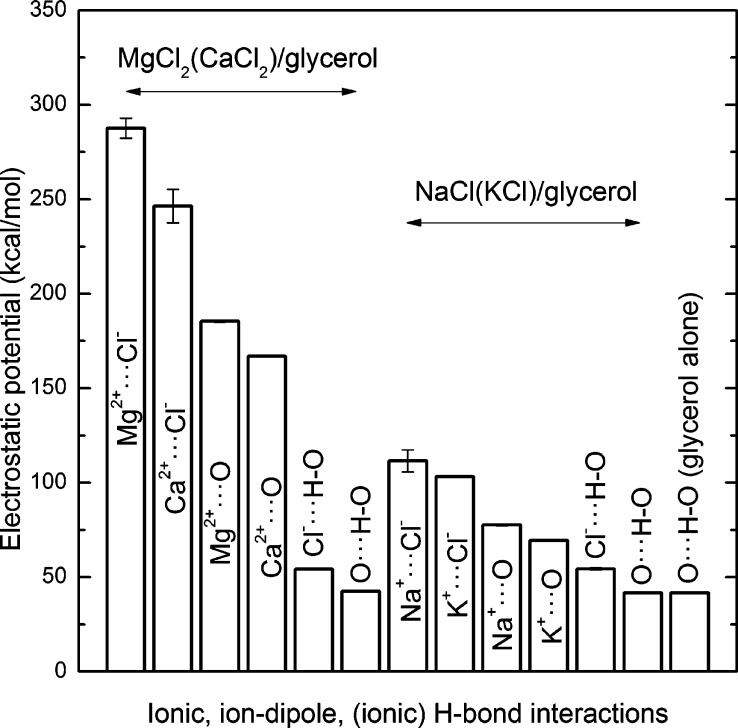
On the basis of the g(r) information shown in Figure 2, there are mainly three types of interactions that exist in the MgCl2/glycerol and NaCl/glycerol mixtures. They are (1) cation–dipole attraction between metal ions and O atoms of glycerol, such as Mg2+–O, (2) ionic H-bond formed between Cl– and −OH groups of glycerol in the manner of Cl–···H–O, and (3) H-bond among glycerol molecules in the manner of O···H–O. In the present study, the average energies of these interactions were evaluated by calculating the nonbonded interaction potentials between cations and O, between the H-acceptor O and H, and between Cl– and H involved in the ionic H-bond. The nonbonded interaction potential calculated by the CHARMM force field consists of the electrostatic (both short- and long-range) and van der Waals interactions with the latter contributing negligibly.18 As seen in Figure 3, the electrostatic potential (≈nonbonded potential) of the Mg2+–O interaction in the MgCl2/glycerol mixture of R = 1 at 440 K was 185.5 ± 0.5 kcal/mol, ∼4-fold larger than 54.1 ± 0.3 kcal/mol determined for the ionic H-bond of Cl–···H–O and 42.5 ± 0.3 kcal/mol for the H-bond of O···H–O. On the other hand, the electrostatic potential of the ion–dipole interaction of Na+–O in the NaCl/glycerol mixture of R = 1 at 440 K was 77.6 ± 0.4 kcal/mol, higher than but comparable in scale with the value 54.4 ± 0.5 kcal/mol, determined for the Cl–···H–O H-bond and 41.8 ± 0.2 kcal/mol determined for the O···H–O H-bond. In addition, the electrostatic potential of the original H-bond of O···H–O in pure glycerol was estimated to be 41.8 ± 0.2 kcal/mol. Therefore, from an energetics perspective, the cation–dipole interaction (especially Mg2+–O) is significantly stronger than that of the H-bonds, while the ionic H-bond is only slightly stronger than the O···H–O bond between glycerol molecules. It was also determined that (1) both the electrostatic and van der Waals potentials did not vary noticeably with temperature or composition (relative difference less than 2%) and (2) the electrostatic potential was the main contribution to the total nonbonded interaction energy, as expected, with the van der Waals potential only accounting for around 1% of the total nonbonded energy. Figure 3 also shows that the electrostatic potentials between Mg2+ and Cl– (287.7 ± 5.3 kcal/mol) and between Na+ and Cl– (111.5 ± 5.8 kcal/mol) were considerably larger than any other interactions in each individual composition, which is expected. Since the nonbonded energy is temperature-independent, for comparison, we calculated Ca2+–O and K+–O interaction energies from the 560 K simulations. The Ca2+–O interaction energy was determined to be 166.9 ± 0.3 kcal/mol compared to 69.4 ± 0.3 kcal/mol for K+–O interactions. On the whole, the descending order of cations in terms of the magnitude of interacting energy is Mg2+, Ca2+, Na+, and K+. The H-bond is largely described as an electrostatic dipole–dipole interaction even though it has some features of covalent bonding.30,31 The ion–dipole attraction is generally stronger than dipole–dipole interactions because the charge density of any ion is much greater than that of a dipole moment (e.g., Mg2+/Na+–O compared to O···H–O). For example, it has been reported that, in aqueous salt solutions, solvent–halide H-bonds were stronger than the original solvent–solvent H-bonds,32,33 which is in agreement with our findings that Cl–···H–O bonds are slightly stronger than O···H–O bonds.
Figure 3.
Electrostatic potential of the interactions including ionic and ion–dipole attractions and ionic/molecular H-bonds in electrolyte/glycerol mixtures (R = 1) and pure glycerol at 440 K.
On the basis of interacting distances and energies, the cation–dipole interactions preferentially replace the original H-bonds among glycerol molecules. More importantly, they can strengthen the interacting network of the whole mixture. Figure 4 shows the trend in the number of cation–dipole interactions with increasing R at 440 K. This value did not change significantly with temperature for either cation. For MgCl2/glycerol compositions, the Nion–dipole interactions increased sharply with the initial addition of MgCl2 and appeared to plateau after R = 2. However, the number of interactions between Na+ and glycerol increased monotonically with the addition of sodium. The average number of cation–dipole interactions that one Mg2+ can form (calculated by N(Mg2+–O)/N(Mg2+)) decreases as the molar ratio increases but remains within the range of 2.6–3.0, as seen in the inset graph. The denominator N(Mg2+) or N(Na+) is the number of cations within 3 Å of the O atoms of glycerol. These parameters were found to not increase significantly with decreasing temperature. In other words, one Mg2+ cation positioned within 3 Å of an O atom of glycerol is able to coordinate with multiple glycerol molecules or, in some cases, all three −OH groups on a single glycerol molecule. As expected, the percentage of N(Mg2+) within 3 Å of an O atom of glycerol out of the total cations was found to decrease gradually from the MgCl2-deficient composition (e.g., ∼35% when R = 0.5) to the MgCl2-rich composition (e.g., ∼17% when R = 4) (data not shown). The interacting network between Mg2+ and glycerol is thus strengthened via the Mg2+ to multiple −OH complexation, thus explaining the steep initial increase in ion–dipole interactions with R. It is interesting to note that the Tg-enhancing effect observed by MacFarlane et al.9 also reached a saturation point at ∼R = 1.5, further validating these results. In contrast to Mg2+, the average number of cation–dipole interactions formed by one Na+ ion (calculated by N(Na+–O)/N(Na+)) was only ∼1.3. Given that the monovalent cation has an approximate 1:1 stoichiometry with −OH compared to the divalent ion which is ∼3:1, we can expect the saturation point to be much higher. The percentage of N(Na+) positioned within 3 Å of an O atom of glycerol out of the total cations was found to decrease slightly from the NaCl-deficient composition (e.g., ∼50% when R = 0.5) to NaCl-rich compositions (e.g., ∼40% when R = 4).
Figure 4.
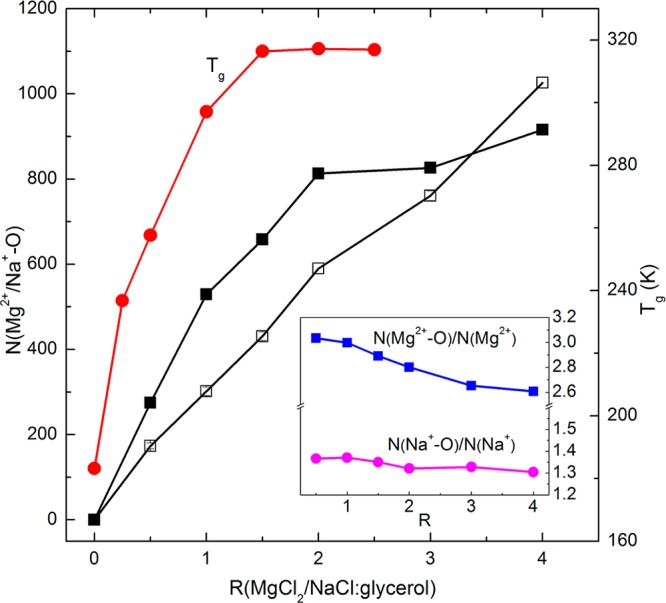
Trends in the numbers of cation–dipole interactions as a function of R in the presence of MgCl2 (closed symbols) and NaCl (open symbols) at 440 K. The Tg as a function of R reported in the literature9 is also included. Inset graph: the average number of cation–dipole interactions that one cation can form.
Shown in Figure 5 is the trend in the number of the Cl–···H–O H-bonds as a function of the molar ratio. As expected, the number of Cl–···H–O H-bonds increased with the sequential addition of electrolytes, while the number of Cl–···H–O H-bonds increased more significantly in the presence of Mg2+ than in the presence of Na+. This is simply due to the fact that the number of Cl– ions is always double the number of cations in the MgCl2/glycerol mixture. The number of Cl–···H–O H-bonds that one Cl– formed (calculated by N(Cl–···H–O)/N(Cl–)) was below 0.5, implying that the Cl– contributed insignificantly to the interacting network, compared to the cation–dipole interactions. Note that N(Cl–) is the number of anions within 4 Å of the O atoms of glycerol. The percentage of N(Cl–) out of the total anions in the presence of Mg2+ decreased gradually from the MgCl2-deficit composition (e.g., ∼74% when R = 0.5) to MgCl2-rich compositions (e.g., ∼45% when R = 4), while it decreased slightly in the presence of Na+ from the NaCl-deficit composition (e.g., ∼73% when R = 0.5) to NaCl-rich compositions (e.g., ∼65% when R = 4).
Figure 5.

Trends in the numbers of Cl–···H–O H-bonds as a function of R in the presence of MgCl2 (closed symbols) and NaCl (open symbols) at 440 K. Inset graph: the average number of Cl–···H–O H-bonds that one anion can form.
On the basis of the simulation data presented thus far, upon the addition of MgCl2 or NaCl, the original glycerol–glycerol H-bonding network appears to be altered chiefly by the cation–dipole attractions. The increase in cation–dipole interactions with increasing R is mirrored by a decrease in the number of glycerol–glycerol H-bonds (data not shown). The original H-bonding network among glycerol molecules was also observed to be more dramatically interrupted by the initial addition of Mg2+ compared to Na+ at the same molar ratio. For example, more than a half of the original O···H–O H-bonds were replaced with the stronger cation–dipole attractions at R = 1.5. After R = 2, such interruption achieved its maximum, resulting in no significant decrease in the number of O···H–O H-bonds upon further addition of Mg2+. Moreover, negligible intramolecular H-bonds were found among glycerol molecules.
Even though the number of glycerol–glycerol H-bonds decreased upon the addition of MgCl2 or NaCl, the remaining hydrogen-bonding network among glycerol molecules was found to be strengthened according to the continuous and intermittent H-bond lifetime τHBc and τHB. The glycerol–glycerol H-bond lifetimes were evaluated as a function of the molar ratio at 440 K, as shown in Figure 6. It is evident from Figure 6 that the H-bond lifetime was extended upon the addition of the metal chlorides, and that the τHBc profiles presented almost the same trend as the τHB even though the scales were different. Interestingly, as observed in previous data, there was a saturation effect observed at R = 2 in MgCl2/glycerol compositions, which was not observed for NaCl/glycerol compositions. The value of τHBi in the presence of MgCl2 increased sharply and then fluctuated around ∼35 ps beyond the molar ratio of 2, which is consistent with the Ncation–dipole and NCl–···H–O profiles shown in Figures 4 and 5, respectively. The value of τHB in the presence of NaCl, on the other hand, increased gradually, yielding a value of 18.68 ps at R = 4 compared to 2.01 ps for glycerol alone. Although not shown in the figure, at 140 K, the τHBi for MgCl2/glycerol was 84.40 ± 0.58 ps, which was not statistically significantly different from that for NaCl/glycerol (83.47 ± 1.13 ps) mixtures (t-test, p = 0.0757 > 0.05), which implies that the H-bond lifetime in the glassy state is not composition dependent. On the whole, it was found that the increase in Tg of the final mixture observed upon the addition of the magnesium chloride9 to glycerol is likely attributed to not only the considerably stronger cation–dipole interactions but also the longer lifetime of the glycerol–glycerol H-bonds above Tg, as indicated by the magnitude of τHB.
Figure 6.
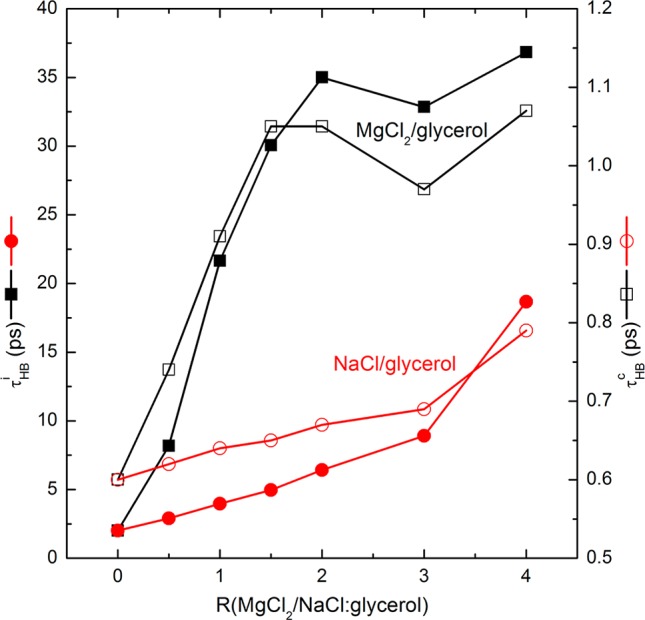
Variation of intermittent H-bond lifetime (τHBi, closed symbols) and continuous H-bond lifetime (τHB, open symbols) as a function of R at 440 K.
Precursor to Crystallization of NaCl and KCl
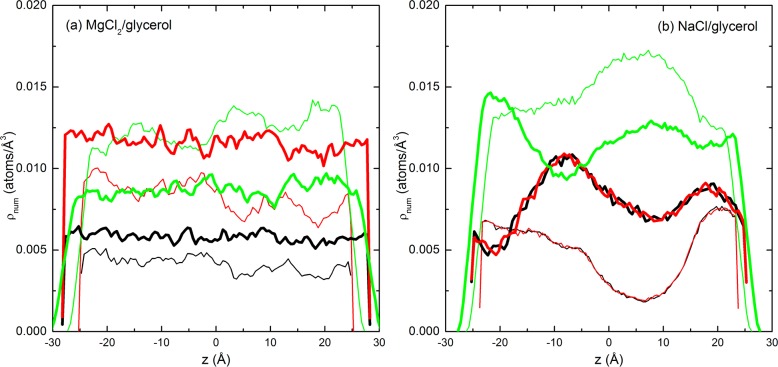
In order to investigate the homogeneity of compositions, the number density (ρnum) profiles of the ions and O atoms in the mixtures were presented as a function of z-axis position in Figure 7. It can be observed that the mixtures of glycerol and NaCl showed significantly more heterogeneity than the mixtures of glycerol and MgCl2. The densities of Mg2+, Cl–, and O fluctuated only moderately throughout the cross section of MgCl2/glycerol mixtures, as seen in Figure 7a. In NaCl/glycerol mixtures, the densities of Na+, Cl–, and O, however, demonstrated significant variations, exhibiting pronounced crests and troughs, which was consistent with the clustering phenomenon. In particular, the crests for Na+ and Cl– synchronized with the troughs for O atoms, demonstrating severe heterogeneity. Moreover, we found that the profiles for cations and anions were coincident, indicating that the ions remained highly paired in glycerol.
Figure 7.
Number densities (ρnum) of cations (black), anions (red), and O atoms of glycerol (green) in MgCl2/glycerol (a) and NaCl/glycerol (b) mixtures along the z axis at 560 K (thin lines, R = 1; thick lines, R = 2).
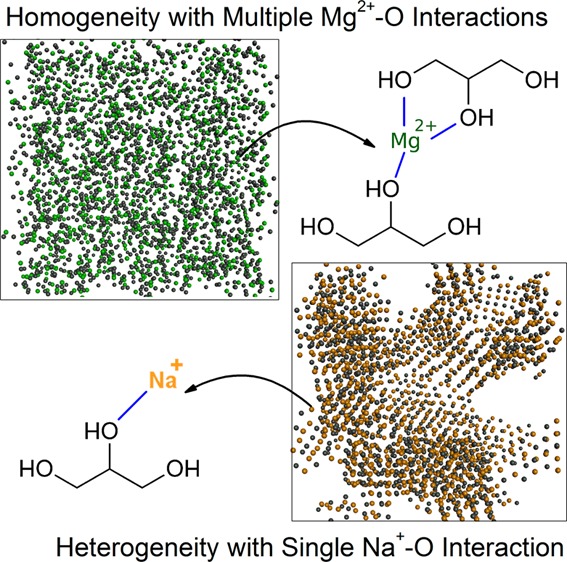
To enable a visualization of the microheterogeneity, Figure 8 shows snapshots of the simulation boxes for the electrolyte/glycerol mixtures of various molar ratios after the 10 ns equilibrium simulation at 560 K. It is evident that the Mg2+ and Cl– ions are evenly distributed across the xy-plane and homogeneously mix with the glycerol molecules after the 10 ns equilibration, as shown in the upper panel of Figure 8. In contrast, in the lower panel, large vacancies where the glycerol molecules reside are observed in the NaCl/glycerol mixtures.
Figure 8.
Snapshots of the simulation boxes for MgCl2/glycerol and NaCl/glycerol mixtures at 560 K (green, Mg2+; gold, Na+; gray, Cl–; views of the simulation boxes are shown for xy-planes; upper panel, MgCl2/glycerol; lower panel, NaCl/glycerol; from left to right: R = 0.5, 1, and 2).
Evidence for the onset of crystallization can also be ascertained by examining the local molecular order. Shown in Figure 9 are the radial distribution functions for cation–cation pairs in electrolyte/glycerol mixtures. As shown in Figure 9a, only one prominent peak can be found for the divalent cationic pairs, indicating a disordered local ionic arrangement. In comparison, Figure 9b gives the radial distribution functions of Na+–Na+ and K+–K+ pairs, which have multiple resolved peaks, indicating the intermediate long-range order and a well-defined arrangement.34 The same pattern is observed for the cation–anion or anion–anion pairs (data not shown). This intermediate long-range order could indicate crystal nucleation, which is the precursor to crystallization.
Figure 9.
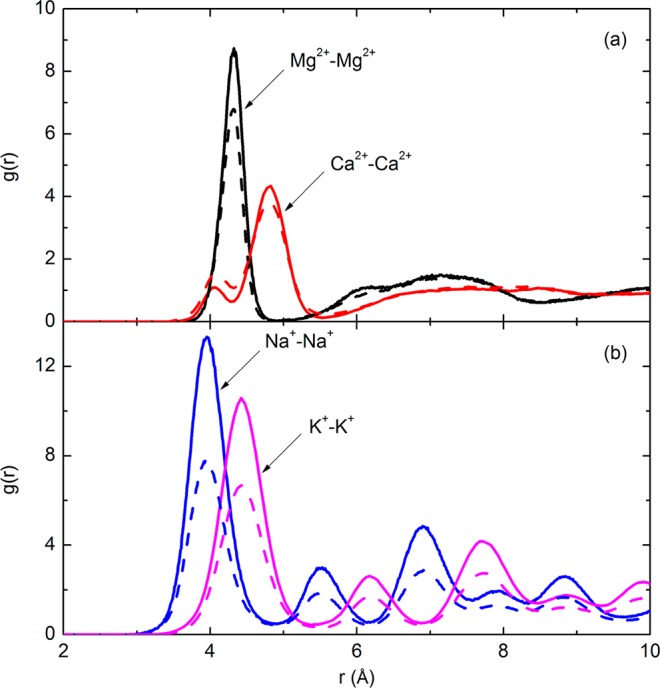
Radial distribution functions (g(r)) of various cation–cation pairs in their mixtures with glycerol at 560 K (solid lines, R = 1; dashed lines, R = 2).
Crystallization is known to be detrimental to the efficacy of the protective matrix. For example, Ragoonanan and Aksan35 studied desiccation-induced heterogeneity using lysozyme/trehalose/salt droplets in which trehalose was the H-bonding cryoprotectant. The heterogeneous crystallization of NaCl was observed at the center of the lysozyme/trehalose/NaCl droplet dried in 0% RH for 24 h. No crystal structures were observed visually in the lysozyme/trehalose/MgCl2 samples. In the lysozyme/trehalose/CaCl2 samples, small hydrate-like peaks were observed in the IR spectra, which were attributed to trehalose–CaCl2 monohydrate crystals36 rather than CaCl2 anhydrous crystals.35 Essentially, supersaturation is the driving force of the crystallization, and in other studies, it was found that the polar nature of the hydroxyl group in ethanol enables dissolution of many ionic compounds, notably magnesium chloride and calcium chloride, whereas sodium and potassium chlorides were observed to be only slightly soluble in ethanol.37 On the basis of these comparisons, we infer that NaCl and KCl may be more prone to crystallization than MgCl2 and CaCl2 in glycerol, consistent with the MD simulation results.
Tg-Enhancing Mechanisms Attributed to Metal Ions
In the context of previous studies on the Tg-enhancing ability of salts, MacFarlane et al.9 proposed that the hydroxyl groups of the glycerol were allowed to slowly replace the water molecules in the hydration sphere of the metal ion during dehydration, thus giving rise to the enhanced H-bonding network. The current study verified this theory, as the 10 ns equilibration of metal chloride/glycerol mixtures at 560 K exhibited the same behavior: hydroxyl groups of the glycerol fully interacted with the metal ions until the stoichiometry was saturated. With the presence of the strong cation–dipole attractions, polymeric chains were formed which, for example, connected the −OH group, cation, and −OH group in sequence or the −OH group, cation, anion, cation, and −OH group in sequence. These polymeric chains could be further linked together via the carbon backbone of the glycerol, resulting in the polymerization of the metal chloride/glycerol mixtures. Both the interacting distances and potentials of the interactions between cations and −OH demonstrated that the order of the strength of the cation–dipole interactions was Mg2+–O > Ca2+–O ≫ Na+–O > K+–O.
We also found a difference between divalent and monovalent metal cations in terms of polymer formation. The addition of Mg2+ or Ca2+ to glycerol resulted in small-sized self-aggregates of MgCl2 or CaCl2 in glycerol-rich compositions or small-sized self-aggregates of glycerol in glycerol-deficient compositions, which did not impair the homogeneity of the matrix. Polymeric chains were able to be easily formed by the extensive interactions between ions and −OH groups and among ions or −OH groups. Given that the newly formed cation–dipole interactions were significantly stronger than the other interactions, the Tg of the total mixture was enhanced significantly. On the other hand, when adding NaCl or KCl, the mixture was separated into glycerol-rich and electrolyte-rich regions due to the relatively high clustering tendency of NaCl or KCl. As a result, the ions only interacted with glycerol at the interfaces between these large clusters, further limiting the Tg-enhancing ability.
4. Conclusions
It has been demonstrated in the literature that the addition of electrolytes such as MgCl2 to glycerol can elevate the Tg of the mixture. In order to elucidate the microscopic mechanisms resulting in the Tg-enhancing behaviors of these electrolytes, MD simulations were conducted on electrolyte/glycerol mixtures which included MgCl2/glycerol, CaCl2/glycerol, NaCl/glycerol, and KCl/glycerol within a wide temperature range. It was found that the total interacting network was strengthened by the involvement of strong Mg2+–dipole interactions, thereby contributing to the polymerization of the mixture and increasing the final Tg. The monovalent cations Na+ and K+, on the other hand, had a limited effect on Tg, attributed to two factors: (1) the interaction between the monovalent cation and the −OH group was on the same scale as the original glycerol–glycerol H-bonds and (2) the microheterogeneity in the NaCl or KCl/glycerol mixtures restricted the cation–dipole interaction to the interfaces between the glycerol-rich and electrolyte-rich regions only. The microscopic insights and Tg-enhancing mechanisms explored in this study can greatly inform the design and preparation of future protective formulations for biopreservation.
Acknowledgments
This study was supported by Grant No. 5RO1GM101796 from the National Institutes of Health. The MD simulations were performed on the University Research Computing (URC) High Performance Computing (HPC) clusters at UNC Charlotte.
The authors declare no competing financial interest.
Funding Statement
National Institutes of Health, United States
References
- Polge C.; Smith A.; Parkes A. Revival of spermatozoa after vitrification and dehydration at low temperatures. Nature 1949, 164, 666. [DOI] [PubMed] [Google Scholar]
- Fuller B. J. Cryoprotectants: the essential antifreezes to protect life in the frozen state. CryoLetters 2004, 25, 375–388. [PubMed] [Google Scholar]
- Zondervan R.; Kulzer F.; Berkhout G. C.; Orrit M. Local viscosity of supercooled glycerol near Tg probed by rotational diffusion of ensembles and single dye molecules. Proc. Natl. Acad. Sci. U. S. A. 2007, 104, 12628–12633. [DOI] [PMC free article] [PubMed] [Google Scholar]
- Chen T.; Fowler A.; Toner M. Literature review: supplemented phase diagram of the trehalose-water binary mixture. Cryobiology 2000, 40, 277–282. [DOI] [PubMed] [Google Scholar]
- Weng L.; Vijayaraghavan R.; MacFarlane D. R.; Elliott G. D. Application of the Kwei equation to model the Tg behavior of binary blends of sugars and salts. Cryobiology 2013, 68, 155–158. [DOI] [PMC free article] [PubMed] [Google Scholar]
- Crowe L. M.; Reid D. S.; Crowe J. H. Is trehalose special for preserving dry biomaterials?. Biophys. J. 1996, 71, 2087–2093. [DOI] [PMC free article] [PubMed] [Google Scholar]
- Crowe J. H.; Carpenter J. F.; Crowe L. M. The role of vitrification in anhydrobiosis. Annu. Rev. Physiol. 1998, 60, 73–103. [DOI] [PubMed] [Google Scholar]
- Crowe J. H.; Crowe L. M.; Oliver A. E.; Tsvetkova N.; Wolkers W.; Tablin F. The trehalose myth revisited: introduction to a symposium on stabilization of cells in the dry state. Cryobiology 2001, 43, 89–105. [DOI] [PubMed] [Google Scholar]
- MacFarlane D.; Pringle J.; Annat G. Reversible self-polymerizing high Tg lyoprotectants. Cryobiology 2002, 45, 188–192. [DOI] [PubMed] [Google Scholar]
- Kets E.; IJpelaar P.; Hoekstra F.; Vromans H. Citrate increases glass transition temperature of vitrified sucrose preparations. Cryobiology 2004, 48, 46–54. [DOI] [PubMed] [Google Scholar]
- Ohtake S.; Schebor C.; Palecek S. P.; de Pablo J. J. Effect of pH, counter ion, and phosphate concentration on the glass transition temperature of freeze-dried sugar-phosphate mixtures. Pharm. Res. 2004, 21, 1615–1621. [DOI] [PubMed] [Google Scholar]
- Reis J.; Sitaula R.; Bhowmick S. Water activity and glass transition temperatures of disaccharide based buffers for desiccation preservation of biologics. J. Biomed. Sci. Eng. 2009, 2, 594–605. [Google Scholar]
- Oliver A. E.; Crowe L. M.; Crowe J. H. Methods for dehydration-tolerance: depression of the phase transition temperature in dry membranes and carbohydrate vitrification. Seed Sci. Res. 1998, 8, 211–221. [Google Scholar]
- Chen T.; Acker J. P.; Eroglu A.; Cheley S.; Bayley H.; Fowler A.; Toner M. Beneficial effect of intracellular trehalose on the membrane integrity of dried mammalian cells. Cryobiology 2001, 43, 168–181. [DOI] [PubMed] [Google Scholar]
- Angell C.; Sare J.; Sare E. Glass transition temperatures for simple molecular liquids and their binary solutions. J. Phys. Chem. 1978, 82, 2622–2629. [Google Scholar]
- Taylor L. S.; Zografi G. Sugar–polymer hydrogen bond interactions in lyophilized amorphous mixtures. J. Pharm. Sci. 1998, 87, 1615–1621. [DOI] [PubMed] [Google Scholar]
- Phillips J. C.; Braun R.; Wang W.; Gumbart J.; Tajkhorshid E.; Villa E.; Chipot C.; Skeel R. D.; Kale L.; Schulten K. Scalable molecular dynamics with NAMD. J. Comput. Chem. 2005, 26, 1781–1802. [DOI] [PMC free article] [PubMed] [Google Scholar]
- Hatcher E. R.; Guvench O.; MacKerell A. D. Jr. CHARMM additive all-atom force field for acyclic polyalcohols, acyclic carbohydrates, and inositol. J. Chem. Theory Comput. 2009, 5, 1315–1327. [DOI] [PMC free article] [PubMed] [Google Scholar]
- Beglov D.; Roux B. Finite representation of an infinite bulk system: solvent boundary potential for computer simulations. J. Chem. Phys. 1994, 100, 9050–9063. [Google Scholar]
- Jorgensen W. L.; Chandrasekhar J.; Madura J. D.; Impey R. W.; Klein M. L. Comparison of simple potential functions for simulating liquid water. J. Chem. Phys. 1983, 79, 926–935. [Google Scholar]
- Caffarena E. R.; Grigera J. R. Hydration of glucose in the rubbery and glassy states studied by molecular dynamics simulation. Carbohydr. Res. 1999, 315, 63–69. [Google Scholar]
- Yoshioka S.; Aso Y.; Kojima S. Prediction of glass transition temperature of freeze-dried formulations by molecular dynamics simulation. Pharm. Res. 2003, 20, 873–878. [DOI] [PubMed] [Google Scholar]
- Giovambattista N.; Angell C. A.; Sciortino F.; Stanley H. E. Glass-transition temperature of water: A simulation study. Phys. Rev. Lett. 2004, 93, 047801. [DOI] [PubMed] [Google Scholar]
- Weng L.; Elliott G. D. Dynamic and thermodynamic characteristics associated with the glass transition of amorphous trehalose-water mixtures. Phys. Chem. Chem. Phys. 2014, 16, 11555–11565. [DOI] [PMC free article] [PubMed] [Google Scholar]
- Weng L.; Chen C.; Zuo J.; Li W. Molecular dynamics study of effects of temperature and concentration on hydrogen-bond abilities of ethylene glycol and glycerol: implications for cryopreservation. J. Phys. Chem. A 2011, 115, 4729–4737. [DOI] [PubMed] [Google Scholar]
- Skarmoutsos I.; Guardia E.; Samios J. Hydrogen bond, electron donor-acceptor dimer, and residence dynamics in supercritical CO-ethanol mixtures and the effect of hydrogen bonding on single reorientational and translational dynamics: A molecular dynamics simulation study. J. Chem. Phys. 2010, 133, 014504. [DOI] [PubMed] [Google Scholar]
- To E. C.; Davies J. V.; Tucker M.; Westh P.; Trandum C.; Suh K. S.; Koga Y. Excess chemical potentials, excess partial molar enthalpies, entropies, volumes, and isobaric thermal expansivities of aqueous glycerol at 25 C. J. Solution Chem. 1999, 28, 1137–1157. [Google Scholar]
- Hammadi A.; Champeney D. C. Ion-solvent interactions of some alkali halides in glycerol from density and viscosity data. J. Chem. Eng. Data 1998, 43, 1004–1008. [Google Scholar]
- Fox T. G.; Flory P. J. Second-order transition temperatures and related properties of polystyrene. I. Influence of molecular weight. J. Appl. Phys. 1950, 21, 581–591. [Google Scholar]
- Bryant C. M.; McClements D. J. Molecular basis of protein functionality with special consideration of cold-set gels derived from heat-denatured whey. Trends Food Sci. Technol. 1998, 9, 143–151. [Google Scholar]
- Dill K. A. Dominant forces in protein folding. Biochemistry 1990, 29, 7133–7155. [DOI] [PubMed] [Google Scholar]
- Jungwirth P.; Tobias D. J. Molecular structure of salt solutions: a new view of the interface with implications for heterogeneous atmospheric chemistry. J. Phys. Chem. B 2001, 105, 10468–10472. [Google Scholar]
- Arshadi M.; Yamdagni R.; Kebarle P. Hydration of the halide negative ions in the gas phase. II. Comparison of hydration energies for the alkali positive and halide negative ions. J. Phys. Chem. 1970, 74, 1475–1482. [Google Scholar]
- Mucha M.; Jungwirth P. Salt crystallization from an evaporating aqueous solution by molecular dynamics simulations. J. Phys. Chem. B 2003, 107, 8271–8274. [Google Scholar]
- Ragoonanan V.; Aksan A. Heterogeneity in desiccated solutions: implications for biostabilization. Biophys. J. 2008, 94, 2212–2227. [DOI] [PMC free article] [PubMed] [Google Scholar]
- Fujimoto T.; Oku K.; Tashiro M.; Machinami T. Crystal Structure of α,α-Trehalose-Calcium Chloride Monohydrate Complex. J. Carbohydr. Chem. 2006, 25, 521–532. [Google Scholar]
- Windholz M.The Merck Index: an Encyclopedia of Chemicals and Drugs, 9th ed.; Merck: Rahway, New Jersey, 1976. [Google Scholar]


