Abstract
Purpose
To study the formation and subsequent reactions of the 5-methyl-2′-deoxycytidine cation radical (5-Me-2′-dC•+) in nucleosides and DNA-oligomers and compare to one electron oxidized thymidine.
Materials and methods
Employing electron spin resonance (ESR), cation radical formation and its reactions were investigated in 5-Me-2′-dC, thymidine (Thd) and their derivatives, in fully double stranded (ds) d[GC*GC*GC*GC*]2 and in the 5-Me-C/A mismatched, d[GGAC*AAGC:CCTAATCG], where C* = 5-Me-C.
Results
We report 5-Me-2′-dC•+ production by one-electron oxidation of 5-Me-2′-dC by Cl2•− via annealing in the dark at 155 K. Progressive annealing of 5-Me-2′-dC•+ at 155 K produces the allylic radical (C-CH2•). However, photoexcitation of 5-Me-2′-dC•+ by 405 nm laser or by photoflood lamp leads to only C3′• formation. Photoexcitation of N3-deprotonated thyminyl radical in Thd and its 5′-nucleotides leads to C3′• formation but not in 3′-TMP which resulted in the allylic radical (U-CH2•) and C5′• production. For excited 5-Me-2′,3′-ddC•+, absence of the 3′-OH group does not prevent C3′• formation. For d[GC*GC*GC*GC*]2 and d[GGAC*AAGC:CCTAATCG], intra-base paired proton transferred form of G cation radical (G(N1-H)•:C(+H+)) is found with no observable 5-Me-2′-dC•+ formation. Photoexcitation of (G(N1-H)•:C(+H+)) in d[GC*GC*GC*GC*]2 produced only C1′• and not the expected photoproducts from 5-Me-2′-dC•+. However, photoexcitation of (G(N1-H)•:C(+H+)) in d[GGAC*AAGC:CCTAATCG] led to C5′• and C1′• formation.
Conclusions
C-CH2• formation from 5-Me-2′-dC•+ occurs via ground state deprotonation from C5-methyl group on the base. In the excited 5-Me-2′-dC•+ and 5-Me-2′,3′-ddC•+, spin and charge localization at C3′ followed by deprotonation leads to C3′• formation. Thus, deprotonation from C3′ in the excited cation radical is kinetically controlled and sugar C-H bond energies are not the only controlling factor in these deprotonations.
Keywords: 5-Methylcytosine, DNA-oligomers, Thymidine, ESR, TD-DFT calculations, HFCC values, cation radical, one-electron oxidation
Introduction
5-Methylcytosine (5-Me-C), which is found in genomic DNA, represses gene expression and thereby is involved in cellular differentiation and ultimately epigenetics. 5-Me-C is primarily abundant in repeating CpG doublets (Clark et al. 1994; Zuo et al. 1995). In DNA, 5-Me-C is known as a “hot spot” for mutation in irradiated polynucleotides (Zuo et al. 1995). Therefore, radiation chemical studies of the nucleobase (5-Me-C), of its nucleoside 5-Me-2'-dC, and of 5-Me-C incorporated DNA-oligomers are of importance to the understanding of why 5-Me-C acts as the mutational “hot spot” in DNA”.
A number of radiation chemical studies the base, 5-Me-C, the nucleoside 5-Me-2'-dC, and the ds polymer (poly (dG:5-Me-2'-dC)) have been reported in the literature. For example, pulse radiolysis studies of 5-Me-C was carried out by von Sonntag and his group (Hissung and von Sonntag, 1979) in aqueous solution at ambient temperature and characterized the UV-Vis (ultraviolet-visible) absorption spectrum of its reversibly N3-protonated one-electron adduct, and elucidated the reactions of radiation-produced hydroxyl radical (•OH) with 5-Me-C. Also, γ-radiolysis of homogeneous aqueous solutions of poly (dG:5-Me-2'-dC) and poly (dA:dT) at ambient temperatures reported very similar yields of thymine glycol (Zuo et al. 1995) thereby showing that both 5-Me-C and T residues in DNA are both equally affected by •OH reactions.
Electron spin resonance (ESR) studies of X-ray irradiated (10 K) single crystals of 5-methylcytosine hemihydrate at 10 K along with theoretical calculations based on density functional theory (DFT) have led to the identification of various radical species, e.g., the N1-deprotonated 5-methylcytosine cation radical (5-Me-C(N1-H)•), the allylic radical (C-CH2•) likely formed via deprotonation from the methyl group was identified, along with the H-atom adduct radicals (one-electron reduction followed by protonation) at C5 (C5-H-C6-yl) and C6 (C6-H-C5-yl) (Krivokapić et al. 2009, 2010). Electron spin resonance (ESR) studies of X-ray irradiated single crystal of 5-methylcytosine hemihydrate at ambient temperature (295 K) as well as ESR studies after warming at 295 K of X-ray irradiated (10 K) 5-Me-C single crystals show only C-CH2• and C6-H-C5-yl radicals (Krivokapić et al. 2009, 2010).
ESR studies of 5-Me-C in X-ray irradiated homogeneous 7 M BeF2 glasses (either H2O or D2O) at low temperatures (140 to 210 K) show unequivocal formation of C-CH2• due to H-atom abstraction by •OH from the methyl group at C5 (Ohlmann and Hüttermann, 1993). Moreover, in these glasses, owing to the pre-hydrated electron addition at 77 K followed by protonation via warming the glass at 190 K, C6-H-C5-yl spectrum has been reported (Ohlmann and Hüttermann, 1993). Photoionization of 5-Me-C in 8 M NaClO4 glasses at 77 K led to the formation of the 5-Me-C cation radical and via warming, the C-CH2• spectrum was observed (Sevilla et al. 1972). However, C3′• formation via photoionization of the 5-Me-2′-dC using a 248 nm laser at 77 K has been reported (Malone et al. 1995).
The theoretically calculated ionization potential (Ip) of 5-Me-C as 8.50 eV whereas the corresponding Ip value of C is 8.79 eV (Close, 2003). The lowering of Ip in 5-Me-C (0.29 eV) is attributed to the presence of the electron donating methyl group at C5 in the cytosine base. Also, due to the electron donating methyl group, the pKa of the 5-Me-C(H+) becomes ca. 4.7 (Kawai et al. 2002, 2009) whereas the corresponding pKa of C(H+) is ca. 4.5 (Adhikary et al. 2009). As a result, the intra-base pair proton transfer equilibrium of the guanine cation radical in the G:C base pair (G•+:C) formed via one-electron oxidation shifts to favor protonation at the 5-Me-C and this has indeed been shown by employing laser flash photolysis of the 5-Me-C incorporated dsDNA-oligomers (Kawai et al. 2009). However, replacement of C by 5-Me-C in a dsDNA-oligomer in aqueous solution at room temperature does not affect the extent of hole (unpaired spin) trapping at G sites (Kanvah and Schuster, 2004). Furthermore, this group (Joseph and Schuster, 2012), has reported an increase of strand breaks at 5-Me-C/A or at 5-Me-C/T mismatches after hot piperidine treatment for photoexcited dsDNA-oligomers relative to the fully dsDNA oligomers without mismatches. Moreover, employing liquid chromatography followed by tandem mass spectrometry (LC-MS/MS), a novel intrastrand crosslinking via addition of C-CH2• to the C-8 atom of G in the complementary strand has been reported in each of the γ-irradiated 5-Me-C:G and G:5-Me-C base pairs in aqueous solution at ambient temperature in the absence of oxygen (Zhang and Wang, 2003).
In this work, we report the radiation chemical studies of the nucleobase (5-Me-C), of the nucleosides (e.g., 5-Me-2'-dC, 2',3'-dideoxy-5-methylcytidine (5-Me-2',3'-ddC)) and 5-Me-C incorporated DNA-oligomers (fully double stranded (ds) and ds with 5-Me-C mismatches). Not only we have reported the ESR spectrum of the 5-Me-2'-dC cation radical (5-Me-2′-dC•+), our results show that only C-CH2• formation occurs on thermally induced deprotonation of 5-Me-2′-dC•+ from the C5-methyl group. Whereas, ESR spectral studies show that predominantly C3′• formation occurs from excited 5-Me-2′-dC•+ via deprotonation at the sugar C3′-site. DFT calculations show the spin and charge localization changes from the base to the sugar in the excited state which indicate that deprotonation occurs at sites of high spin and charge. The absence of the 3′-OH group in excited 5-Me-2′,3′-ddC•+ does not prevent deprotonation at C3′ to produce C3′•. This result shows that the excited state deprotonation of the cation radical is not entirely thermodynamically controlled. C3′• formation is also observed via photoexcitation of N3-deprotonated thyminyl radical in Thd and its 5′-nucleotides but not in 3′-TMP. The one-electron oxidized fully double stranded (ds) DNA-oligomer containing 5-Me-C with or without a 5-Me-C/A mismatch produced the intra-base paired proton transferred form of the guanine cation radical that on excitation forms only C1′• for fully ds DNA-oligomer but showed substantial C5′• formation for an one-electron oxidized DNA-oligomer with a 5-Me-C/A mismatch. These results, in conjunction with the results reported by Joseph et al. (Joseph and Schuster, 2012) suggest that mismatches having 5-Me-C would be more mutagenic.
Materials and Methods
Model compounds
Monomeric model Compounds
5-Methyl-2'-deoxycytidine (5-Me-2'-dC) and 2',3'-dideoxy-5-methylcytidine (5-Me-2',3'-ddC) were obtained from Carbosynth Ltd. (Berkshire, UK). 2'-deoxycytidine, Thymidine (Thd), thymidine-3'-monophosphate (3'-TMP), thymidine-5'-monophosphate (5'-TMP), thymidine-5'-diphosphate (5'-TDP), thymidine-5'-triphosphate (5'-TTP), lithium chloride (LiCl) (99% anhydrous, SigmaUltra), and sodium perchlorate (NaClO4) were obtained from Sigma Chemical Company (St Louis, MO, USA). 2',3'-dideoxy-5'-thymidine triphosphate (2',3'-dd-5'-TTP) was purchased from TriLink Biotechnologies (San Diego, CA, USA). 2',3'-dideoxyadenosine (2',3'-ddAdo) was obtained from Berry & Associates, Inc. (Dexter, MI, USA). Potassium persulfate (crystal) was obtained from Mallinckrodt, Inc. (Paris, KY, USA). Deuterium oxide (D2O) (99.9 atom % D) was purchased from Aldrich Chemical Company Inc. (Milwaukee, WI, USA).
dsDNA oligomers
The lyophilized, desalted, and column purified dsDNA oligomers – d[GC*GC*GC*GC*]2 and d[GGAC*AAGC:CCTAATCG] (C* = 5-Me-C) were procured from SynGen, Inc. (Hayward, CA, USA). For ensuring the complete removal of protecting groups such as benzoyl (Black and Bernhard 2011) from these dsDNA oligomers, a modified column purification protocol with extended wash steps was applied by SynGen, Inc. following our recent work with S-oligomers (Adhikary et al. 2013a).
All above-mentioned chemicals were used without further purification.
Preparations of solutions
Following our ongoing studies with the DNA and RNA monomers (Becker et al. 2007, 2010a, 2010b; Adhikary et al. 2012, 2013b) and DNA and RNA oligomers (Becker et al. 2007, 2010a, 2010b; Adhikary et al. 2009, 2010, 2012, 2013a; Khanduri et al. 2011), homogeneous solution of each monomer was prepared by dissolving ~ 2 to 3 mg of it in 1 ml of 7.5 M LiCl in D2O; whereas to prepare a homogeneous solution of a dsDNA oligomer, ~ 1.5 to 2 mg of it was dissolved in 1 ml of 7.5 M LiCl in D2O. K2S2O8 (5 to 6 mg/ml) was added to each solution as an electron scavenger to investigate only the formation of the one-electron oxidized species and its subsequent reactions. Following the procedure by Sevilla and co-workers (Sevilla et al. 1972), homogeneous solution of 5-Me-2'-dC (0.5 mg/ml) was prepared in 8 M NaClO4 in D2O.
Our previous work (Adhikary et al. 2010) has shown that the 8-mer d[TGCGCGCA]2 remains double stranded in 7.5 M LiCl in D2O till ca. 48°C.
pH adjustments
The solutions of 5-Me-2'-dC in LiCl were prepared at pHs ca. 5, 7, and 9. The solutions of Thd and its nucleotides were prepared at pH ca. 10. The solutions of 5-Me-2',3'-ddC, 2',3'-ddAdo and of dsDNA oligomers were prepared at the native pH of 7.5 M LiCl in D2O (pH/pD ca. 5). pD of the solutions was adjusted, following our earlier works (Adhikary et al. 2009, 2010, 2012, 2013b; Khanduri et al. 2011), by quickly adding microliter amounts of 1 M NaOH in D2O under ice-cooled conditions. Owing to the high ionic strength (7.5 M LiCl) of these solutions, we were not able to use pH meters for accurate pH measurements. Thus, pH values reported in this work were obtained using pH papers and are approximate.
Glassy sample preparation
Following our earlier works, these homogenous solutions were thoroughly bubbled with nitrogen to remove the dissolved oxygen. Transparent glassy samples were then prepared by drawing these degassed solutions into 4 mm Suprasil quartz tubes (cat.no. 734-PQ-8, WILMAD Glass Co., Inc., Buena, NJ) followed by immediately immersing these tubes containing the solutions in liquid nitrogen (77 K).
Irradiation and Storage of Irradiated samples
Following our earlier works with monomers and oligomers, these glassy samples were then γ (60Co) -irradiated (absorbed dose = 1.4 kGy (for monomers) and = 3 kGy (for dsDNA oligomers) at 77 K. These γ-irradiated samples were stored at 77 K in the dark.
Formation of one-electron oxidized species via thermal annealing and storage of these samples
Following our earlier works, one-electron oxidized monomers and dsDNA oligomers were produced via annealing in the dark due to one-electron oxidation by Cl2•− in a variable temperature assembly (Air Products) in the temperature range (100–155)±4 K employing cooled nitrogen gas. Subsequent reactions of the one-electron oxidized species were followed by ESR spectroscopy on further annealing these samples at 155±4 K for 5 to 155 min. After annealing, these samples were immediately immersed in liquid nitrogen (77 K) and stored in Teflon containers at 77 K in the dark.
Photo-excitation of one-electron oxidized species in monomers and dsDNA oligomers
Following our works (Adhikary et al. 2010, 2011), one-electron oxidized monomers and one-electron oxidized dsDNA oligomers were photoexcited by using thermoelectrically cooled blue laser (TECBL-20G-405, World Star Tech, Lot 6880, λ = 405 nm, 20 mW) at the range 143 to 148 K. Photoexcitation of samples were also carried out by employing a photoflood lamp (250 W) in the presence of water filter (to cut off the infrared (IR) and UV components of this light) along with a 310 nm cut-off filter at the range 143 to 148 K and a low pressure mercury lamp at 77 K as per our previous works (Adhikary et al. 2005, 2008; Sevilla et al. 1972).
Electron spin resonance (ESR) and analyses of the ESR spectra
Following our previous works (Adhikary et al. 2005, 2008, 2009, 2010, 2012, 2013a, 2013b), ESR spectra of the samples were recorded at 77 K and at 40 dB (20 µW) after γ-irradiation, after annealing at (100–155)±4 K, and after photoexcitation in the range 143 to 148 K. A Varian Century Series X-band (9.3 GHz) ESR spectrometer with an E-4531 dual cavity, 9-inch magnet, and a 200 mW Klystron was used and Fremy’s salt (gcenter = 2.0056, AN = 13.09 G) was employed for the field calibration. All ESR spectra were recorded at 77 K.
Following our previous works employing the Bruker programs (WIN-EPR and SIMFONIA), simulated spectra of the corresponding experimentally recoded spectra were obtained.
Theoretical (DFT) calculations
The calculations were preformed using B3LYP functional and 6–31G* basis set as implemented in Gaussian09 suite of programs (Frisch et al. 2009). Molecular structures and molecular orbitals were plotted using the freeware IQmol (IQmol) molecular modeling program.
It has been well-established in the literature that B3LYP/6-31G* method gave the hyperfine coupling constant (HFCC) value which is comparable to the experimentally obtained one (Raiti and Sevilla 1999, Adhikary et al. 2006, 2008, 2010, 2012, 2013a,b). Therefore, the B3LYP/6-31G* method was employed to calculate the HFCC of radicals reported in this work.
Following our works (Kumar and Sevilla 2006, 2008; Becker et al. 2007, 2010a,b; Adhikary et al. 2005, 2008), the excited states of 5-Me-2'-dC cation radical were calculated using the TD-DFT (time dependent density functional theory) for determining the transition energy and the nature of the molecular orbitals involved in transitions. Calculations were performed using the TD- B3LYP/6-31G(d) method as implemented in Gaussian 09.
Results
(A) Experimental studies
Formation of the 5-Me-2'-dC•+ and its deprotonation in 5-Me-2'-dC
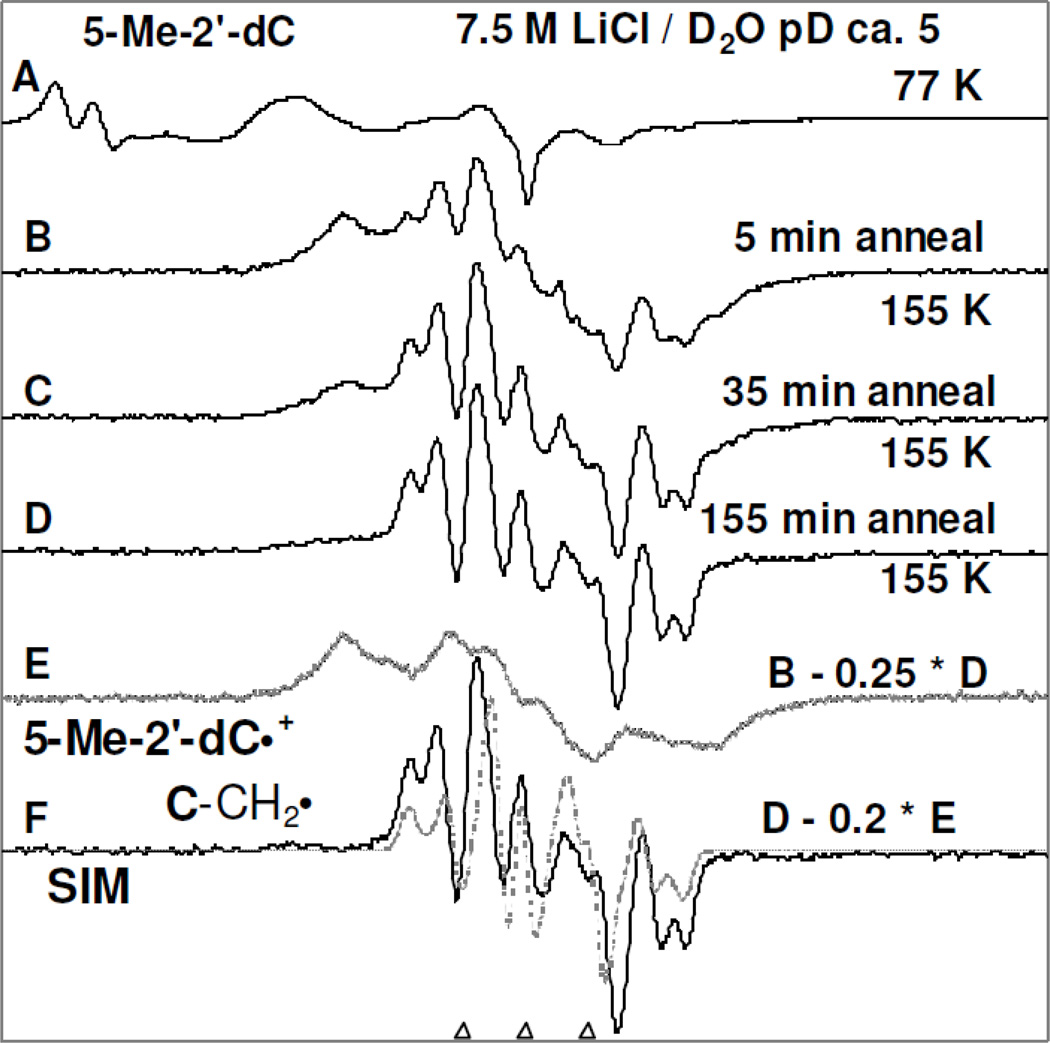
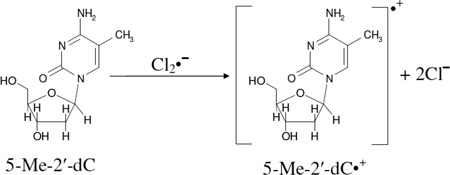
In Figure 1, the ESR spectroscopic evidence of the formation of the “pristine” 5-Me-2'-dC cation radical (5-Me-2'-dC•+) and thermal production of the allylic radical (C-CH2•) via deprotonation from the 5-methyl group (reactions 1 and 2) are presented.
Figure 1.
(A) ESR spectrum (black) showing line components of Cl2•− and SO4•− thereby providing evidence of their formation at 77 K in γ-irradiated (1.4 kGy) sample of 5-Me-2'-dC (2 mg / ml) in the homogeneous glassy solution of 7.5 M LiCl in D2O (pD (ca. 5)) in the presence of K2S2O8. (B) Spectrum (black) of the sample in (A) after annealing to ca. 155 K for 5 min. (C) Spectrum (black) obtained after further annealing at ca. 155 K for 30 min (total 35 min). (D) Spectrum (black) obtained after further annealing at ca. 155 K for 120 min (total 155 min). (E) The spectrum (Gray) was extracted by subtraction of 25% spectrum D from spectrum B and is assigned to 5-Me-2′-dC•+ (see supplemental Figure S1). (F) Subtraction of 20% of spectrum E from spectrum D, the spectrum in black was obtained. The simulated spectrum (gray) due to C-CH2• is placed underneath the black spectrum. For simulation parameters see text. All ESR spectra shown in Figures A to D were recorded at 77 K. The three reference markers in this figure and in subsequent figures are Fremy’s salt resonances with central marker is at g= 2.0056 and each of three markers is separated from one another by 13.09 G.
Figure 1A presents the 77 K ESR spectrum (black) of the γ-irradiated frozen glassy solution of 5-Me-2'-dC (2 mg/ml in 7.5 M LiCl in D2O). The spectrum in Figure 1A, shows the formation of Cl2•− which results from radiation-induced holes as well as the production of SO4•− owing to the reaction between radiation-produced electrons and S2O8−2 at 77 K (Adhikary et al. 2005, 2013a, 2013b). The two large low field resonances are due to Cl2•−; the central singlet feature results from SO4•−. Progressive thermal annealing of this sample at and above 125 K results in the formation of additional Cl2•− due to the reaction between SO4•− with Cl− (spectrum not shown) as observed in our previous work (Adhikary et al. 2005, 2013a, 2013b).
 |
(1) |
 |
(2) |
Annealing of this sample to 155 K for increasing times resulted in spectra B, C, and D. Subtraction of 25 % of spectrum D from spectrum B produced the gray colored spectrum E. The overall hyperfine splitting, lineshape, and the center of spectrum E matched with those in the reported spectrum (see Figure 4 in Sevilla et al. 1972) of 5-Me-C•+ which had been obtained via photoionization of 5-Me-C. Based on this work (Sevilla et al. 1972), a 5-Me-2'-dC•+ spectrum was obtained via photoionization of 5-Me-2'-dC (0.5 mg/ml in 8 M NaClO4 in D2O) at 77 K (supplemental Figure S1). The overall hyperfine splitting, lineshape, and the center of this spectrum matched with those in spectrum E (supplemental Figure S1). Therefore, spectrum 1E was assigned to 5-Me-2'-dC•+ spectrum.
Figure 4.
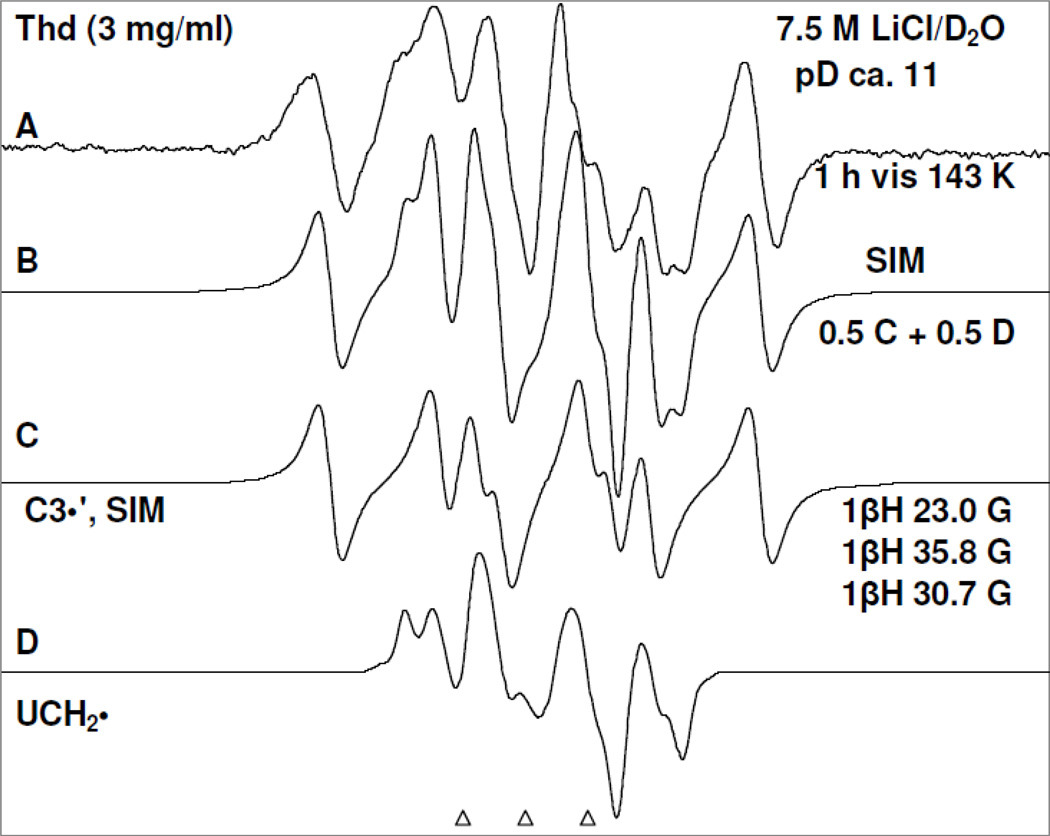
Spectrum (A) after visible illumination by photoflood lamp of T(−H)• formed in a sample of Thd (3 mg/ml) at pD ca. 11 at 143 K for 1 h. This spectrum is already shown in Figure 3 (E). Spectrum (B) obtained after adding 50% of spectrum (C) due to C3′• (see spectrum 3(F)) and 50% of spectrum (D) due to UCH2• as benchmarks.
The black spectrum in Figure 1(F) was obtained after subtraction of 20% spectrum E from spectrum D. The line positions (hyperfine splittings), lineshape, and the g value this spectrum in Figure 1(F) matched with the reported spectrum of the allylic radical C-CH2• (reaction 2) (Sevilla et al. 1972; Ohlmann and Hüttermann, 1993; Malone et al. 1995). This spectrum is therefore assigned to C-CH2• spectrum. Using ESR parameters (Axx, Axy, Ayy, and Azz (−19.3, −8.5, 14.3, 15.0) G, (−7.0, 0, 23.5, 15.3) G, (5.0, 0, 14.0, 10.0) G (Ohlmann and Hüttermann, 1993)) along with gxx, gyy, gzz (2.003, 2.003, 2.0024), linewidth (3.5, 3.5, 3.5) G and mixed Lorentzian/Gaussian = 1, the spectrum (gray) of C-CH2• was simulated (see Figure 1(F)). This simulated spectrum is superimposed on the experimentally obtained spectrum (black) of C-CH2• in Figure 1(F) and match closely. Using spectra (E) and the black spectrum in (F) as benchmarks of 5-Me-2'-dC•+ and C-CH2• respectively, analyses of spectra (B) to (D) were carried out. Our analyses show that the spectra (B), (C) and (D) result from both 5-Me-2'-dC•+ and C-CH2•. In spectrum (B) the percentage of 5-Me-2'-dC•+ and C-CH2• are ca. 70% and ca. 30% respectively; whereas in spectrum (C), the corresponding percentages are ca. 45% and ca. 55% and in spectrum (D) they are ca. 20% and ca. 80%. Thus, these analyses clearly shows that with thermal annealing, 5-Me-2'-dC•+ converts to C-CH2• by deprotonation from the methyl group (reaction (2)). The low temperature at which reaction (2) takes place suggests that this reaction has a small activation barrier.
Formation of the C3'• via excited state deprotonation of “pristine” 5-Me-2'-dC•+
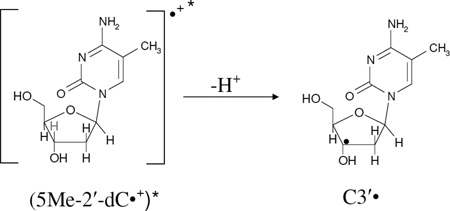
Previous ESR spectral studies carried out by our laboratory have established that the photoexcited purine cation radical in DNA model systems (nucleosides, nucleotides, single and double stranded oligomers), in RNA model systems (nucleosides, nucleotides, single stranded oligomers) and in highly polymerized DNA (salmon sperm) lead to formation of sugar radicals (Adhikary et al. 2005, 2008, 2010, 2012; Becker et al. 2007, 2010a, 2010b; Khanduri et al. 2011). Simultaneously, theoretical calculations employing time-dependent density functional theory (TD-DFT) (Kumar and Sevilla, 2006, 2008, 2009) supported these experimental results. On this basis, ESR results shown in Figure 2 provide evidence for C3'• formation via photoexcitation of “pristine” 5-Me-2'-dC•+. The sample was prepared identically to that used for the results presented in Figure 1. Here instead of extensive thermal annealing, photexcitation is employed to study the reactions of excited 5-Me-2'-dC•+ ((5-Me-2′-dC•+)*).
Figure 2.
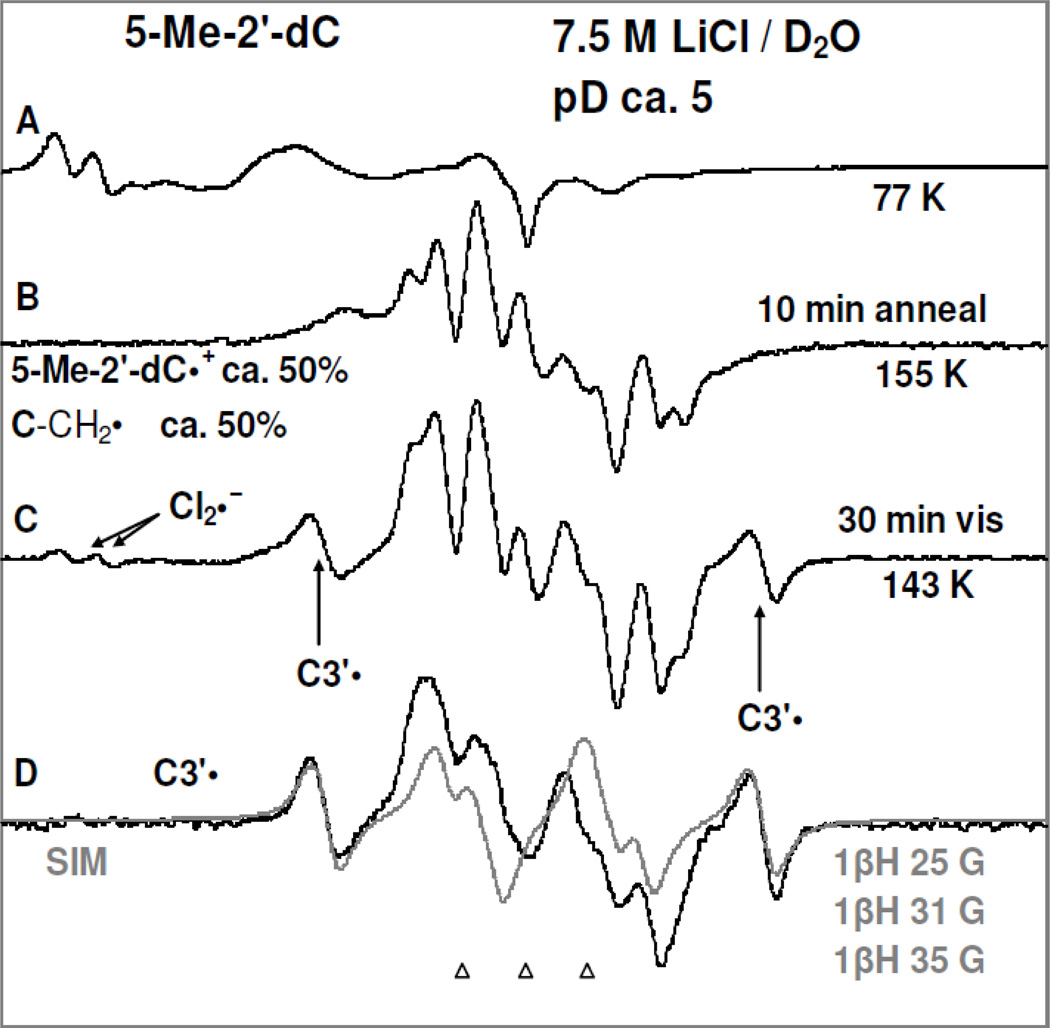
(A) ESR spectrum (black) of a γ-irradiated (1.4 kGy, 77 K) matched sample (for Figure 1) of 5-Me-2′-dC (2 mg/ml) in the presence of excess K2S2O8 at the native pD (ca. 5) in the homogeneous glassy solution of 7.5 M LiCl in D2O. (B) Spectrum (black) of the sample in (A) after annealing to ca. 155 K for 10 min. (C) Using photoflood lamp, photoexcitation of the sample in (B) at 143 K for 30 min. (D) The spectrum (black) obtained after subtraction of line components of Cl2•− and C-CH2• from spectrum C and is assigned to C3′•. The simulated (gray) C3′• spectrum obtained using three isotropic β-proton HFCC is superimposed on the black spectrum for comparison.
In Figure 2A, the 77 K ESR spectrum (black) of this γ-irradiated 5-Me-2'-dC sample is presented. Similarities of spectrum 2A with spectrum 1A clearly shows that spectrum 2A is due to Cl2•− and SO4•− as found in Figure 1A.
Annealing of this sample to 155 K for 10 min to allow for one electron oxidation of 5-Me-2'-dC by Cl2•− resulted in spectrum 2B. Employing spectrum 1(E) and the black spectrum in Figure 1(F) as benchmarks of 5-Me-2′-dC•+ and C-CH2• respectively, analyses of spectrum 2(B) show this spectrum is due to equal amounts (ca. 50%) of 5-Me-2′-dC•+ and C-CH2•.
Subsequent photoexcitation of the sample for 30 min at 143 K using photoflood lamp resulted in spectrum 2C. While the line components of C-CH2• remain unchanged in 2C from those in 2B, we find photoexcitation creates intense line components (indicated by arrows) clearly observed in the wings that are assigned to C3′• and small line components at low field from Cl2•− (vide infra).
The black spectrum in Figure 2D is obtained after subtraction of line components of Cl2•− and C-CH2• from spectrum 2C. We note here that after subtraction of line components of Cl2•− from spectrum 2C, the resultant spectrum was double integrated and then subtraction of ca. 50% of the C-C-CH2• spectrum from this spectrum resulted in the back spectrum in Figure 2D. This black spectrum shows that it results from three isotropic β-proton hyperfine couplings (total hyperfine splitting ca. 91 G). Our work (Adhikary et al. 2008; Becker et al. 2010a,b) have shown that the β-proton HFCC values for C3′• ranges from ca. 84 to ca. 91 G in different nucleosides and tides and with temperature (77 K vs. 143 K). The C3′• spectrum was simulated employing three isotropic HFCC (25.0, 31.0, 35.0) G, 6 G linewidth, and giso = 2.0032. The simulated (gray) spectrum matches the experimentally isolated C3′• spectrum (black) in Figure 2D very well.
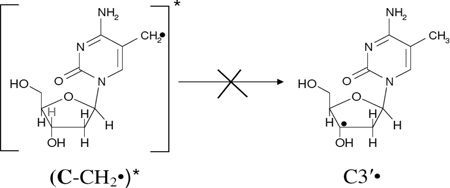
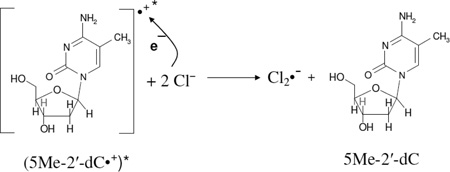
Since spectrum 2B is composed of equal amounts (ca. 50%) of 5-Me-2′-dC•+ and C-CH2• respectively and spectrum 2C contains ca. 50% of C-CH2•, 40% C3′•, and ca. 10% Cl2•−, it is evident that (5-Me-2′-dC•+)* leads to C3′• formation as well as a small amount of oxidation of Cl− in the medium. The formation of C3′• likely occurs via hole transfer from the base cation radical to the attached sugar moiety followed by deprotonation at C3′ within the lifetime of its excited state. This could be considered to be an excitation-induced hole transfer-coupled-deprotonation process. We note that the amount of C-CH2• in the radical cohort remains unchanged before (spectrum 2B) and after photoexcitation (spectrum 2C) and therefore does not lead to C3′• formation (reaction 4). Therefore, this is clear evidence that it is the excitation of a pyrimidine base cation radical (5-Me-2′-dC•+)*, that leads to C3′• formation (reaction 3). Previous work (Malone et al. 1995) had shown that the photoionization of 5-Me-2′-dC using a 248 nm laser at 77 K leads to the C3′• formation, but they did not observe the cation radical spectrum. Our work suggests that the 248 nm laser induced two photon photoionization likely created an excited cation radical (5-Me-2′-dC•+)* which underwent the excited state deprotonation reaction from C3′ (reaction 3). The site of the excited state deprotonation shown in reaction (3) and in subsequent reactions is indicated by a pale C3′-H bond.
Our earlier work (Khanduri et al. 2011) employing samples of 7.5 M LiCl/D2O at pDs ca. 3, 5, and 9 in the presence of K2S2O8 handled, γ-irradiated, annealed, and then photoexcited by 405 nm laser identical in the presence and in absence of DNA model systems has established the formation of additional matrix radical (Cl2•−) formation via one-electron oxidation of excited guanine cation radical ((G•+)*). Based on that work, it is concluded that Cl2•− formation observed in spectrum 2C is due to one-electron oxidation of Cl− in the matrix by (5-Me-2′-dC•+)* (reaction 5). The one-electron oxidation of Cl− by (5-Me-2′-dC•+)* occurs via hole transfer from (5-Me-2′-dC•+)* within the lifetime of its excited state.
 |
(3) |
 |
(4) |
 |
(5) |
Formation of the C3'• via deprotonation of (5-Me-2′-dC•+)* with pH
Employing identically prepared, handled, and γ-irradiated samples of 5-Me-2′-dC (2 mg/ml in 7.5 M LiCl/D2O at pD ca. 7 and ca. 9), C3′• formation from (5-Me-2′-dC•+)* was studied. These results are presented in the supplemental information Figures S2 (pD of the sample ca. 7) and S3 (sample pD ca. 9) respectively. Following our results shown in spectrum 2(B), each of these samples was annealed at 155 K for 10 min in the dark. Employing benchmarks of 5-Me-2′-dC•+ and C-CH2• (spectrum 1(E) and the black spectrum in Figure 1(F) respectively), analysis show that at pD ca. 7 the percentage compositions of 5-Me-2′-dC•+ and C-CH2• are ca. 25% and 75% respectively (spectrum S2(B)); whereas, the corresponding percentage compositions at pH 9 are ca. 10% and 90% respectively (spectrum S3(B)). Thus, with increasing pH/pD, the extent of 5-Me-2′-dC•+ decreases owing to increasing extent of deprotonation from the exocyclic methyl group of 5-Me-2′-dC•+ in its ground state (see reaction (2) and Figure 1).
Along with the results presented in Figure 2, photoexcitation of these samples using 405 nm laser at 143 K for 30 min (Figure S2(C)) or photoflood lamp at 143 K for 30 min (Figure S3(C)) provide direct evidence of the C3'• formation via deprotonation of (5-Me-2′-dC•+)* (reaction 3) at pH/pD ranging ca. 5 to ca. 9 along with small extent of Cl2•− formation (reaction (5)) as evidenced by its small line components at low field. Comparison of our results from pD ca. 5 to pD ca. 9 show that C3'• formation decreases as the extent of 5-Me-2′-dC•+ formation is reduced by thermal reaction to C-CH2• with increasing pD. C3'• formation is, therefore, crucially dependent on the amount of (5-Me-2′-dC•+)* and the latter is controlled by the extent of 5-Me-2′-dC•+ in the ground state.
Formation of the C3'• from one-electron oxidized thymine in its excited state in Thd and its nucleotides
According to our earlier studies (Adhikary et al. 2013a), in homogeneous glassy (7.5 M LiCl/D2O (or H2O)) solutions of Thd and in its nucleotides, Cl2•− results in one-electron oxidation of the thymine base moiety forming the N3-deprotonated thyminyl radical (T(−H)•) (structure of T(−H)• is shown in reaction (6)) at pH/pD ≥ ca. 9. Therefore, after providing evidence of C3'• formation via deprotonation of (5-Me-2′-dC•+)* (see reaction 3 and Figures 2, S2, and S3), we have investigated Thd and its various nucleotides (e.g., 5′-TMP, 5′-TDP, 5′-TTP, and 3′-TMP) to answer the following questions:
Does C3'• formation occur in Thd and in its nucleotides from excited T(−H)• ((T(−H)•)*)?
- If C3'• formation occurs via deprotonation of (T(−H)•)*, whether the extent of C3'• formation is affected by
- the site of phosphate substitution (3'- or 5'-), and
- the number of phosphates at the 5'-site (e.g., 5′-TMP, 5′-TDP, 5′-TTP).
The results are presented in Figures 3 to 5 below.
Figure 3.
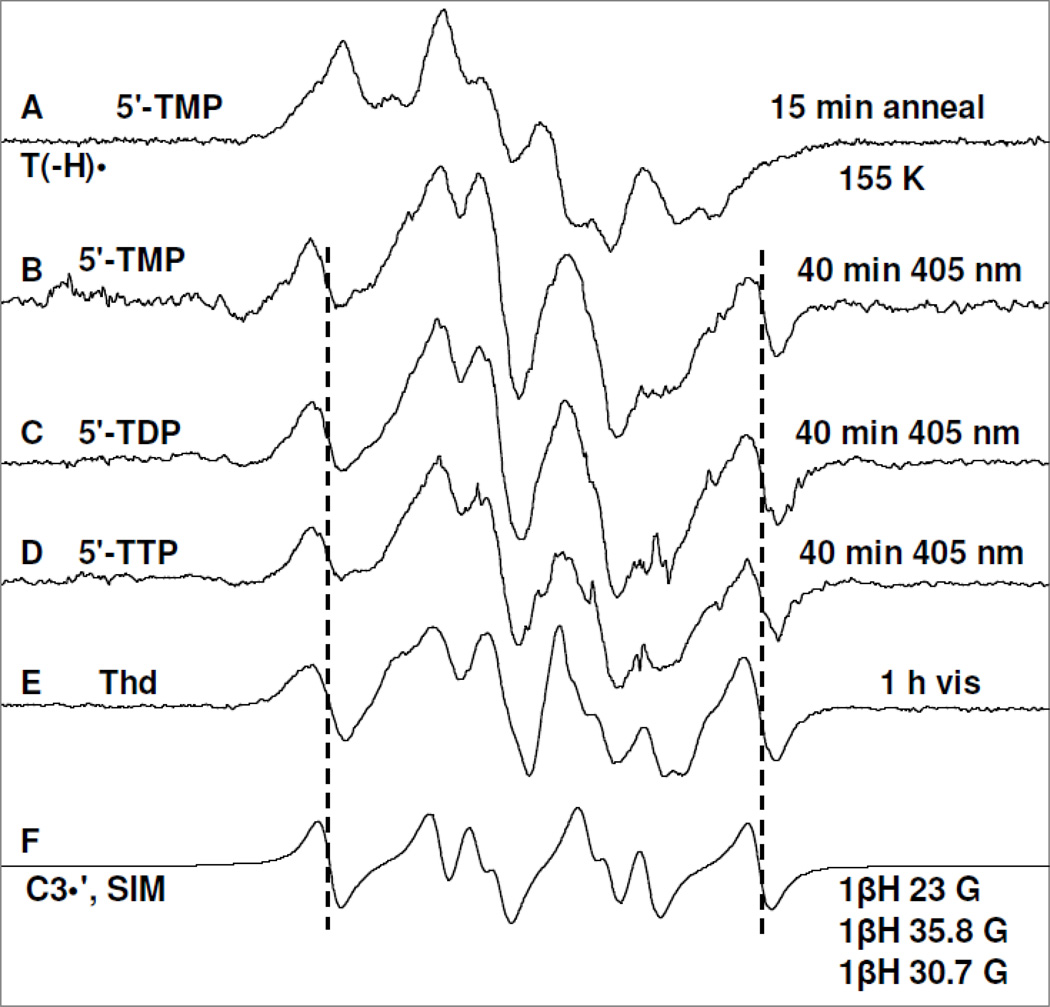
Spectrum (A) of T(−H)• produced via annealing at 155 K owing to one-electron oxidation of the N3-deprotonated thymine base in 5′-TMP (3 mg/ml) by Cl2•− in homogeneous aqueous glass (7.5 M LiCl/D2O) at pD ca. 10 in the presence of excess K2S2O8 ; (B) after photoexcitation of T(−H)• in 5′-TMP shown in (A) using 405 nm laser at 143 K for 40 min; (C) after photoexcitation of T(−H)• in a matched sample of 5′-TDP (3 mg/ml) using 405 nm laser at 143 K for 40 min; (D) after photoexcitation of T(−H)• -of T(−H)• in a matched sample of 5′-TTP (3 mg/ml) using 405 nm laser at 143 K for 40 min; (E) after visible illumination of T(−H)• formed in a similarly prepared sample of Thd (3 mg/ml) at pD ca. 11 at 143 K. (F) The simulated C3′• spectrum has been obtained using three isotropic β-proton HFCC (text). The line components of the C3′• spectrum is visible in spectra (B) to (E) as indicated by the dotted lines. Similar to the results found in Figure 2 and reaction (5), a small extent of Cl2•− (ca. 10%) formed via one-electron oxidation of the matrix (LiCl) by (T(−H)•)* has been subtracted from each of the experimentally recorded spectra and the subtracted spectra have been presented in Figures 3(B) to 3(E).
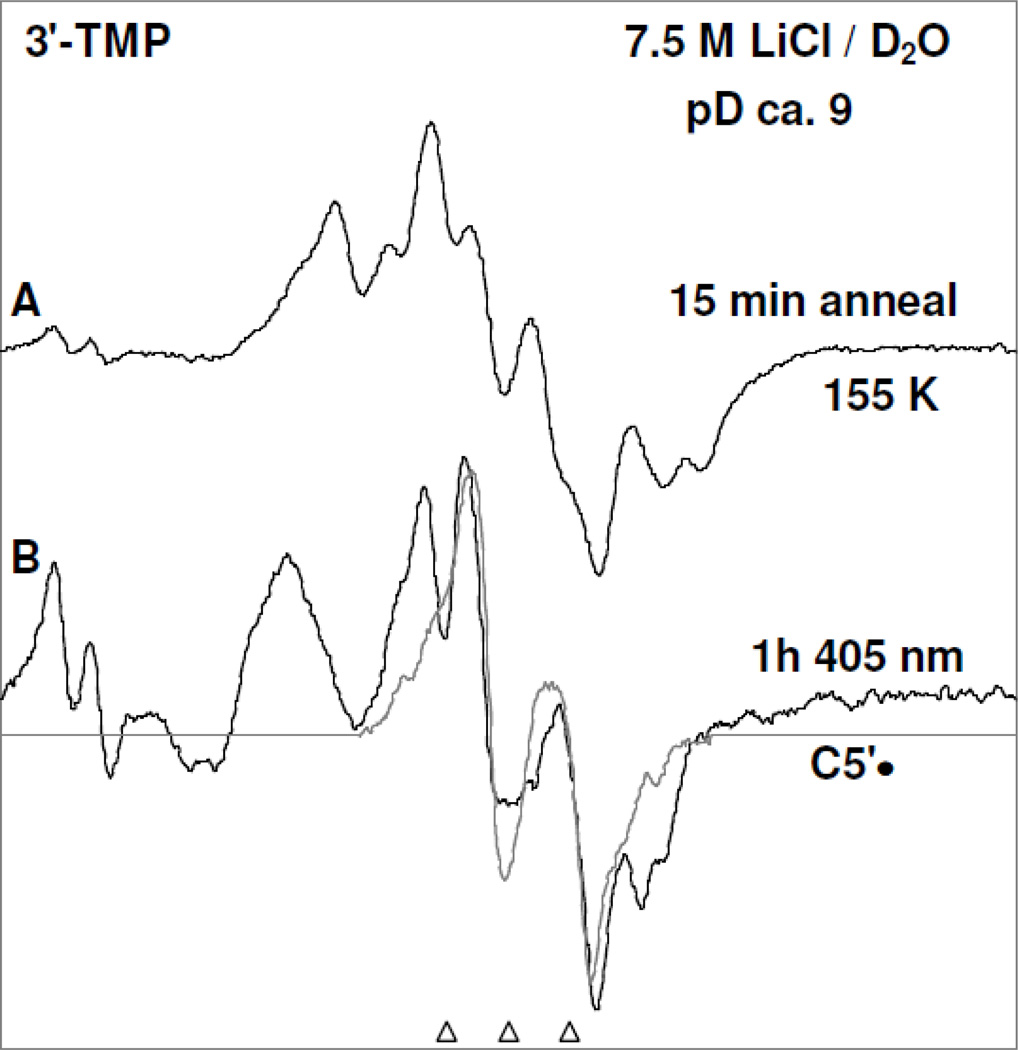
Figure 5.
Spectrum (A) of T(−H)• produced via annealing at 155 K owing to one-electron oxidation of the N3-deprotonated thymine base in 3′-TMP (3 mg/ml) by Cl2•− in homogeneous aqueous glass (7.5 M LiCl/D2O) at pD ca. 9 in the presence of excess K2S2O8. This spectrum also contains residual line components from Cl2•−. Spectrum (B) after photoexcitation of T(−H)• using 405 nm laser at 143 K for 1 h. showing photoproduction of C5′•, UCH2•, and Cl2•−. All the ESR spectra are recorded at 77 K.
Annealing of the 5′-TMP sample at pH ca. 10 at 155 K in the dark resulted in spectrum 3(A). Spectra from the matched samples 5′-TDP and 5′-TTP and also the spectrum from a similarly prepared sample of Thd at pH ca. 11 annealed under the same conditions have ESR characteristics (lineshape, center, and hyperfine structures) similar to those in spectrum 3A. Based on our recent assignment of T(−H)• employing 15N labeled 5′-TMP (Adhikary et al. 2013a), spectrum 3A is assigned to T(−H)•.
Employing 405 nm laser, photoexcitation of T(−H)• in 5′-TMP sample (spectrum 3(A)) at 143 K for 40 min resulted in spectrum 3(B). Photoexcitation of T(−H)• in matched samples of 5′-TDP and 5′-TTP under identical conditions has resulted in spectrum 3(C) (5′-TDP) and spectrum 3(D) (5′-TTP) respectively. Moreover, photoexcitation of T(−H)• in a similarly prepared Thd sample at pD ca. 11 using photoflood lamp at 143 K for 1 h also produced a very similar ESR spectrum (Spectrum 3(E)).
A small extent of Cl2•− (ca. 10%) is formed via one-electron oxidation of the matrix (LiCl) by (T(−H)•)* as found for (5-Me-2′-dC+•)*. This Cl2•− was subtracted from each of the experimentally recorded spectra and the subtracted spectra have been presented in Figures 3(B) to 3(E).
The simulated C3′• spectrum employing three isotropic HFCC (23.0, 30.7, 35.8) G, 5 G linwidth, and giso = 2.0032. This simulated C3′• spectrum matches the outer lines (indicated by the dotted lines) in the high field as well as in the low field regions of the experimentally recorded spectra 3(B) to 3(E) well. This establishes the formation of C3′• from excitation of T(−H)• in Thd, 5′-TMP, 5′-TDP, and in 5′-TTP (reaction 6). It is also evident from spectra 3(B) to 3(D) that the number of phosphate groups (mono-, di-, tri-) at the 5′-site does not affect C3′• formation from (T(−H)•)* in these compounds.
Employing the simulated C3′• spectrum (spectrum 3(F)) as well as the spectrum of the allylic radical (UCH2•) (Ohlmann and Hüttermann, 1993; Wang et al. 1997; Shkrob et al. 2011) formed by deprotonation from the methyl group at the C5-site in the thymine base of T(−H)• in Thd as benchmarks, analysis of spectrum 3(E) shows that this spectrum is due to approximately equal amounts (50% each) of C3′• and UCH2• (see Figure 4). Inspection of spectra 3(B) to 3(E) show that they all clearly result from varying amounts of C3′• (reaction 6) and UCH2• (reaction 7).
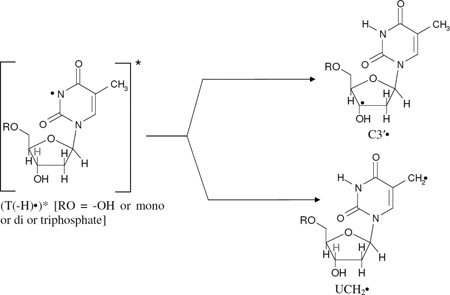 |
(6) (7) |
In Figure 5, the effect of photoexcitation of T(−H)• in a matched sample of 3′-TMP is presented. The spectrum shown in Figure 5A is due to T(−H)• and some small line components of remaining Cl2•− (compare with Figure 3A). The ESR spectrum obtained after 40 min of photoexcitation of T(−H)• in 3′-TMP using 405 nm laser at 143 K is presented in Figure 5(B). Spectrum 5(B) is clearly due to UCH2• and Cl2•− in substantial yields and C5′• in small abundances as the intensity of the central doublet in Figure 5(B) is not completely accounted by the line components of UCH2•. Thus, it is evident that (T(−H)•)* in 3′-TMP one electron oxidizes Cl− resulting in Cl2•− and also undergoes deprotonation from the C5′ site as well as from the exocyclic methyl group at C5 of its thymine base to produce UCH2• (reactions (9 and 9a)). However, the characteristic line components due to C3′• are not observed in spectrum 5(B) thereby establishing a complete suppression of C3′• formation from (T(−H)•)* in 3′-TMP (reaction (8)). This is expected because experimental (Adhikary et al., 2005, 2008) and theoretical works (Colson and Sevilla, 1995; Li et al. 2006) have shown that substitution of phosphate at a particular site leads to a significant higher C-H bond energy and deactivation of the radical formation at that site.
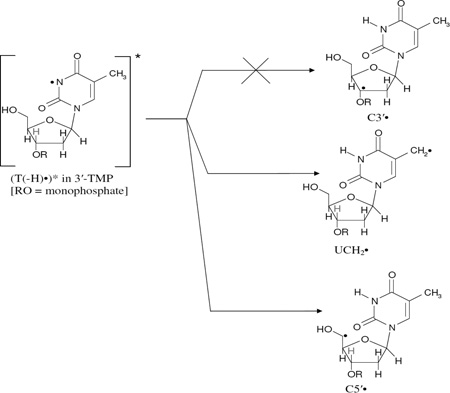 |
(8) (9) (9a) |
Formation of the C3'dephos• via excited state deprotonation of “pristine” 5-Me-2',3'-ddC•+
Owing to the presence of phosphate group at the 3′-site, complete suppression of C3′• formation from (T(−H)•)* in 3′-TMP has been observed (reaction (8), Figure 5). Therefore, if C-H bond energy is the dominant factor towards C3′• production, it is expected that formation of a radical site at C3′-atom due to (5-Me-2′,3′-ddC•+)* should not be observed. Hence, in Figure 6, ESR spectral results showing formation of 5-Me-2′,3′-ddC•+ via one-electron oxidation of 5-Me-2′,3′-ddC and its subsequent photoexcitation are presented.
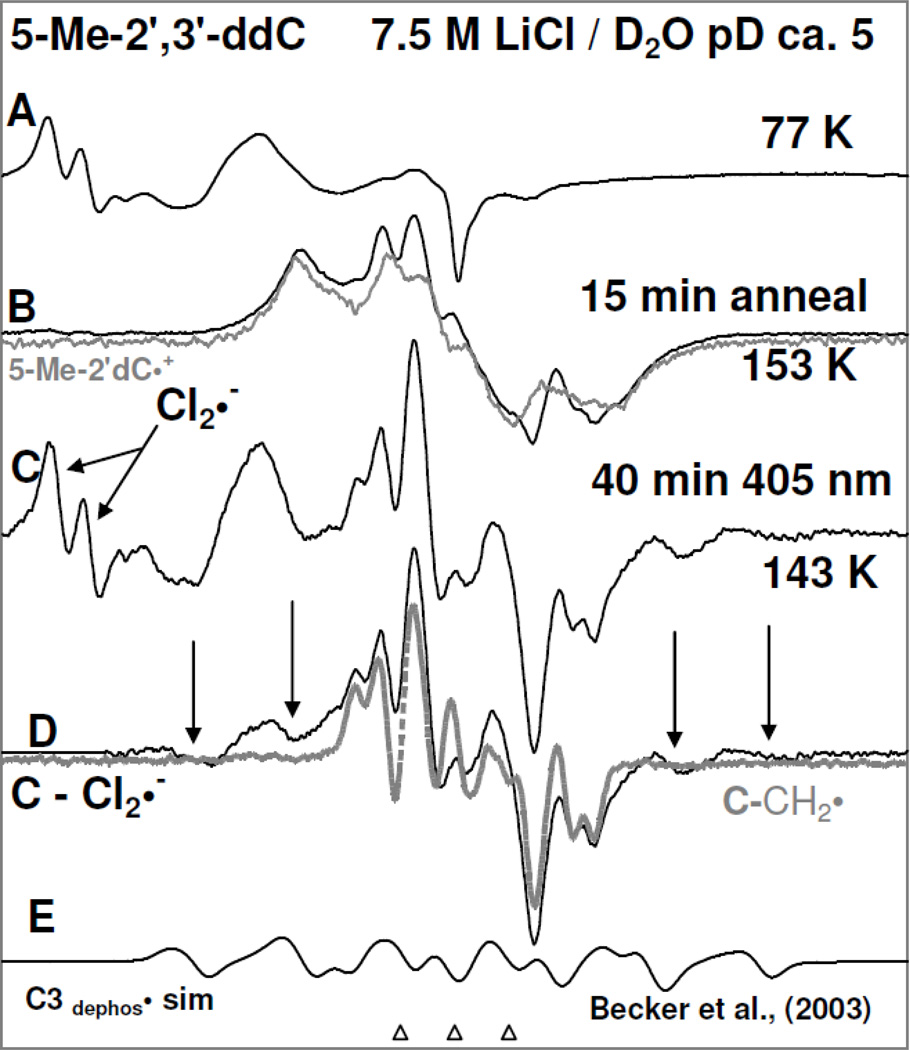
Figure 6.
(A) ESR spectrum of a γ-irradiated (1.4 kGy, 77 K) matched sample of 5-Me-2′,3′-ddC (2 mg/ml) in the presence of excess K2S2O8 at the native pD (ca. 5) in the homogeneous glassy solution of 7.5 M LiCl in D2O. (B) Spectrum (black) of the sample in (A) after annealing to ca. 153 K for 15 min in the dark. The spectrum of 5-Me-2′-dC•+ (spectrum 1(E) is superimposed on it for comparison). (C) Spectrum after photoexcitation of the sample in (B) using 405 nm laser at 143 K for 40 min. (D) Spectrum (black) obtained after subtraction of line components of Cl2•−. The outer line components due to C3′•dephos (reaction (11) are indicated by arrows. C-CH2• spectrum in gray (spectrum 1F) is superimposed on it. (E) The simulated C3′•dephos spectrum obtained using HFCC from Becker et al. 2003 (see text).
In Figure 6A, the ESR spectrum of the γ-irradiated 5-Me-2',3'-ddC sample recorded at 77 K is presented. Figure 6A shows Cl2•− and SO4•− which are the only major radical species expected (see Figure 1A).
Similar to reaction (1) and spectra 1(B) and 2(B), annealing of this sample to 153 K for 15 min to allow for one electron oxidation of 5-Me-2',3'-ddC by Cl2•− resulted in spectrum 6B (reaction (10)). ESR parameters of spectrum 6B (center of the spectrum, lineshape, and the hyperfine structure) match quite well with those of the 5-Me-2′-dC•+ spectrum (gray, see also spectrum 1(E)). Hence, spectrum 6(B) is assigned to 5-Me-2′,3′-ddC•+.
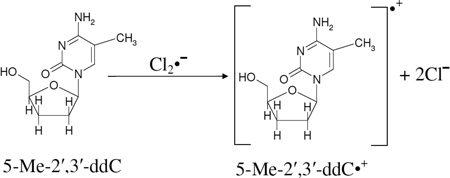 |
(10) |
Employing 405 nm laser, photoexcitation of the sample for 40 min at 143 K resulted in spectrum 6(C). Comparison of spectrum 6(C) with spectrum 2(C) and the gray spectrum of C5'• (spectrum 5(B)) clearly establishes that apart from line components at low field from Cl2•− as well as line components due to C-CH2•, and the central doublet due to C5'•, as the intensity of the central doublet in Figure 6(C) is not completely accounted by the line components of UCH2•. Most importantly, spectrum 6(C) has new line components at the wings. Subtraction of low field line components due to Cl2•− from spectrum 6(C) results in spectrum 6(D) in which the line components at wings become apparent (indicated by arrows). These line components are due to another radical with a substantial total width of 134 G. These lines components, g-value at the center, and total hyperfine splitting matches well with the spectrum assigned to C3'dephos• (Becker et al. 2003) – in which the radical site is at C3' with hyperfine couplings due to one α-H (H3') atom and three β-H (two H2' and one H4') atoms. Spectrum 6(E) is the simulated spectrum of C3'dephos• employing the ESR simulation parameters of Becker et al. 2003. Spectrum simulation is carried out to second order using α-H [−11 G, −23.4 G, −34 G], three β-H atoms (26.9 G (1H), 34.9 G (1H), and 49.1 G (1H)), g-values (gxx = 2.0036, gyy = 2.0023, gzz = 2.0044), line-width = 6 G. Therefore, we conclude that (5-Me-2′,3′-ddC•+)* undergoes deprotonation from the 5-Me group in the base as well as from C3′-site in the sugar moiety leading to the formation of C-CH2•, C3'dephos•, and C5'• (reaction scheme (11)).
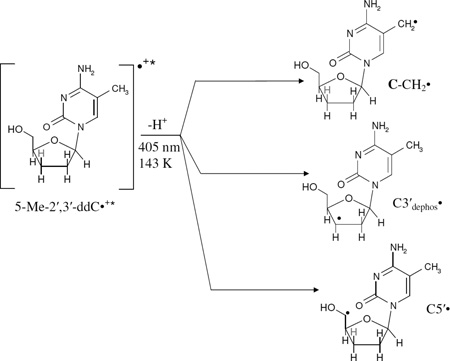 |
(11) |
We note here that line components due to formation of C3'dephos• have also been observed at the wings via photoexcitation of 2′,3′-ddAdo•+ and 2′,3′-dd T(−H)• (see supplemental information Figures S4 and S5).
As indicated in reaction (11), formation of C3'dephos• from (5-Me-2′,3′-ddC•+)* (or (2′,3′-ddAdo•+)* or (2′,3′-dd T(−H)•)*) clearly establishes that C-H bond energies in the sugar moiety of these excited species are obviously not the only factors dictating the type and the extent of sugar radical production. Formation of C3'dephos• from these excited radicals points to the relevance of spin and charge distribution on the sugar moiety in the excited cation radical.
Furthermore, we note here that formation of C3'dephos• has been reported to occur via dissociative electron attachment owing to the attack of low energy electron (LEE) at the DNA sugar phosphate C3'-O bond (Becker et al. 2003, 2007, 2010a, 2010b) and supported by product analyses in LEE (4 to 15 electron volt (eV))-induced damaged oligomers (Li et al. 2008). On the other hand, this work provides the first evidence of distinct line components owing to C3'dephos• production via excited one-electron oxidized base radicals. In fact, these line components of C3'dephos• production would help us to improve the analyses of the extent of LEE-induced damage in irradiated DNA.
Photoexcitation of one-electron oxidized dsDNA oligomers containing 5-Me-C
Close reports the theoretically calculated ionization potential (Ip) of 5-Me-C as 8.50 eV whereas the corresponding Ip value of C is 8.79 eV (Close, 2003). The lowering of Ip in 5-Me-C (0.29 eV) is attributed to the presence of the electron donating methyl group at C5 in the cytosine base. It has been also observed that rate of oxidation of a dsDNA-oligomer with G:5-Me-C base pair is higher than that of a dsDNA-oligomer with G:C base pair (Kawai et al. 2002). However, replacement of C by 5-Me-C in a dsDNA-oligomer in aqueous solution at room temperature does not affect the extent of hole (unpaired spin) trapping at G sites (Kanvah and Schuster, 2004). Furthermore, this group (Joseph and Schuster, 2012), has reported an increase in the extent of strand breaks at 5-Me-C/A or at 5-Me-C/T mismatches in photoexcited dsDNA-oligomers having GG sites relative to the dsDNA oligomers with no mismatch.
In the present work, we investigate the one-electron oxidation and subsequent photoexcitation of a fully dsDNA-oligomer d[GC*GC*GC*GC*]2 and a dsDNA-oligomer with 5-Me-C/A mismatch d[GGAC*AAGC:CCTAATCG] (C*=5-Me-C), in order to answer the following questions:
whether the lower Ip of 5-Me-C leads to formation of the 5-Me-C cation radical via one-electron oxidation of d[GC*GC*GC*GC*]2 and d[GGAC*AAGC:CCTAATCG].
whether, as expected from Figures 5 and 6, photoexcitation of one-electron oxidized d[GC*GC*GC*GC*]2 and d[GGAC*AAGC:CCTAATCG] leads to C-CH2• and C5'• production owing to reaction (9).
These results are presented in Figure 7.
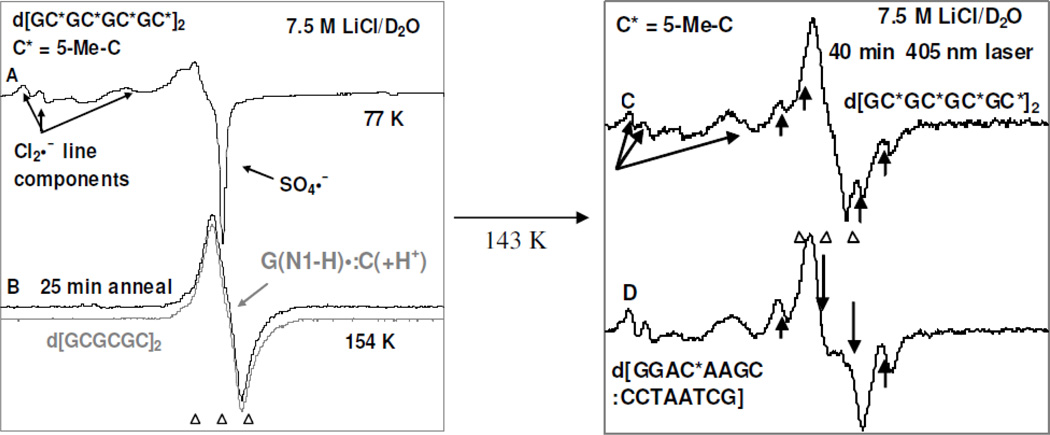
Figure 7.
Left panel: (A) ESR spectrum of a γ-irradiated (3 kGy, 77 K) sample of d[GC*GC*GC*GC*]2 (C* = 5-Me-C) (1.5 mg/ml) in the presence of electron scavenger K2S2O8 (8 mg/ml) at the native pD (ca. 5) in the homogeneous glassy solution of 7.5 M LiCl in D2O. (B) Spectrum (black) of the sample in (A) after annealing to ca. 154 K for 25 min in the dark. The reported ESR spectrum (gray) of intra-base pair proton transferred state of guanine cation radical (G(N1-H)•:C(+H+)) in d[GCGCGC]2 (Adhikary et al. 2009) is superimposed on it for comparison. Right panel: (C) spectrum of the sample in (B) after photoexcitation employing 405 nm laser for 40 min at 143 K. (D) spectrum obtained after photoexcitation employing 405 nm laser for 40 min at 143 K from a similarly prepared sample of one-electron oxidized d[GGAC*AAGC:CCTAATCG] (supplemental information Figure S6). The line components due to the formation of the C1´• via photoexcitation are indicated by up arrows. The down arrows indicate the C5´• which overwhelm the central peaks of the C1´•.
The ESR spectrum of the γ-irradiated dsDNA oligomer d[GC*GC*GC*GC*]2 (C* = 5-Me-C) sample recorded at 77 K showing the line components owing to Cl2•− and SO4•− is presented in Figure 7A. The spectrum in black in Figure 7(B) is obtained after one-electron oxidation of this sample by Cl2•− via annealing at 154 K in the dark. The total hyperfine splitting, g-value at the center (g⊥), and the lineshape of the already published (Adhikary et al. 2009, 2010; Khanduri et al. 2011) ESR spectrum (gray) of intra-base pair proton transferred state of guanine cation radical (G(N1-H)•:C(+H+)) in d[GCGCGC]2 recorded at 77 K at the native pD (ca. 5) in 7.5 M LiCl/D2O matches very well with this black spectrum in Figure 7(B) and no observable line components due to 5-Me-2′-dC•+ is found. Hence, the spectrum of one-electron oxidized d[GC*GC*GC*GC*]2 found at pD ca. 5 is assigned to (G(N1-H)•: 5-Me-C(+H+)) (reaction (12)). The spectrum from a similarly prepared sample of one-electron oxidized d[GGAC*AAGC:CCTAATCG] has been found to have the same hyperfine structure as in spectrum 7(B) (supplemental information Figure S6).
 |
(12) |
Therefore, spectrum 7(B) and the supplemental information Figure S6 clearly establish the site of one-electron oxidation (or localization of the hole (i.e. unpaired spin)) is on the G moiety and proton transfer places the charge is on the 5-Me-C moiety in (G(N1-H)•: 5-Me-C(+H+)) in fully dsDNA-oligomer. The reduction potential (E7) of G, is known to be lower than 5-Me-C so this is expected. The results from the solution phase hole trapping studies in dsDNA-oligomers containing G:5-Me-C (Kanvah and Schuster, 2004) based on the DNA cleavage methods at room temperature are in good agreement with results obtained from spectra 7(B) at low temperature. Thus, the lowering of Ip in 5-Me-C does not affect the hole localization on G in one-electron oxidized G:5-Me-C containing oligomers even in the presence of a 5-Me-C/A mismatch.
Employing 405 nm laser, photoexcitation of these dsDNA-oligomer samples for 40 min resulted in spectra 7(C) and 7(D) respectively. In spectrum 7(C), four new line components of nearly equal intensities due to C1´• appear along with the matrix radical (Cl2•−) after photoexcitation for 40 min in agreement with our works using fully dsDNA-oligomers (Khanduri et al. 2011). No observable line component due to C-CH2• are observed after the photoexcitation. On the other hand, in spectrum 7(D), the central doublet due to C5′• (compare gray spectrum in Figure 5(B)) and the line components of nearly equal intensities in the wings due to C1′• appear along with the matrix radical (Cl2•−).
These results and our previous study (Khanduri et al. 2011) suggest the mechanism of C1′• formation (reaction scheme 13) from excitation of G(N1-H)•: 5-Me-C(+H+) in DNA results in proton transfer (PT) from N3 atom of 5-Me-C to N1 atom of G with the hole leading to excited cation radical with the hole and charge partially on C1′ in the sugar (reaction scheme 13). Thus, in fully dsDNA-oligomer with 5-Me-C, the 5-Me-C moiety does not lead to C-CH2• formation in ground state or as expected from the results of photoexcitation in 5-Me-2′-dC, Thd, 5′-TMP, 5-Me-2′,3′-ddC, and in 3′-TMP we do find observable line components owing to C3′•, C-CH2• and C5′• production in the excited state. This excitation induced hole and charge transfer is followed by deprotonation from C1′ leading to the neutral sugar radical (C1′•). On the other hand, due to photoexcitation of one-electron oxidized d[GGAC*AAGC:CCTAATCG] having 5-Me-C/A mismatch (where the DNA is not fully double stranded), formation of C5′• is observed. C5′• is expected for non-base paired systems from our work in DNA model compounds and in ssDNA (Becker et al. 2010b, Khanduri et al. 2011). The deprotonation from C1′ or C5′ must occur within the lifetime of the excited state of the cation radical (Khanduri et al. 2011). Kohler Group (de La Harpe et al. 2009a, 2009b) has demonstrated such proton transfers in photoexcited dsDNA oligomers containing a G:C sequence. The simultaneous formation of Cl2•− is clear evidence for the oxidizing power of the excited state of the one-electron oxidized DNA whether as the fully ds oligomer or the ds oligomer with a mismatch.
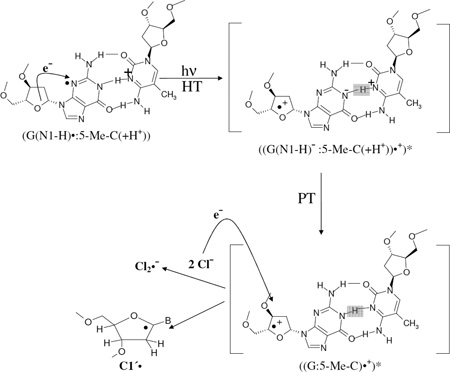 |
(13) |
TD-DFT calculations
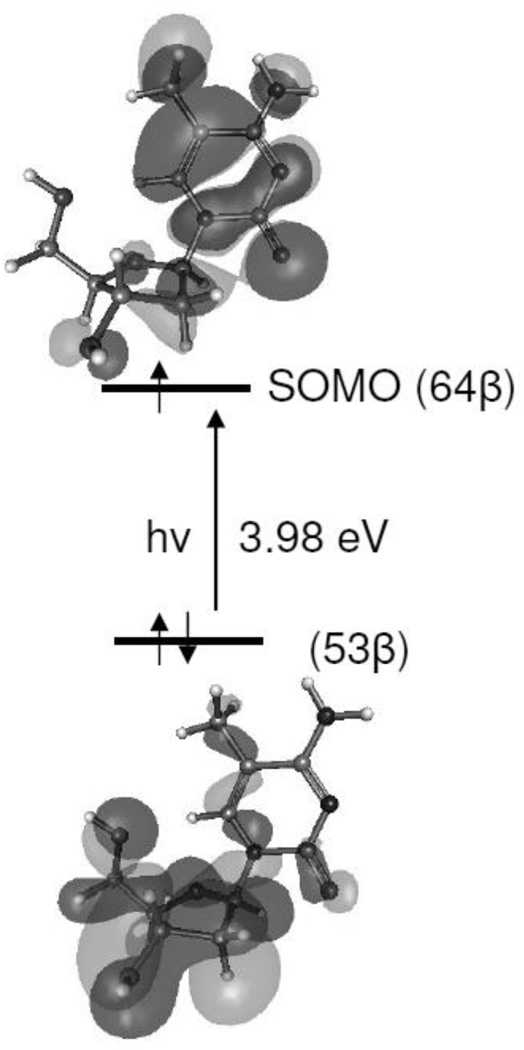
The mechanism of sugar radical formation in the excited state of 5-Me-2′dC•+ has been investigated following our previous works (Adhikary et al. 2005, 2008; Becker et al. 2007, 2010a,b; Kumar et al. 2008, 2009) and employing the TD-B3LYP/6–31G(d) method. The thirty lowest vertical excited states were calculated for 5-Me-2′dC•+. We find that there are several electronic transitions; as an example, we show in Figure 8, the 11th electronic transition that occurs from a doubly occupied inner core molecular orbital, such as 53β, localized on the sugar group to the singly occupied molecular orbital (SOMO), 64β on the 5-Me-C base. This transition is nπ* in nature. Although, the energy for this transition is 3.98 eV (312 nm) having oscillator strength is low as 0.0003, as shown in Figure 8, this transition supports our experimental finding that via photoexcitation, “hole” localized on the base moiety of the nucleoside in the ground state transfers to its 2′-deoxyribose moiety. The resulting 2′-deoxyribose excited state cation radical moiety becomes quite acidic and deprotonates from C3′-site to produce the neutral C3′•.
Figure 8.
TD-B3LYP/6–31G** calculated 11th transition showing the electronic transition originating from doubly occupied inner core molecular orbital (53β) localized on the sugar moiety to the half filled molecular orbital, SOMO, (64 β) localized on the cytosine base of the 5-Me-2′-dC•+.
Discussion
The results reported in this work allow us to state the following salient findings:
The 5-Me-2′-dC cation radical (5-Me-2′-dC•+) sites of deprotonation differ in the ground and excited states
Annealing of 5-Me-2′-dC•+ at 155 K (Figure 1) leads to only C-CH2• production. On the other hand, photoexcitation of the “pristine” 5-Me-2′-dC•+ identified in this work (Figure 1, supplemental information Figure S1) produces the excited cation radical ((5-Me-2′-dC•+)*) - which leads to only C3′• formation (Figure 2). Thus, our results distinctly differentiate the ground state deprotonation of 5-Me-2′-dC•+ from methyl group at C5 in the cytosine base moiety and the excited state deprotonation of (5-Me-2′-dC•+)* at the C3′-site of the sugar moiety. Our work suggests that earlier work (Malone et al 1995) using 248 nm laser photoionization at 77 K likely created an excited cation radical (5-Me-2′-dC•+)* which underwent the deprotonation reaction from C3′ as found here (reaction 3).
The sites of deprotonation in the sugar moiety of the excited purine and pyrimidine cation radicals
Photoexcitation of the guanine cation radicals in DNA and RNA nucleosides leads to production of C5′• (ca. 55 %), C3′• (ca. 30%) and C1′• (ca. 10%). Photoexcitation of adenine cation radicals in DNA and RNA nucleosides leads to formation of C5′• (ca. 80 to 85%) along with small amount of C3′• (ca. 15 to 20%) (Adhikary et al. 2005, 2008; Becker et al., 2007, 2010a, 2010b). The results shown in Figures 2 to 4 represent that photoexcitation of 5-Me-2′-dC•+ and of T(−H)• in Thd lead to only C3′• formation. Thus, the identity and extent of various types of sugar radicals (e.g., C1′•, C3′•, and C5′•) produced via excited purine (guanine and adenine) (Adhikary et al. 2005, 2008; Becker et al., 2007, 2010a, 2010b) and via pyrimidine (5-Me-2′-dC•+ and of T(−H)• in Thd) cation radicals (this work) differ. Taking these results as well as the TD-DFT calculations into account (Adhikary et al. 2005, 2008; Becker et al. 2007, 2010a,b; Kumar et al. 2008, 2009) and the results shown in Figure 8, it is suggested that the sites of high localization of spin and charge on the sugar moiety differ for excited purine and pyrimidine cation radicals and the sites of high spin and charge are those that lead to deprotonation and neutral radical formation.
Sugar radical formation via the excited base cation radical is not thermodynamically controlled
C3'dephos• production from (5-Me-2′,3′-ddC•+)* (Figure 6) (or (2′,3′-ddAdo•+)* or (2′,3′-dd T(−H)•)* (Figures S4 and S5)) provides the direct evidence for the localization of spin and charge at C3' in the sugar moiety in these excited cation radicals. Subsequent deprotonation from the C3' site of these excited cation radicals leads to the formation of C3'dephos• even though the C3′ site has a H-atom instead of the –OH group. The C-H bond energy increases on substitution of a H for a OH at the C3' site so that it is larger than C1' or C5' sites and thus shows the bond energy is not the dominant factor in the process of C3'dephos• formation.
Our work has already established that the type and extent of a particular sugar radical formation in the sugar radical cohort formed via excited purine cation radicals in DNA and RNA-model systems (nucleotides and ss and ds oligomers) are influenced by various factors – e.g., sites of phosphate substitution, temperature of the solution, protonation state of the cation radical, and length as well as strandedness (ss vs. ds) of the oligomer (Becker et al. 2010b; Khanduri et al. 2011). These studies and our current work, along with the TD-DFT calculations (Kumar et al. 2008, 2009) point out that the site of deprotonation leading to sugar radical formation in the transient excited cation radical is governed by the localization of spin and charge at that site of the sugar moiety and must occur within the lifetime of the excited cation radicals. Thus, we can conclude that the neutral sugar radical production via excited cation radical is a kinetically controlled process in which the thermodynamics of the bond strength at a particular site is secondary.
Photoexcitation of one electron oxidized mismatched dsDNA oligos lead to C5′• at the mismatched site
One-electron oxidation of d[GC*GC*GC*GC*]2 and of d[GGAC*AAGC:CCTAATCG] with a 5-Me-C/A mismatch clearly show that only (G(N1-H)•: 5-Me-C(+H+)) in the first oligo and (G(N1-H)•: C(+H+)) in the second are formed in the low temperature region (77 to 155 K). The 5-Me-C/A mismatch does not affect hole localization on G. However, excitation of these one-electron oxidized DNA-oligomers shows that different sugar radicals are formed. Excited one-electron oxidized fully dsDNA-oligomer d[GC*GC*GC*GC*]2 resulted in only C1′• production. However, in case of excited one-electron oxidized mismatched dsDNA, a considerable amount of C5′• along with some C1′• formation have been observed in our work. Based upon our results showing C5′• formation via excitation of one-electron oxidized ssDNA-oligomers (Becker et al. 2010b; Khanduri et al. 2011), we conclude that this C5′• formation observed here for the excited one-electron oxidized mismatched dsDNA originates from the mismatched region. C5′• is a precursor radical to frank strand break formation and thus we expect a strand break in the mismatched region. The work by Joseph et al. (Joseph and Schuster, 2012) regarding photolysis of oligomers with and without 5-Me-C mismatches in aqueous solutions in the presence of oxygen has found the mismatched region of the oligomer to be a “hotspot” for strand break formation upon hot piperidine treatment. Joseph et al. (Joseph and Schuster, 2012) suggest the formation of 5-Me-C oxidation products as the strand break precursor whereas in our work the C5′• acts as the strand break precursor. Considering the differences in experimental conditions, both mechanisms may, in fact, take place.
In summary we find that:
C-CH2• formation from 5-Me-2′-dC•+ occurs via ground state deprotonation from C5-methyl group on the base. In the excited 5-Me-2′-dC•+ and 5-Me-2′,3′-ddC•+, spin and charge localization at C3′ followed by deprotonation leads to C3′• formation.
The neutral sugar radical production via excited base cation radical is a kinetically controlled process.
Our work, in conjunction with by Joseph et al. (Joseph and Schuster, 2012) on photolysis of oligomers with 5-Me-C, proposes that presence of a (5-Me-C/A) mismatch in one-electron oxidized ds oligomer provide an explanation for the 5-Me-C sites as “mutational hot spots” in DNA under photolysis.
Supplementary Material
Acknowledgment
This work was supported by the NIH NCI Grant (Grant no. R01CA045424).
Footnotes
Declaration of interest: The authors report no conflicts of interest. The authors alone are responsible for the content and writing of the paper.
References
- Adhikary A, Khanduri D, Kumar A, Sevilla MD. Photo-excitation of adenine cation radical [A•+] in the near UV-vis region produces sugar radicals in Adenosine and in its nucleotides. Journal of Physical Chemistry B. 2008;112:15844–15855. doi: 10.1021/jp808139e. [DOI] [PMC free article] [PubMed] [Google Scholar]
- Adhikary A, Khanduri D, Sevilla MD. Direct observation of the protonation state and hole localization site in DNA-oligomers. Journal of the American Chemical Society. 2009;131:8614–8619. doi: 10.1021/ja9014869. [DOI] [PMC free article] [PubMed] [Google Scholar]
- Adhikary A, Kumar A, Becker D, Sevilla MD. Theory and ESR spectral studies of DNA-radicals. In: Chatgilialoglu C, Struder A, editors. Encyclopedia of Radicals in Chemistry, Biology and Materials. Chichester, UK: John Wiley & Sons Ltd.; 2012. pp. 1371–1396. [Google Scholar]
- Adhikary A, Kumar A, Becker D, Sevilla MD. The Guanine Cation Radical: Investigation of Deprotonation States by ESR and DFT. Journal of Physical Chemistry B. 2006;110:24171–24180. doi: 10.1021/jp064361y. [DOI] [PMC free article] [PubMed] [Google Scholar]
- Adhikary A, Kumar A, Heizer AN, Palmer BJ, Pottiboyina V, Liang Y, Wnuk SF, Sevilla MD. Hydroxyl ion addition to one-electron oxidized thymine: Unimolecular interconversion of C5 to C6 OH-adducts. Journal of the American Chemical Society. 2013b;135:3121–3135. doi: 10.1021/ja310650n. [DOI] [PMC free article] [PubMed] [Google Scholar]
- Adhikary A, Kumar A, Munafo SA, Khanduri D, Sevilla MD. Prototropic Equilibria in DNA Containing One-electron Oxidized GC: Intra-duplex vs. Duplex to Solvent Deprotonation. Physical Chemistry Chemical Physics. 2010;12:5353–5368. doi: 10.1039/b925496j. [DOI] [PMC free article] [PubMed] [Google Scholar]
- Adhikary A, Kumar A, Palmer BJ, Todd AD, Sevilla MD. Formation of S-Cl phosphorothioate adduct radicals in dsDNA-S-oligomers: Hole transfer to guanine vs. disulfide anion radical formation. Journal of the American Chemical Society. 2013a;135:12827–12838. doi: 10.1021/ja406121x. [DOI] [PMC free article] [PubMed] [Google Scholar]
- Adhikary A, Malkhasian AYS, Collins S, Koppen J, Becker D, Sevilla MD. UVA-visible photo-excitation of guanine radical cations produces sugar radicals in DNA and model structures. Nucleic Acids Research. 2005;33:5553–5564. doi: 10.1093/nar/gki857. [DOI] [PMC free article] [PubMed] [Google Scholar]
- Becker D, Adhikary A, Sevilla MD. The Role of Charge and Spin Migration in DNA Radiation Damage. In: Chakraborty T, editor. Charge Migration in DNA. Berlin: Heidelberg: Springer-Verlag; 2007. pp. 139–175. [Google Scholar]
- Becker D, Adhikary A, Sevilla MD. Mechanism of Radiation Induced DNA Damage: Direct Effects. In: Rao BSM, Wishart J, editors. Recent Trends in Radiation Chemistry. Singapore, New Jersey, London: World Scientific Publishing Co.; 2010a. pp. 509–542. [Google Scholar]
- Becker D, Adhikary A, Sevilla MD. Physicochemical mechanisms of radiation induced DNA damage. In: Hatano Y, Katsumura Y, Mozumder A, editors. Charged Particle and Photon Interactions with Matter - Recent Advances, Applications, and Interfaces. Boca Raton, London, New York: CRC Press, Taylor & Francis; 2010b. pp. 503–541. [Google Scholar]
- Becker D, Bryant-Friedrich A, Trzasko C, Sevilla MD. Electron spin resonance study of DNA irradiated with an argon-ion beam: evidence for formation of sugar phosphate backbone radicals. Radiation Research. 2003;160:174–185. doi: 10.1667/rr3037. [DOI] [PubMed] [Google Scholar]
- Black PJ, Bernhard WA. EPR Detection of an Electron Scavenging Contaminant in Irradiated Deoxyoligonucleotides: One-Electron Reduced Benzoyl. Journal of Physical Chemistry B. 2011;115:8009–8013. doi: 10.1021/jp202280g. [DOI] [PMC free article] [PubMed] [Google Scholar]
- Clark SJ, Harrison J, Paul CL, Frommer M. High sensitivity mapping of methylated cytosines. Nucleic Acids Research. 1994;22:2990–2297. doi: 10.1093/nar/22.15.2990. [DOI] [PMC free article] [PubMed] [Google Scholar]
- Close DM. Oxidative Damage to Cytosine: Implication for the Study of Radiation-Induced Damage to DNA. Journal of Physical Chemistry B. 2003;107:864–867. [Google Scholar]
- Colson A-O, Sevilla MD. Structure and relative stability of deoxyribose radicals in a model DNA backbone: ab initio molecular orbital calculations. Journal of Physical Chemistry. 1995;99:3867–3874. [Google Scholar]
- de La Harpe K, Crespo-Hernández CE, Kohler B. The excited-state lifetimes in a G × C DNA duplex are nearly independent of helix conformation and base-pairing motif. Chem Phys Chem. 2009a;10:1421–1425. doi: 10.1002/cphc.200900004. [DOI] [PMC free article] [PubMed] [Google Scholar]
- de La Harpe K, Crespo-Hernández CE, Kohler B. Deuterium isotope effect on excited-state dynamics in an alternating GC oligonucleotide. Journal of the American Chemical Society. 2009b;131:17557–17559. doi: 10.1021/ja9076364. [DOI] [PMC free article] [PubMed] [Google Scholar]
- Frisch MJ, et al. Gaussian 09. Wallingford, CT: Gaussian, Inc.; 2009. [Google Scholar]
- Hissung A, von Sonntag C. The reaction of solvated electrons with cytosine, 5-methyl cytosine and 2'-deoxycytidine in squeous solution. The reaction of the electron adduct intermediates with water, p-nitroacetophenone and oxygen. A pulse spectroscopic and pulse conductometric study. International Journal of Radiation Biology. 1979;35:449–458. [PubMed] [Google Scholar]
- IQmol, Free open-source molecular editor and visualization package. available at http://www.iqmol.org. [Google Scholar]
- Joseph J, Schuster GB. Oxidatively generated damage to DNA at 5-methylcytosine mispairs. Photochemical & Photobiological Sciences. 2012;11:998–1003. doi: 10.1039/c2pp05379a. [DOI] [PubMed] [Google Scholar]
- Kanvah S, Schuster GB. One-electron oxidation of DNA: The effect of replacement of cytosine with 5-methylcytosine on long-distance radical cation transport and reaction. Journal of the American Chemical Society. 2004;126:7341–7344. doi: 10.1021/ja049468i. [DOI] [PubMed] [Google Scholar]
- Kawai K, Osakada Y, Majima T. Importance of protonation state of guanine radical cation during hole transfer in DNA. Chemphyschem. 2009;10:1766–1769. doi: 10.1002/cphc.200900148. [DOI] [PubMed] [Google Scholar]
- Kawai K, Wata Y, Hara M, Tojo S, Majima T. Regulation of One-Electron Oxidation Rate of Guanine by Base Pairing with Cytosine Derivatives. Journal of the American Chemical Society. 2002;124:3586–3590. doi: 10.1021/ja016530s. [DOI] [PubMed] [Google Scholar]
- Khanduri D, Adhikary A, Sevilla MD. Highly Oxidizing Excited States of One-Electron Oxidized Guanine in DNA: Wavelength and pH Dependence. Journal of the American Chemical Society. 2011;133:4527–4537. doi: 10.1021/ja110499a. [DOI] [PMC free article] [PubMed] [Google Scholar]
- Krivokapić A, Øhman KT, Munthe M, Nelson WH, Hole EO, Sagstuen E. Radicals in 5-methylcytosine induced by ionizing radiation. Electron magnetic resonance for structural and mechanistic analyses. Radiation Research. 2010;173:689–702. doi: 10.1667/RR2026.1. [DOI] [PubMed] [Google Scholar]
- Krivokapić A, Øhman KT, Nelson WH, Hole EO, Sagstuen E. Primary oxidation products of 5-methylcytosine: methyl dynamics and environmental influences. Journal of Physical Chemistry A. 2009;113:9633–9640. doi: 10.1021/jp904747j. [DOI] [PubMed] [Google Scholar]
- Kumar A, Sevilla MD. Photoexcitation of Dinucleoside Radical Cations: A Time-Dependent Density Functional Study. Journal of Physical Chemistry B. 2006;110:24181–24188. doi: 10.1021/jp064524i. [DOI] [PMC free article] [PubMed] [Google Scholar]
- Kumar A, Sevilla MD. Radiation effects on DNA: Theoretical investigations of electron, hole and excitation pathways to DNA damage. In: Shukla MK, Leszczynski J, editors. Radiation Induced Molecular Phenomena in Nucleic Acid: A Comprehensive Theoretical and Experimental Analysis. Berlin: Heidelberg: Springer-Verlag; 2008. pp. 577–617. [Google Scholar]
- Kumar A, Sevilla MD. The Role of πσ* Excited States in Electron-Induced DNA Strand Break Formation: A Time-Dependent Density Functional Theory Study. Journal of the American Chemical Society. 2008;130:2130–2131. doi: 10.1021/ja077331x. [DOI] [PubMed] [Google Scholar]
- Kumar A, Sevilla MD. Theoretical modeling of radiation-induced DNA damage. In: Greenberg MM, editor. Radical and radical ion activity in nucleic acid chemistry. New Jersey: John Wiley & Sons, Inc.; 2009. pp. 1–40. [Google Scholar]
- Li M-J, Liu L, Wei K, Yao F, Guo Q-X. Significant Effects of Phosphorylation on Relative Stabilities of DNA and RNA Sugar Radicals: Remarkably High Susceptibility of H-2' Abstraction in RNA. Journal of Physical Chemistry B. 2006;110:13582–13589. doi: 10.1021/jp060331j. [DOI] [PubMed] [Google Scholar]
- Li Z, Zheng Y, Cloutier P, Sanche L, Wagner JR. Low energy electron induced DNA damage: effects of terminal phosphate and base moieties on the distribution of damage. Journal of the American Chemical Society. 2008;130:5612–5613. doi: 10.1021/ja077601b. [DOI] [PubMed] [Google Scholar]
- Malone ME, Cullis PM, Symons MCR, Parker AW. Biphotonic Photoionization of Cytosine and Its Derivatives with UV Radiation at 248 nm: An EPR Study in Low-Temperature Perchlorate Glasses. Journal of Physical Chemistry. 1995;99:9299–9308. [Google Scholar]
- Ohlmann J, Hüttermann J. Reactions of water radiolysis intermediates with pyrimidine and purine bases in aqueous BeF2 glasses: an EPR study. International Journal of Radiation Biology. 1993;63:427–436. doi: 10.1080/09553009314550581. [DOI] [PubMed] [Google Scholar]
- Raiti MJ, Sevilla MD. Density Functional Theory Investigation of the Electronic Structure and Spin Density Distribution in Peroxyl Radicals. Journal of Physical Chemistry A. 1999;103:1619–1626. [Google Scholar]
- Sevilla MD, Van Paemel C, Nichols C. An electron spin resonance study of several DNA basecation radicals produced by photoionization. Journal of Physical Chemistry. 1972;76:3571–3577. doi: 10.1021/j100668a012. [DOI] [PubMed] [Google Scholar]
- Shkrob IA, Marin TW, Adhikary A, Sevilla MD. Photooxidation of nucleic acids on metal oxides: physico-chemical and astrobiological perspectives. Journal of Physical Chemistry C. 2011;115:3393–3403. doi: 10.1021/jp110682c. [DOI] [PMC free article] [PubMed] [Google Scholar]
- Wang W, Razskazovskii Y, Sevilla MD. Secondary radical attack on DNA nucleotides: reaction by addition to DNA bases and abstraction from sugars. International Journal of Radiation Biology. 1997;71:387–399. doi: 10.1080/095530097144003. [DOI] [PubMed] [Google Scholar]
- Zhang Q, Wang Y. Independent generation of 5-(2'-deoxycytidinyl)methyl radical and the formation of a novel cross-link lesion between 5-methylcytosine and guanine. Journal of the American Chemical Society. 2003;125:12795–12802. doi: 10.1021/ja034866r. [DOI] [PubMed] [Google Scholar]
- Zuo S, Boorstein RJ, Teebor GW. Oxidative damage to 5-methylcytosine in DNA. Nucleic Acids Research. 1995;23:3239–3243. doi: 10.1093/nar/23.16.3239. [DOI] [PMC free article] [PubMed] [Google Scholar]
Associated Data
This section collects any data citations, data availability statements, or supplementary materials included in this article.


