

Abstract
Diffusion spectrum imaging (DSI) is a generalization of diffusion tensor imaging to map fibrous structure of white matter and potentially very sensitive to alterations of the cingulum bundles in dementia. In this in-vivo 4T study, DSI parameters especially spatial resolution and diffusion encoding bandwidth were optimized on humans to segment the cingulum bundles for tract level measurements of diffusion. The careful tailoring of the DSI acquisitions in conjunction with fiber tracking provided an optimal DSI setting for a reliable quantification of the cingulum bundle tracts. The optimization of tracking the cingulum bundle was verified using fiber tract quantifications, including coefficients of variability of DSI measurements along the fibers between and within healthy subjects in back-to-back studies and variogram analysis of spatial correlations between diffusion orientation distribution functions (ODF) along the cingulum bundle tracts. The results demonstrate identification of the cingulum bundle in human brain is reproducible using an optimized DSI parameter for maximum b-value and high spatial resolution of the DSI acquisition with a feasible acquisition time of whole brain in clinical practice. This optimized DSI setting should be useful for detecting alterations along the cingulum bundle in Alzheimer disease and related neurodegenerative disorders.
Keywords: MR diffusion, Diffusion spectrum imaging, optimization, cingulum bundle, Alzheimer
Introduction
The cingulum bundle is the most prominent white matter (WM) fiber tract in the limbic system, a set of brain structures that include the hippocampus, amygdala, and thalamus that support a variety of cognitive functions (1). It consists of three major fiber components, originating from thalamus, cingulate gyrus, and cortical association areas (1, 2). Since integrity of the cingulum bundle is central to memory, executive and emotional processing, it plays a crucial role in several neurologic conditions, including Alzheimer’s disease (AD) (3), schizophrenia (4, 5), depression (6, 7) and posttraumatic stress disorder (PTSD) (8–10).
Diffusion tensor imaging (DTI) is a MRI technique that measures the directional variability of random water motion. DTI can delineate WM structures based on the orientation information of axons (11–15) and there is considerable evidence that DTI also reflects the ultrastructural integrity of WM (13, 14). DTI studies reported abnormalities of the cingulum bundle in a variety of neurological conditions, most prominently in AD and mild cognitive impairment, a potentially pre-clinical condition of AD (16). More recently, DTI studies reported alterations along the cingulum bundle also in psychiatric conditions, including schizophrenia (17–21) and PTSD. Together, these findings raise the possibility that diffusion measurements in the cingulum bundle could be useful for improved diagnosis, prognosis and assessment of treatment responses for these conditions. However, a fundamental limitation is that DTI is based on Gaussian parameterization of diffusion, which ignores diffusion heterogeneity within an image voxel. This limitation can lead to ambiguous results, especially in the presence of crossing and touching fiber bundles in a voxel, consequently diminishing the diagnostic value of DTI.
Several methods have been developed to overcome the limitations of DTI. High angular resolution diffusion imaging (HARDI) (22) and q-ball imaging (23), for example, gain information by sampling the directional spread of the signal more densely in the reciprocal diffusion space (i.e. q-space). However, HARDI and q-ball imaging still require the parameterization of the diffusion probability (24, 25). Diffusion spectrum imaging (DSI) provides a further generalization by also sampling the probability distribution of the signal in reciprocal diffusion space, thus avoiding the need to parameterize the diffusion probability. The ability of DSI to resolve crossing and touching fibers is well documented (21, 24–29). In particular, DSI studies have demonstrated superior visualization of the cingulum bundle in monkeys (30) and humans (26). Thus, DSI has great potential for providing more sensitive and unambiguous measures of the integrity of the cingulum bundle than DTI (24, 31).
Despite these advantages of DSI an important issue facing its use is that the clinical applications can be very sensitive to the scan parameters. The overall aim of this study was to develop an optimal DSI protocol for robust measurements of the cingulum bundle within a clinically practical scan time. Specifically, since shortening of the scan time inevitably results in some reduction of sensitivity, our first aim was to find the best trade-off between high spatial resolution (which determines fiber localization) and high diffusion encoding bandwidth (which determines fiber resolution) per unit scan time. The higher order statistics was used to measure the spatial correlation of orientation distribution function (ODF) of spin displacement in a voxel-by-voxel analysis along the cingulum bundle. The second aim was to determine the reproducibility in mapping the cingulum bundle using the optimized DSI setting.
Materials and Methods
General strategy for optimization
Our goal was to precisely map the cingulum bundle by DSI with a scan time of less than 13 minutes. The time limit basically determines the signal-to-noise ratio (SNR) and thus the measurement precision, noting that the precision of DSI in measuring fiber bundles is largely determined by both spatial resolution and diffusion encoding bandwidth (i.e. the maximum b-value (24)). Thus the optimal trade-off between these two parameters was sought along with close investigation of the reproducibility of the measurements.
DSI parameters and acquisition
All studies were performed on a 4T MRI scanner (Bruker/Siemens) equipped with a head birdcage RF transmission coil and an 8 channel receiver coil. A standard whole body gradient set was used providing 40 mT/m maximum gradient strength and 200 μs rise time. The DSI sequence consisted of a twice refocused spin echo pulse train for diffusion encoding (32), followed by a slice-selective echo-planar imaging sequence to map the diffusion signal. The sequence was further augmented by simultaneous echo refocusing (SER) acquisitions (33), in which the stimulated echoes of each EPI acquisition select two slices separated by an encoding gradient, effectively doubling the number of slices per acquisition and thus cutting the scan time in half (34).
Subjects
Fifteen normal human subjects (ten women, five men, mean age 28 ± 5 standard deviation in years; age range, 23–40 years) were scanned to optimize DSI parameters for visualization of the cingulum tracts. Of those subjects, five (four women, one man, mean age 28 ± 6 standard deviation in years; age range, 24–38 years) were scanned back-to-back with identical DSI settings to determine the reproducibility of the measurements. Consent was obtained from all subjects according to the Declaration of Helsinki (BMJ 1991; 302: 1194) and the Ethical Committees of UCSF and the VA Medical Center both approved the study.
Optimization Procedures
Optimization of DSI for a maximum scan time (< 13 min) was carried out by evaluating the variation of several DSI measures along the cingulum bundle as function of spatial (k-space sampling density) and diffusion (q-space sampling bandwidth) resolutions. The DSI measures included fiber length, fiber density, and average orientation distribution function (ODF). The ODF quantifies the diffusion in the main direction of the local fibers corresponding to the voxels of interest. In addition, we evaluated fractional anisotropy (FA) of tensor computations of the full DSI dataset as a measure of diffusion directionality. Note that changing q-space sampling bandwidth was accomplished by varying the maximum b-values of the diffusion encoding gradients while maintaining the total number of diffusion encodings for different spatial directions and b-values.
Thirty two slices without averaging (NEX = 1) were acquired to cover the whole brain. The repetition and echo timing of EPI was kept at TR/TE=3000/145 (ms) for initial and TR/TE=2800/130 (ms) for final parameter settings. The diffusion time (τD) derived by the gradient pulse delay (Δ) and gradient pulse duration (δ) played around 50 ms in the experiments. The spatial matrix size of EPI was 64×64 pixels in all measurements. EPI was optimized for a phase-encoding bandwidth of 1502 Hz/pixel and 6/8 partial Fourier encoding so that white matter had in reference EPI sets (b-value =0) a SNR of at least 18:1, an empirical value for the baseline sensitivity of DSI.
For optimization, we initially started with a setting of relatively low isotropic spatial resolution of 3.8 × 3.8 × 3.8 mm3 but high diffusion bandwidth of bmax = 12,000 s/mm2 with 515 diffusion encodings arranged on a 3D Cartesian grid within a spherical sampling range (determined by bmax) with a radius of five lattice units correspondent to different b-values (or q-values). We choose a long acquisition time of 25 min for this initial setting to obtain a “gold standard” data set with sufficiently high SNR. Subsequently, we converged to more practical settings for human studies by restricting total scan time to less than 13 min and compensating the loss in SNR by limiting maximum b values to a range between 5000 – 8000 s/mm2. We also utilized the negative/positive symmetry of the diffusion probability function (24, 25) to further reduce the number of diffusion encodings from 515 to 258 and thus further shortening scan time by the restriction of q-space sampling from full to half sphere. Finally, we aimed to increase spatial resolution to 3.0 × 3.0 × 3.0 mm3.
The acquisition parameters of DSI for the initial and final optimized settings, as described in more detail below, are summarized in Table 1. The optimum settings were determined by repeated DSI measurements on subjects using estimates of SNR, comparisons of fiber tractographs, mapping of the cingulum bundle and quantification of the cingulum bundle tracts.
Table 1.
DSI parameters for measurements and optimization for detection of cingulum bundle
| Initial settings | Optimum settings | |
|---|---|---|
| b-value(s/mm2), Number of b-values | 8,000, 23 | 5,000, 23 |
| Number of q-space encodings | 258 half sphere to 515 full sphere | 258 half sphere |
| TE (ms)/TR (ms) | 145/3000 | 130/2800 |
| In-plane spatial resolution (mm2) | 3.8×3.8 | 3.0×3.0 |
| Slice number, slice thickness (mm) | 30, 3.8 | 32, 3.0 |
| Δ(ms)/δ(ms) | 66/60 | 60/53 |
| EPI band width (Hz/pixel) | 1954 | 1502 |
| Scan time with NEX=1 | 13 min, twice as long for full q-space sampling | 12 min |
DSI Experiments
In general, DSI optimization was performed in two steps: 1) comparison of the effects of increased spatial resolution versus increased diffusion bandwidth, and 2) determination of the reproducibility of DSI measurements for the different parameter settings.
Spatial resolution versus diffusion bandwidth
Comparisons between spatial resolution and maximum diffusion bandwidth were performed using DSI with a q-space sampling of 258. However, some acquisition parameters, such as EPI bandwidth, echo time and total slice number had to be slightly modified to accommodate changes in spatial resolution and diffusion bandwidth, as appropriate. In total, four DSI settings were tested including high and low bandwidth at low spatial resolution, i.e. dsi1; bmax=8000 s/mm2, res.=3.8×3.8 mm2, dsi2; bmax=5000 s/mm2, res.=3.8×3.8 mm2; and high and low bandwidth at high resolution, i.e. dsi3; bmax=8000 s/mm2, res.=3.0×3.0 mm2 and dsi4; bmax=5000 s/mm2, res.=3.0×3.0 mm2. These measurements were performed on five subjects and group-averaged measures were compared.
Measurement Reproducibility
Five healthy subjects were scanned back-to-back to determine the reproducibility of DSI measurements for each of the four DSI settings. We hypothesized that the tract based measures would reflect the reliability of mapping the cingulum as explained in the following sections describing DSI quantitative analysis and statistics.
DSI fiber tracking and quantitative analysis
The diffusion spectrum was reconstructed by taking the discrete 3D Fourier transformation of the signals acquired in q-space. To smooth the DSI data at high q-values, the signals were filtered by a Hanning window before the data is Fourier transformed (22, 28). In order to get the angular structures of the diffusion spectrum in fiber tracking, the ODF was computed basically by taking a weighted radial summation of the probability of spin displacement for a given angle. The data was reduced from the ODF to a set of directional vectors pointing toward local maxima (24, 29). These vectors were used as starting points and then expanded by propagating voxel by voxel to grow the fiber line until a stopping point, defined by the given angle threshold or the mask, is reached. Tractrograph reconstruction based on a streamline algorithm adapted for DSI data was performed with selection of 42° angle threshold and an appropriate mask threshold to remove the background noise from the whole brain tracts using the Diffusion Toolkit (V.0.2) software (see trackvis.org).
We also reconstructed a diffusion tensor from the whole DSI set (24, 31) to express diffusion directionally along the cingulum bundle in terms of FA. In brief, a low-pass filter was used to eliminate high b- values images of the DSI set and linear least-squares fits were used to compute the tensor eigenvectors and eigenvalues from the remaining DSI data. The standard definition was applied to compute FA from the tensor.
The reconstructed whole brain tracts were visualized and analyzed using TrackVis (V.0.4) (see trackvis.org). To map the cingulum bundle tracts, we used a localized disk with radius=2 mm as a region of interest (ROI) such that at a particular white matter position, a specified number of tracts normal to and passing through the disk were estimated. To be consistent in comparing the DSI analysis, the ROI was always selected on the same location of the cingulum bundle on white matter. Visual inspections of the cingulum bundle tract were augmented by quantitative analyses based on tract counts, mean tract length, variations of ODF, and FA along the cingulum bundle.
Statistics
The following tract based measures were examined to quantify the fiber mapping of the cingulum bundle: tract density (tract counts divided by the volume of the voxels), mean tract length of the fibers, FA and ODF values corresponding to the voxels included in the ROI.
To assess the resolution of the cingulum tracts for the different DSI settings, we evaluated the spatial correlations of FA and ODF values along the fiber tract using variograms which basically characterize the spatial continuity or roughness of a data set (35). The concept of the variogram is explained in the appendix. We postulated that a higher precision in resolving the cingulum tracts is associated with greater smoothness and longer ranging spatial correlations as measured by the variograms. The variogram analysis of the ODF measures was performed using R (2.7.1) “the project for statistical computing” (36).
Reproducibility of DSI measurements was determined using the coefficient of variability, COV≡SD/mean, based on two factors ANOVA with subject and measurement as independent factors.
Results
Spatial resolution versus diffusion bandwidth
Effects of separately changing spatial resolution and diffusion bandwidth (maximum b) on the cingulum visualization are shown in Figs. 1(a–d) for a representative DSI set from one of the subjects. Although brain coverage differed slightly with varying spatial resolutions, efforts were made to place the disk (ROI) in the same anatomical position for tract selection. Quantitative results of changes in various DSI measures (i.e. fiber density, length, mean ODF and FA) as a function of spatial resolution or diffusion bandwidth are depicted in Figs. 2(a–d) by subject.
Fig. 1.
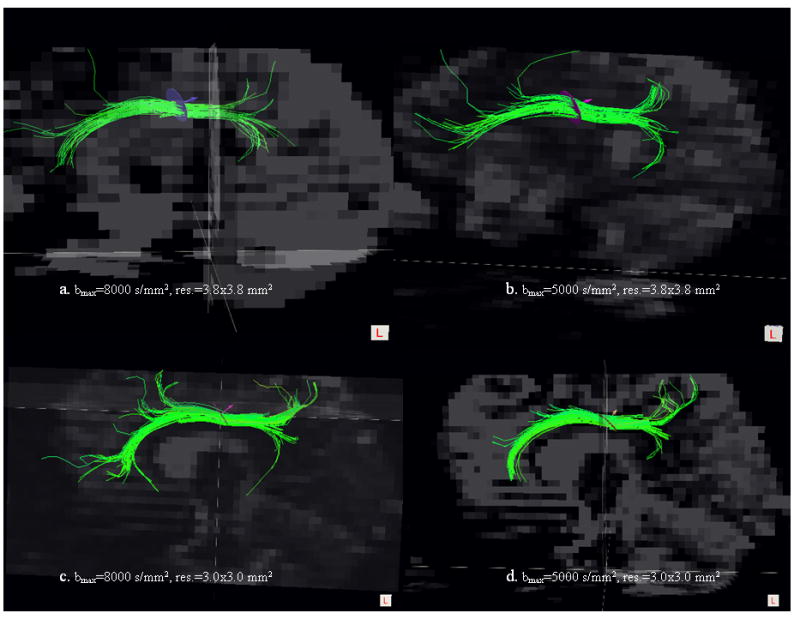
Comparison of cingulum tracts in human brain using DSI experiments with different maximal b-values and spatial resolutions. The four different settings of b-values and resolution are printed in the images from a to d.
Fig. 2.
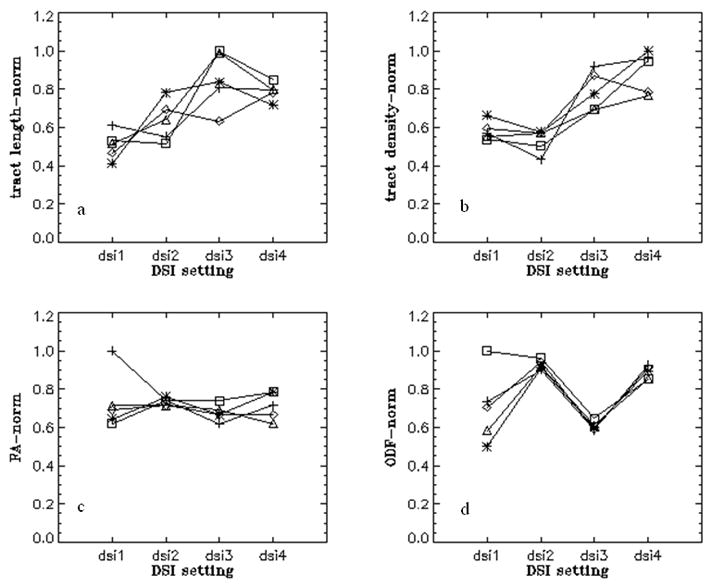
Variations of cingulum bundle tract measures (tract length, tract density, ODF, FA) from five human subjects (*□ ◇ △X) using four DSI settings; Each line represents a subject. dsi1; bmax=8000 s/mm2, res.=3.8×3.8 mm2, dsi2; bmax=5000 s/mm2, res.=3.8×3.8 mm2, dsi3; bmax=8000 s/mm2, res.=3.0×3.0 mm2, dsi4; bmax=5000 s/mm2, res.=3.0×3.0 mm2.
This shows that higher spatial resolution (3.0×3.0) leads consistently to higher values of tract density and length, irrespective of diffusion bandwidth (Figs. 2a, b and 2c, d). However, ODF and FA are less dependent on changes of spatial resolution and diffusion bandwidth. In general, FA values changed little, whereas ODF values increased with lower diffusion bandwidth, irrespective of spatial resolution (see also Table 2).
Table 2.
Evaluation of cingulum bundle tract measures (mean ± SD) averaged over 5 healthy subjects corresponding to the Fig. 8
| DSI experiments | bmax (s/mm2), spatial resolution (mm2) | Tract density (mm−3) | Mean tract length (mm) | Mean ODF (×107) | FA |
|---|---|---|---|---|---|
| dsi 1 | 8000, 3.8×3.8 | 26.9 ± 2.3 | 49.06 ± 4.9 | 2.6 ± 0.6 | 0.28 ± 0.05 |
| dsi 2 | 5000, 3.8×3.8 | 24.5 ± 2.9 | 65.20 ± 9.9 | 3.2 ± 0.08 | 0.32 ± 0.01 |
| dsi 3 | 8000, 3.0×3.0 | 36.1 ± 4.2 | 87.77 ± 15.3 | 2.0 ± 0.09 | 0.29 ± 0.02 |
| dsi 4 | 5000, 3.0×3.0 | 41.2 ± 4.9 | 78.80 ± 4.8 | 3.0 ± 0.11 | 0.31 ± 0.03 |
To further investigate the representation of the cingulum tract by means of ODF or FA, we evaluated ODF and FA voxel by voxels along the cingulum tract within ±60 mm around the ROI position. ODF and FA values along the cingulum bundle from one representative subject are plotted in Figs. 3a and 3b respectively for the four different DSI settings. As observed ODF maps show an extended plateau around the center that only drops toward both two ends of the cingulum bundle and FA maps monotonically increase/decrease as the distance to the middle of the bundle (seed location) decreases/increases. On a global scale, the maps of either ODF or FA along the cingulum bundle hardly show a distinct difference versus different DSI settings.
Fig. 3.
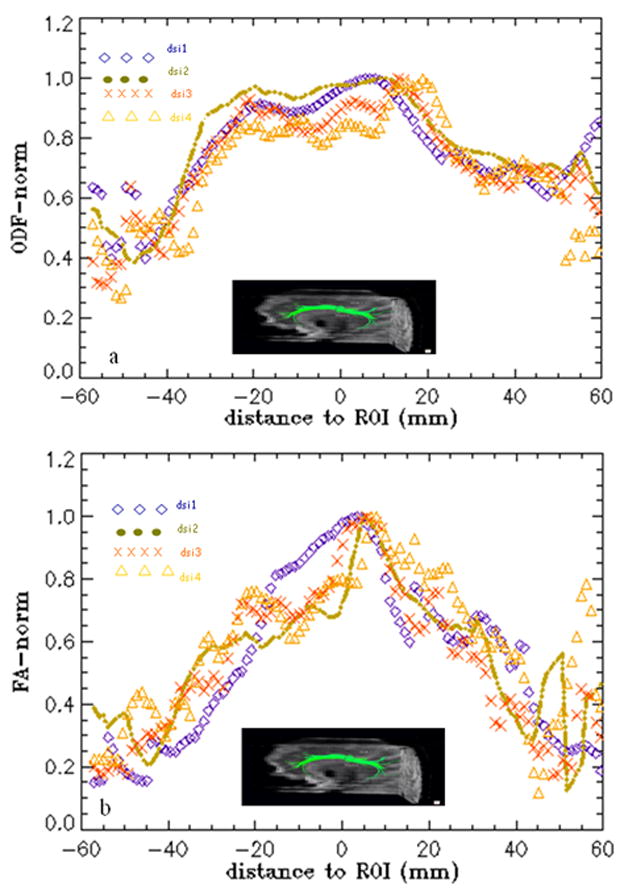
The ODF (a) and FA (b) values voxel-by-voxel along the cingulum tracts (within ±60 mm around a seed ROI) from a representative subject using four DSI settings; dsi1; bmax=8000 s/mm2, res.=3.8×3.8 mm2, dsi2; bmax=5000 s/mm2, res.=3.8×3.8 mm2, dsi3; bmax=8000 s/mm2, res.=3.0×3.0 mm2, dsi4; bmax=5000 s/mm2, res.=3.0×3.0 mm2.
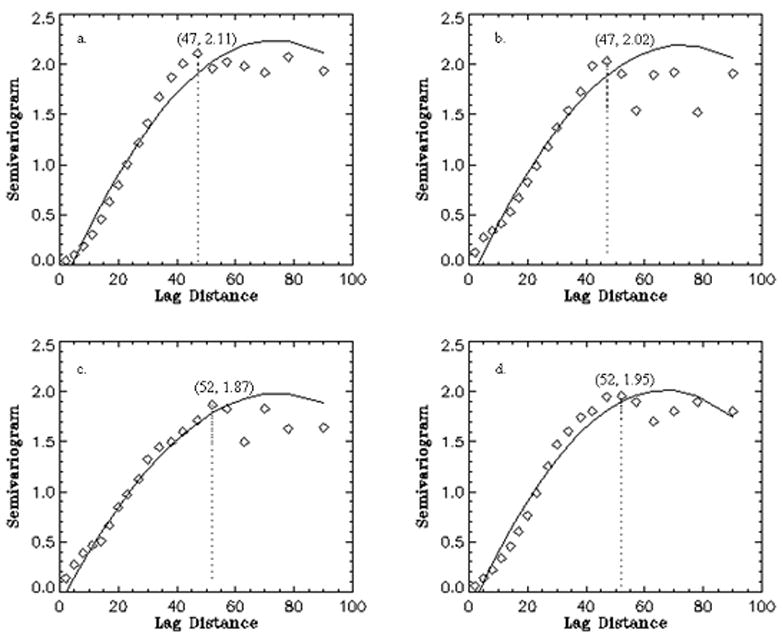
We used variograms to quantify the spatial features on a local scale from voxel to voxel, especially to document the effects of varying spatial resolution and diffusion bandwidth. Spatial correlations of ODF values along the cingulum bundle as measured by variograms are shown in Figs. 4(a–d), respectively for the different resolution and bandwidth settings of DSI. To quantify the change, we evaluated the lag distance of the variograms - as measure of the distance of spatial correlation - when the sills reach a maximum, as indicated by the vertical lines in the figures 4 ad. This reveals that the spatial correlations of the ODF values along the cingulum bundle are larger at higher spatial resolution of DSI. Besides, comparing the variograms of ODF from the settings with high spatial resolutions (Fig. 4c, d) shows the minimum and average variance are smaller (0.06, 1.085) in the setting with lower diffusion bandwidth than (0.09, 1.098) with higher diffusion bandwidth. This presents the largest spatial correlations of ODF along the bundle is obtained using the DSI at higher spatial resolution with lower diffusion bandwidth.
Fig. 4.
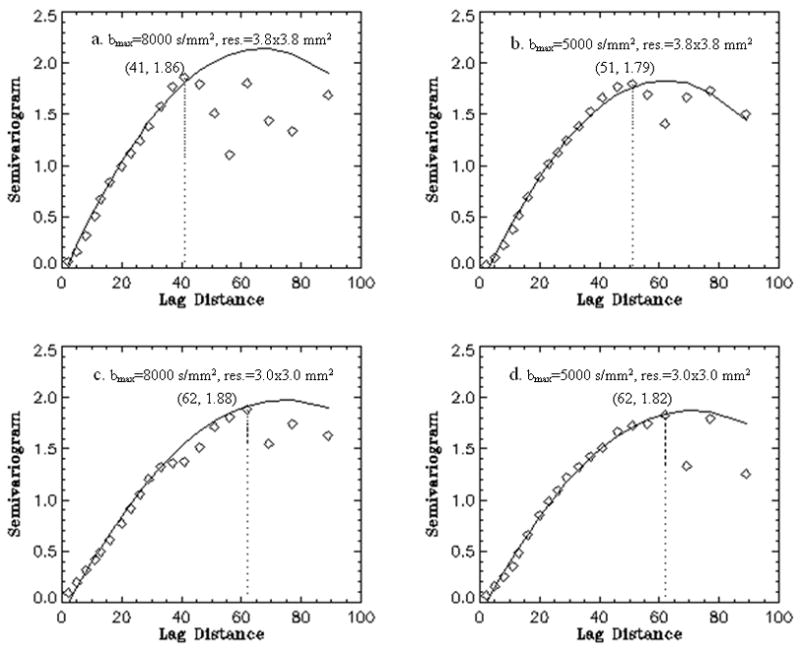
The spatial correlations of ODF along the cingulum tracts by variograms using the four DSI settings (a–d). The variograms were fitted using polynomial models. The maximum lag distance is indicated by a dotted line for each setting. The value of lag distance and corresponding maximum height of the variogram are listed in brackets.
The FA variograms presented in Figs. 5(a–d) were similarly analyzed for the FA maps. The analysis shows that the spatial correlations of FA values along the cingulum bundle are also larger at higher spatial resolution of DSI. The minimum variance of the FA variograms using DSI with lower diffusion bandwidth is much smaller (0.06) than one (0.139) with higher diffusion bandwidth.
Fig. 5.
The spatial correlations of FA along the cingulum tracts by variograms using the four DSI settings (a–d) as fore mentioned. The variograms were fitted using polynomial models. The maximum lag distance is indicated by a dotted line for each setting. The value of lag distance and corresponding maximum height of the variogram are listed in brackets.
Reproducibility of DSI measures
Reproducibility of DSI measures from back-to-back studies on a single subject are listed in table 3 in terms of coefficient of variability. Comparing the COV of the cingulum bundle tracts of the different DSI settings shows that the best reproducibility (COV less than 0.01) of DSI is provided using 3.0 × 3.0 mm spatial resolution and bmax=5000 s/mm2 diffusion bandwidth (setting = dsi4). Reproducibility of the high spatial resolution/high diffusion bandwidth setting (dsi3) is slightly lower, presumably because of lower SNR. The reproducibility of ODF along the cingulum tracts was also represented in Fig. 6 for five test and retests of the optimal DSI setting.
Table 3.
Evaluation of reproducibility of DSI and comparison of the DSI settings for cingulum bundle tract analysis in test and retest scans on the same subject
| Test & Retest Reproducibility | bmax (s/mm2), spatial resolution (mm2) | Tract density (COV) | Mean tract length (COV) | Mean ODF (COV) |
|---|---|---|---|---|
| DSI experiments | ||||
| dsi 1 | 8000, 3.8×3.8 | (0.088) | (0.092) | (0.15) |
| dsi 2 | 5000, 3.8×3.8 | (0.039) | (0.206) | (0.03) |
| dsi 3 | 8000, 3.0×3.0 | (0.120) | (0.129) | (0.01) |
| dsi 4 | 5000, 3.0×3.0 | (0.051) | (0.060) | (0.01) |
Fig. 6.

ODF values along the cingulum tracts (within ±60 mm of the ROI) of a healthy subject from five test and retest DSI measurements with bmax=5000 s/mm2 and an in plane resolution=3.0×3.0 mm2.
Cingulum bundle map by the optimized DSI
Representative cingulum bundle map from one of the subjects is presented in Fig. 7 from the optimized DSI setting. DSI nicely captures the posterior arc of the cingulum bundle and its extension into the hippocampal gyri (Figs. 1c, d). However, the full mapping of the superior and temporal cingulum with the optimal DSI using the two seed disks depicted in the figure resembles the mapping of the cingulum tracts as reported by Schmahmann et. al.(2007) using a DSI setting that required 25 h acquisition time (30).
Fig. 7.
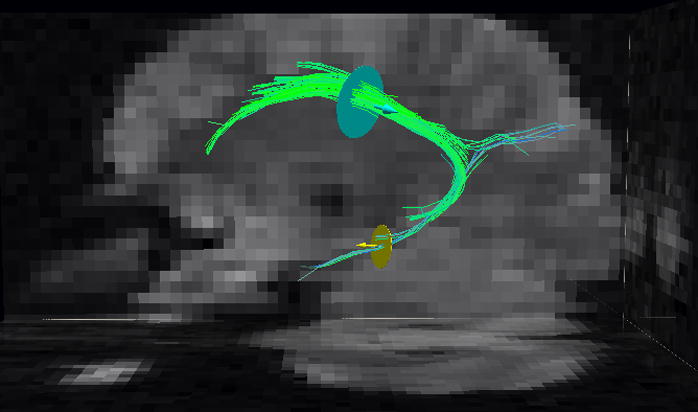
Cingulum bundle tracts from a healthy subject using DSI (resolution=3.0×3.0mm2 b=5000 s/mm2, q=258, scan time= 12 min) and two seed ROIs for the superior and temporal aspects of the cingulum, respectively.
Discussion and Conclusions
There are two main results of this study: First, we showed that evaluating diffusion measures in terms of their dependence on spatial resolution and diffusion bandwidth can guide the optimization of DSI parameter settings when total acquisition time is a constraint. In particular, we demonstrated for the cingulum bundle that measures of fiber density and length as well as spatial correlation of FA and ODF along the fibers all increase with higher spatial resolution for sufficiently high SNR and diffusion bandwidth. Second, we demonstrated that density and length of the cingulum bundle as well as FA and ODF values along the cingulum of healthy controls can reliably and reproducibly be measured in less than 13 minutes with DSI.
The result that quantitative evaluations of various diffusion measures can guide the optimization of DSI parameters is important for many practical settings where total acquisition time and other parameters are a constraint. Given a sufficient SNR, it was not clear at the beginning of this study how spatial resolution and diffusion bandwidth in DSI would affect the representation of the cingulum bundle. Our study shows that a higher spatial resolution substantially improved measurements of the human cingulum bundles. Although increasing the diffusion bandwidth also improves the results, the spatial resolution had a greater impact as shown by the increase in spatial correlation distance of both FA and ODF measures along the fibers at higher resolution (see figure 4 and 5). Furthermore, the reproducibility of DSI measures along the cingulum bundle, such as fiber length or mean FA and ODF, is also higher at higher spatial resolution. Since a simultaneous increase of both spatial resolution and diffusion bandwidth reduces SNR, it is clear that an optimal tradeoff must be sought between spatial resolution and diffusion bandwidth. Based on our measurements in the cingulum, we favored to increase spatial resolution (from initially 3.8 × 3.8 × 3.8 mm3 to final 3.0 × 3.0 × 3.0 mm3) at the expense of decreasing diffusion bandwidth (from initially b= 8000 s/mm2 to final b = 5000 s/mm2) to maintain a sufficient level of SNR.
The second result was that the particular parameter setting of DSI provided reliable DSI measurements along the cingulum bundle as assessed by coefficients of variation measures along the tracts, such as ODF, over back-to-back measurements.
In almost all subjects, we found lower ODF values along the cingulum when diffusion bandwidth was increased at constant spatial resolution. There are several explanations for lower ODF values. First, since a higher diffusion bandwidth is more sensitive to small diffusion displacements, smaller ODF values may be more representative of water diffusion in the cigulum bundle than high values. Second, since a higher diffusion bandwidth reduces SNR, lower ODF results may simply be an artifact of noise bias. Noise bias in MRI diffusion is well documented (37). We also found lower ODF values at higher spatial resolution at the same diffusion bandwidth. This suggests that noise bias has a strong impact on the ODF.
The FA values were used as one of the tract measures to guide the DSI optimization at this work. The values generally showed a highly alternation along the cingulum tracts. Whether the use of an optimal method for tensor computation could improve the FA values to be more robust to noise along the tracts was not sought.
There are several issues which limited this study to verify precise measures of the cingulum tracts. First, the technical limitations in clinical MR system for providing narrow gradient pulses (δ≪Δ) as an acknowledged approximation for MR diffusion signal (38), might affect on our DSI results. The cingulum tracts would give different measures due to PDF reconstruction if the system was able to meet this approximation. However, Wedeen et. al (2005), showed that even a finite diffusion encoding gradient (δ~Δ) does not significantly impair the DSI interpretation (24) as long as the diffusion time is short relative to exchange time for water molecules diffuse in their local compartments without exchanging with others.
Second, partial volume effect due to the limited spatial resolution in brain imaging can be still a source of error in precisely measuring the cingulum tracts and consequently affect on reproducibility of the tract measures. Implementing a higher spatial resolution could partly be a solution to avoid the adjacent voxels interference but this would be associated with cost of SNR and likely impractical. However, taking into account the effect of partial volume fraction is another critical issue in providing reliable tract measures.
Finally, the lack of ‘gold standard’ diffusion in human cingulum, limits us to conclude to a ‘gold standard’ DSI measurement. However, the optimal DSI setting was verified as a relatively accurate measurement for mapping cingulum bundle.
In conclusion, we demonstrated that high fiber resolution requires careful tailoring of acquisition parameters, especially spatial resolution and diffusion bandwidth. We also showed a well resolved and reproducible identification of the cingulum bundles based on DSI acquisition of only 12 minutes duration, appropriate for clinical studies. The advantage of DSI for mapping the cingulum bundle was also indicated by generally high spatial correlations of tract measures. The data suggest that the optimized DSI can be used for reliable and robust detection of cingulum bundles and their characteristics in neurodegenerative diseases known to involve the cingulum, including mild cognitive impairment and Alzheimer disease.
Acknowledgments
The authors would like to thank Dr Thomas Benner from Harvard Medical School for his advice in DSI sequence implementation. This work is funded in part by the National Center for Research Resources (RR23953), NIH grant (AA10788 (DJM)) and a Department of Defense Neuroscience Center of Excellence grant (W81XWH). The VA Medical Center in San Francisco provided the research facilities.
Appendix
Variogram analysis
The variogram is a quantitative descriptive statistic which characterizes the spatial continuity or roughness of a data set. A variogram is mathematically defined as
| (1) |
where Z(x, y) and Z(Δx, Δy) are the values of a variable of interest at two locations, and ε[] is the statistical expectation operator. The variogram denoted as γ( ), describes the variation of Z as a function of the separation between the locations (Δx, Δy).
The experimental variogram, termed as semi-variogram, is calculated by averaging one-half the difference squared of the z-values over all pairs of observations with the specified separation distance and direction. The experimental formula used for the observed data can be written as
| (2) |
where N(Δx, Δy) is the number of each pair in all sets of pairs S(Δx, Δy).
The variogram can be generally modeled as a linear, exponential, polynomial or spherical function. The variogram can characterized by summary measures such as the nugget (representing the minimum variance of the pairs), the “sill” (representing the average variance of pairs at a certain distance) and the range (representing the lag distance at which there is no longer a significant correlation between the points).
An increasing range (lag distance) in combination with a decreasing nugget and sill in variogram represents higher spatial correlation in the observed data and thus better representation of fiber bundles.
Footnotes
Publisher's Disclaimer: This is a PDF file of an unedited manuscript that has been accepted for publication. As a service to our customers we are providing this early version of the manuscript. The manuscript will undergo copyediting, typesetting, and review of the resulting proof before it is published in its final citable form. Please note that during the production process errors may be discovered which could affect the content, and all legal disclaimers that apply to the journal pertain.
References
- 1.Bürgel U, Amunts K, Hoemke L, Mohlber H, Gilsbach JM, Zilles K. White matter fiber tracts of the human brain: Three-dimensional mapping at microscopic resolution, topography and intersubject variability. NeuroImage. 2006;29:1092–1105. doi: 10.1016/j.neuroimage.2005.08.040. [DOI] [PubMed] [Google Scholar]
- 2.Armstrong E. Limbic thalamus. In: Paxinos G, editor. The Human Nervous System. Academic Press; San Diego: 1990. pp. 469–481. [Google Scholar]
- 3.Smith CD, Malcein M, Meurer K. MRI temporal lobe volume measures and neuropsychologic function in Alzheimer’s disease. J Neuroimaging. 1999;9:2–9. doi: 10.1111/jon1999912. [DOI] [PubMed] [Google Scholar]
- 4.Ardekani BA, Nierenberg J, Hoptman NJ, Javitt DC, Lim KO. MRI study of white matter diffusion anisotropy in schizophrenia. NeuroReport. 2003;14:2025–2029. doi: 10.1097/00001756-200311140-00004. [DOI] [PubMed] [Google Scholar]
- 5.Zahajszky J, Dickey CC, McCarley RW. A quantitative MR measure of the fornix in schizophrenia. Schizophr Res. 2001;47:87–97. doi: 10.1016/s0920-9964(00)00051-7. [DOI] [PMC free article] [PubMed] [Google Scholar]
- 6.Drevets WC, Price JL, Furey ML. Brain structural and functional abnormalities in mood disorders: implications for neurocircuitry models of depression. Brain Struct Funct. 2008;213:93–118. doi: 10.1007/s00429-008-0189-x. [DOI] [PMC free article] [PubMed] [Google Scholar]
- 7.Matthews SC, Strigo IA, Simmons AN, Yang TT, Paulus MP. Decreased functional coupling of the amygdala and supragenual cingulate is related to increased depression in unmedicated individuals with current major depressive disorder. J Affect Disord. 2008;111:13–20. doi: 10.1016/j.jad.2008.05.022. [DOI] [PubMed] [Google Scholar]
- 8.Geuze E, Vermetten E, Ruf M, de Kloet CS, Westenberg HG. Neural correlates of associative learning and memory in veterans with posttraumatic stress disorder. J Psychiatr Res. 2008;42:659–69. doi: 10.1016/j.jpsychires.2007.06.007. [DOI] [PubMed] [Google Scholar]
- 9.Smith SD, Abou-Khalil B, Zald DH. Posttraumatic stress disorder in a patient with no left amygdale. J Abnorm Psychol. 2008;117:479–84. doi: 10.1037/0021-843X.117.2.479. [DOI] [PMC free article] [PubMed] [Google Scholar]
- 10.Catani M, Howard RJ, Pajevic S, Jones DK. Virtual in vivo interactive dissection of white matter fasciculi in the human brain. Neuroimage. 2002;17:77–94. doi: 10.1006/nimg.2002.1136. [DOI] [PubMed] [Google Scholar]
- 11.Basser PJ, Pierpaoli C. Estimation of the effective self diffusion tensor from the NMR spin echo. J Magn Reson. 1994;B111:209–219. doi: 10.1006/jmrb.1994.1037. [DOI] [PubMed] [Google Scholar]
- 12.Makris N, Worth AJ, Sorensen AG, Papadimitriou GM, Wu O, Reese TG, Wedeen VJ, Davis TL, Stakes JW, Caviness VS, Kaplan E, Rosen BR, Pandya DN, Kennedy DN. Morphometry of in vivo human white matter association pathways with diffusion-weighted magnetic resonance imaging. Ann Neurol. 1997;42:951–962. doi: 10.1002/ana.410420617. [DOI] [PubMed] [Google Scholar]
- 13.Mori S, Kaufmann WE, Davatzikos C. Imaging cortical association tracts in the human brain using diffusion-tensor-based axonal tracking. Magn Reson Med. 2002;47:215–223. doi: 10.1002/mrm.10074. [DOI] [PubMed] [Google Scholar]
- 14.Pierpaoli C, Jezzard P, Basser PJ. Diffusion tensor MR imaging of the human brain. Radiology. 1996;201:637–648. doi: 10.1148/radiology.201.3.8939209. [DOI] [PubMed] [Google Scholar]
- 15.Wakana S, Jiang H, Nagae-Poetscher LM. Fiber tract-based atlas of human white matter anatomy. Radiology. 2004;230:77–87. doi: 10.1148/radiol.2301021640. [DOI] [PubMed] [Google Scholar]
- 16.Zhang Y, Schuff N, Jahng GH, Bayne W, Mori S, Schad L, Mueller L, Du AT, Kramer JH, Yaffe K, Chui H, Jagust WJ, Miller BL, Weiner MW. Diffusion tensor imaging of cingulum fibers in mild cognitive impairment and Alzheimer disease. Neurology. 2007;68:13–19. doi: 10.1212/01.wnl.0000250326.77323.01. [DOI] [PMC free article] [PubMed] [Google Scholar]
- 17.Basser PJ, Pajevic S, Pierpaoli C, Duda J, Aldroubi A. In vivo fiber tractography using DT-MRI data. Magn Reson Med. 2000;44:625–632. doi: 10.1002/1522-2594(200010)44:4<625::aid-mrm17>3.0.co;2-o. [DOI] [PubMed] [Google Scholar]
- 18.Concha L, Gross DW, Beaulieu Ch. Diffusion Tensor Tractography of the Limbic System. AJNR Am J Neuroradiol. 2005;26:2267–2274. [PMC free article] [PubMed] [Google Scholar]
- 19.Rose SE, Chen F, Chalk JB. Loss of connectivity in Alzheimer’s disease: an evaluation of white matter tract integrity with color-coded MR diffusion tensor imaging. J Neurol Neurosurg Psychiatry. 2000;69:528–530. doi: 10.1136/jnnp.69.4.528. [DOI] [PMC free article] [PubMed] [Google Scholar]
- 20.Park HJ, Westin CF, Kubicki M. White matter hemisphere asymmetries in healthy subjects and in schizophrenia: a diffusion tensor MRI study. Neuroimage. 2004;23:213–223. doi: 10.1016/j.neuroimage.2004.04.036. [DOI] [PMC free article] [PubMed] [Google Scholar]
- 21.Wang F, Sun Z, Cui L. Anterior cingulum abnormalities in male patients with schizophrenia determined through diffusion tensor imaging. Am J Psychiatry. 2004;161:573–575. doi: 10.1176/appi.ajp.161.3.573. [DOI] [PubMed] [Google Scholar]
- 22.Frank LR. Anisotropy in high angular resolution diffusion-weighted MRI. Magn Reson Med. 2001;45:935–9. doi: 10.1002/mrm.1125. [DOI] [PubMed] [Google Scholar]
- 23.Tuch DS, Reese TG, Wiegell MR, Wedeen VJ. Diffusion MRI of complex neural architecture. Neuron. 2003;40:885–895. doi: 10.1016/s0896-6273(03)00758-x. [DOI] [PubMed] [Google Scholar]
- 24.Wedeen VJ, Hagmann P, Tseng WI, Reese TG, Weisskoff RM. Mapping Complex Tissue Architecture With Diffusion Spectrum Magnetic Resonance Imaging, Magn. Reson Med. 2005;54:1377–1386. doi: 10.1002/mrm.20642. [DOI] [PubMed] [Google Scholar]
- 25.Hagmann P, Jonasson L, Maeder P, Thiran JP, Wedeen VJ, Meuli R. Understanding Diffusion MR Imaging techniques: from scalar diffusion weighted imaging to diffusion tensor imaging and beyond. RadioGraphics. 2006;16:S205–S223. doi: 10.1148/rg.26si065510. [DOI] [PubMed] [Google Scholar]
- 26.Hagmann P, Jonasson L, Deffieux T, Meuli R, Thiran JP, Wedeen VJ. Fibertract segmentation in position orientation space from high angular resolution diffusion MRI. NeuroImage. 2006;32:665 –675. doi: 10.1016/j.neuroimage.2006.02.043. [DOI] [PubMed] [Google Scholar]
- 27.Gilbert RJ, Magnusson LH, Napadow VJ, Benner T, Wang R, Wedeen VJ. Mapping Complex Myoarchitecture in the Bovine Tongue with Diffusion-Spectrum Magnetic Resonance Imaging. Biophysical Journal. 2006;91:1014–1022. doi: 10.1529/biophysj.105.068015. [DOI] [PMC free article] [PubMed] [Google Scholar]
- 28.Gilbert RJ, Wedeen VJ, Magnusson LH, Benner T, Wang R, Dai G, Napadow VJ, Roche KK. Three-Dimensional Myoarchitecture of the Bovine Tongue Demonstrated by Diffusion Spectrum Magnetic Resonance Imaging With Tractography. The Anatomical Record Part A. 2006;288A:1173–1182. doi: 10.1002/ar.a.20387. [DOI] [PubMed] [Google Scholar]
- 29.Hagmann P, Reese TG, Tseng WYI, Meuli R, Thiran JP, Wedeen VJ. Diffusion Spectrum Imaging tractography in complex cerebral white matter: an investigation of the centrum semiovale. Proceedings of 12th Annual Meeting of ISMRM; Kyoto, Japan. 2004. p. 623. [Google Scholar]
- 30.Schmahmann JD, Pandya DN, Wang R, Dai G, D’Arceuil HE, de Crespigny AJ, Wedeen VJ. Association fiber pathways of the brain: parallel observations from diffusion spectrum imaging and autoradiography. Brain. 2007;130:630–653. doi: 10.1093/brain/awl359. [DOI] [PubMed] [Google Scholar]
- 31.Wedeen VJ, Wang R, Schmahmann JD, Benner T, Tseng WYI, Dai G, Pandya DN, Hagmann P, D’Arceuil HD, de Crespigny AJ. Diffusion spectrum magnetic resonance imaging (DSI) tractography of crossing fibers. NeuroImage. 2008;41:1267–1277. doi: 10.1016/j.neuroimage.2008.03.036. [DOI] [PubMed] [Google Scholar]
- 32.Reese TG, Heid O, Weisskoff RM, Wedeen VJ. Reduction of eddy-current-induced distortion in diffusion MRI using a twice refocused spin echo. Magn Reson Med. 2003;49:177–82. doi: 10.1002/mrm.10308. [DOI] [PubMed] [Google Scholar]
- 33.Feinberg DA, Reese TG, Wedeen VJ. Simultaneous echo refocusing in EPI. Magn Reson Med. 2002;48:1–5. doi: 10.1002/mrm.10227. [DOI] [PubMed] [Google Scholar]
- 34.Reese TG, Benner T, Wang R, Feinberg DA, Wedeen VJ. Halving Imaging Time of Whole Brain Diffusion Spectrum Imaging (DSI) Using Simultaneous Echo Refocusing (SER) EPI. Proceedings of 14th Annual Meeting of ISMRM; Seattle, USA. 2006. [Google Scholar]
- 35.Cressie N. Statistics for Spatial Data. John Wiley and Sons; New York: 1991. p. 900. [Google Scholar]
- 36.Venables WN, Smith DM. An Introduction to R(2.7.1): A Programming Environment for Data Analysis and Graphics. 2008 [Google Scholar]
- 37.Sijbers J, den Dekker AJ, Van Audekerke J, Verhoye M, Van Dyck D. Estimation of the noise in magnitude MR images. Magn Reson Imag. 1998;16:87–90. doi: 10.1016/s0730-725x(97)00199-9. [DOI] [PubMed] [Google Scholar]
- 38.Stejskal EO, Tanner JE. Spin Diffusion Measurements: Spin Echoes in the Presence of a Time-Dependent Field Gradient. J Chem Phys. 1965;42:288–292. [Google Scholar]