Abstract
Qualitative data is often subjective, rich, and consists of in-depth information normally presented in the form of words. Analysing qualitative data entails reading a large amount of transcripts looking for similarities or differences, and subsequently finding themes and developing categories. Traditionally, researchers ‘cut and paste’ and use coloured pens to categorise data. Recently, the use of software specifically designed for qualitative data management greatly reduces technical sophistication and eases the laborious task, thus making the process relatively easier. A number of computer software packages has been developed to mechanise this ‘coding’ process as well as to search and retrieve data. This paper illustrates the ways in which NVivo can be used in the qualitative data analysis process. The basic features and primary tools of NVivo which assist qualitative researchers in managing and analysing their data are described.
Keywords: Qualitative research data analysis, NVivo
QUALITATIVE RESEARCH IN MEDICINE
Qualitative research has seen an increased popularity in the last two decades and is becoming widely accepted across a wide range of medical and health disciplines, including health services research, health technology assessment, nursing, and allied health.1 There has also been a corresponding rise in the reporting of qualitative research studies in medical and health related journals.2
The increasing popularity of qualitative methods is a result of failure of quantitative methods to provide insight into in-depth information about the attitudes, beliefs, motives, or behaviours of people, for example in understanding the emotions, perceptions and actions of people who suffer from a medical condition. Qualitative methods explore the perspective and meaning of experiences, seek insight and identify the social structures or processes that explain people”s behavioural meaning.1,3 Most importantly, qualitative research relies on extensive interaction with the people being studied, and often allows researchers to uncover unexpected or unanticipated information, which is not possible in the quantitative methods. In medical research, it is particularly useful, for example, in a health behaviour study whereby health or education policies can be effectively developed if reasons for behaviours are clearly understood when observed or investigated using qualitative methods.4
ANALYSING QUALITATIVE DATA
Qualitative research yields mainly unstructured text-based data. These textual data could be interview transcripts, observation notes, diary entries, or medical and nursing records. In some cases, qualitative data can also include pictorial display, audio or video clips (e.g. audio and visual recordings of patients, radiology film, and surgery videos), or other multimedia materials. Data analysis is the part of qualitative research that most distinctively differentiates from quantitative research methods. It is not a technical exercise as in quantitative methods, but more of a dynamic, intuitive and creative process of inductive reasoning, thinking and theorising.5 In contrast to quantitative research, which uses statistical methods, qualitative research focuses on the exploration of values, meanings, beliefs, thoughts, experiences, and feelings characteristic of the phenomenon under investigation.6
Data analysis in qualitative research is defined as the process of systematically searching and arranging the interview transcripts, observation notes, or other non-textual materials that the researcher accumulates to increase the understanding of the phenomenon.7 The process of analysing qualitative data predominantly involves coding or categorising the data. Basically it involves making sense of huge amounts of data by reducing the volume of raw information, followed by identifying significant patterns, and finally drawing meaning from data and subsequently building a logical chain of evidence.8
Coding or categorising the data is the most important stage in the qualitative data analysis process. Coding and data analysis are not synonymous, though coding is a crucial aspect of the qualitative data analysis process. Coding merely involves subdividing the huge amount of raw information or data, and subsequently assigning them into categories.9 In simple terms, codes are tags or labels for allocating identified themes or topics from the data compiled in the study. Traditionally, coding was done manually, with the use of coloured pens to categorise data, and subsequently cutting and sorting the data. Given the advancement of software technology, electronic methods of coding data are increasingly used by qualitative researchers.
Nevertheless, the computer does not do the analysis for the researchers. Users still have to create the categories, code, decide what to collate, identify the patterns and draw meaning from the data. The use of computer software in qualitative data analysis is limited due to the nature of qualitative research itself in terms of the complexity of its unstructured data, the richness of the data and the way in which findings and theories emerge from the data.10 The programme merely takes over the marking, cutting, and sorting tasks that qualitative researchers used to do with a pair of scissors, paper and note cards. It helps to maximise efficiency and speed up the process of grouping data according to categories and retrieving coded themes. Ultimately, the researcher still has to synthesise the data and interpret the meanings that were extracted from the data. Therefore, the use of computers in qualitative analysis merely made organisation, reduction and storage of data more efficient and manageable. The qualitative data analysis process is illustrated in Figure 1.
Figure 1.
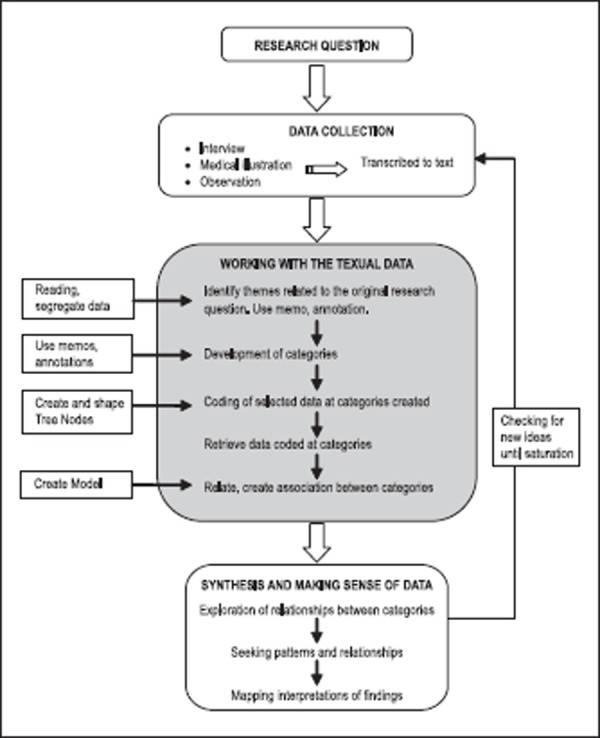
Qualitative data analysis flowchart
USING NVIVO IN QUALITATIVE DATA ANALYSIS
NVivo is one of the computer-assisted qualitative data analysis softwares (CAQDAS) developed by QSR International (Melbourne, Australia), the world’s largest qualitative research software developer. This software allows for qualitative inquiry beyond coding, sorting and retrieval of data. It was also designed to integrate coding with qualitative linking, shaping and modelling. The following sections discuss the fundamentals of the NVivo software (version 2.0) and illustrates the primary tools in NVivo which assist qualitative researchers in managing their data.
Key features of NVivo
To work with NVivo, first and foremost, the researcher has to create a Project to hold the data or study information. Once a project is created, the Project pad appears (Figure 2). The project pad of NVivo has two main menus: Document browser and Node browser. In any project in NVivo, the researcher can create and explore documents and nodes, when the data is browsed, linked and coded. Both document and node browsers have an Attribute feature, which helps researchers to refer the characteristics of the data such as age, gender, marital status, ethnicity, etc.
Figure 2.
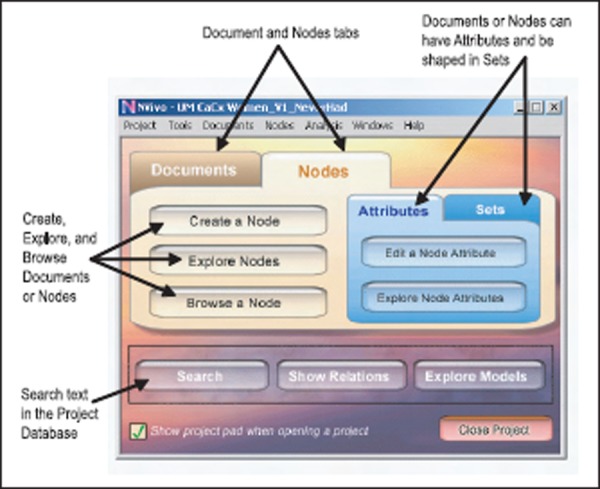
Project pad with documents tab selected
The document browser is the main work space for coding documents (Figure 3). Documents in NVivo can be created inside the NVivo project or imported from MS Word or WordPad in a rich text (.rtf) format into the project. It can also be imported as a plain text file (.txt) from any word processor. Transcripts of interview data and observation notes are examples of documents that can be saved as individual documents in NVivo. In the document browser all the documents can be viewed in a database with short descriptions of each document.
Figure 3.
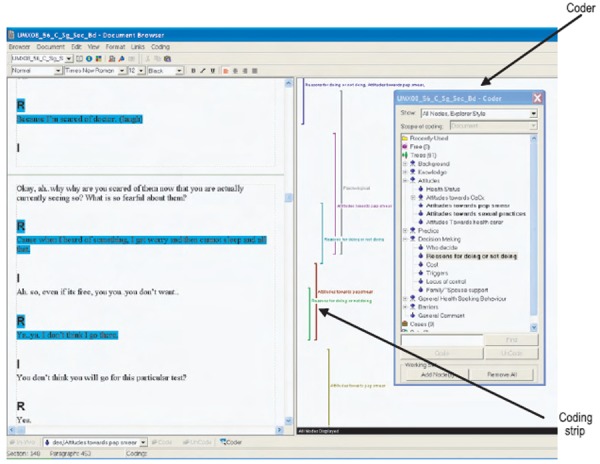
Document browser with coder and coding stripe activated
NVivo is also designed to allow the researcher to place a Hyperlink to other files (for example audio, video and image files, web pages, etc.) in the documents to capture conceptual links which are observed during the analysis. The readers can click on it and be taken to another part of the same document, or a separate file. A hyperlink is very much like a footnote.
The second menu is Node explorer (Figure 4), which represents categories throughout the data. The codes are saved within the NVivo database as nodes. Nodes created in NVivo are equivalent to sticky notes that the researcher places on the document to indicate that a particular passage belongs to a certain theme or topic. Unlike sticky notes, the nodes in NVivo are retrievable, easily organised, and give flexibility to the researcher to either create, delete, alter or merge at any stage. There are two most common types of node: tree nodes (codes that are organised in a hierarchical structure) and free nodes (free standing and not associated with a structured framework of themes or concepts). Once the coding process is complete, the researcher can browse the nodes. To view all the quotes on a particular Node, select the particular node on the Node Explorer and click the Browse button (Figure 5).
Figure 4.
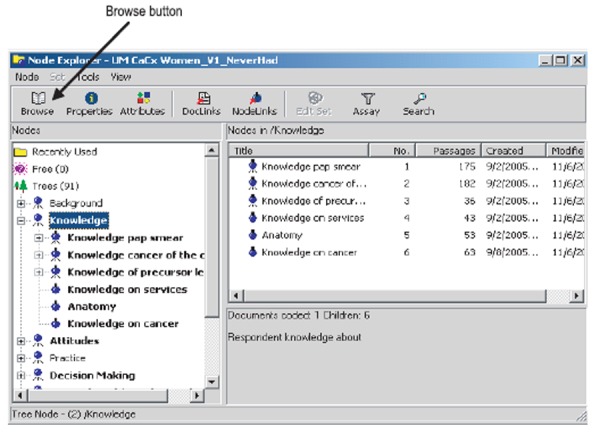
Node explorer with a tree node highlighted
Figure 5.
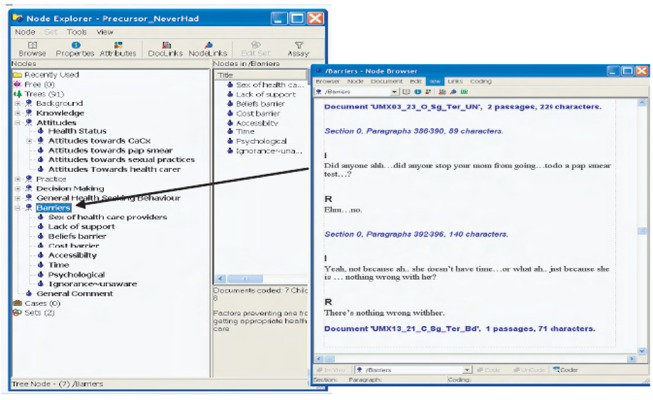
Browsing a node
Coding in NVivo using Coder
Coding is done in the document browser. Coding involves the desegregation of textual data into segments, examining the data similarities and differences, and grouping together conceptually similar data in the respective nodes.11 The organised list of nodes will appear with a click on the Coder button at the bottom of document browser window.
To code a segment of the text in a project document under a particular node, highlight the particular segment and drag the highlighted text to the desired node in the coder window (Figure 3). The segments that have been coded to a particular node are highlighted in colours and nodes that have attached to a document turns bold. Multiple codes can be assigned to the same segment of text using the same process. Coding Stripes can be activated to view the quotes that are associated with the particular nodes. With the guide of highlighted text and coding stripes, the researcher can return to the data to do further coding or refine the coding.
Coding can be done with pre-constructed coding schemes where the nodes are first created using the Node explorer followed by coding using the coder. Alternatively, a bottom-up approach can be used where the researcher reads the documents and creates nodes when themes arise from the data as he or she codes.
Making and using memos
In analysing qualitative data, pieces of reflective thinking, ideas, theories, and concepts often emerge as the researcher reads through the data. NVivo allows the user the flexibility to record ideas about the research as they emerge in the Memos. Memos can be seen as add-on documents, treated as full status data and coded like any other documents.12 Memos can be placed in a document or at a node. A memo itself can have memos (e.g. documents or nodes) linked to it, using DocLinks and NodeLinks.
Creating attributes
Attributes are characteristics (e.g. age, marital status, ethnicity, educational level, etc.) that the researcher associates with a document or node. Attributes have different values (for example, the values of the attribute for ethnicity are ‘Malay’, ‘Chinese’ and ‘Indian’). NVivo makes it possible to assign attributes to either document or node. Items in attributes can be added, removed or rearranged to help the researcher in making comparisons. Attributes are also integrated with the searching process; for example, linking the attributes to documents will enable the researcher to conduct searches pertaining to documents with specified characteristics (Figure 6).
Figure 6.
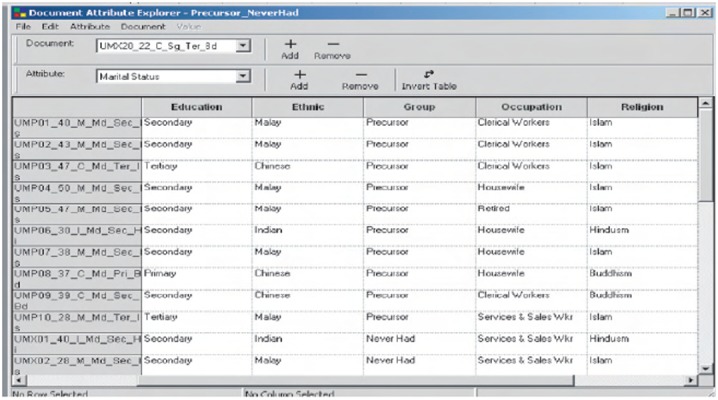
Document attribute explorer
Search operation
The three most useful types of searches in NVivo are Single item (text, node, or attribute value), Boolean and Proximity searches. Single item search is particularly important, for example, if researchers want to ensure that every mention of the word ‘cure’ has been coded under the ‘Curability of cervical cancer’ tree node. Every paragraph in which this word is used can be viewed. The results of the search can also be compiled into a single document in the node browser and by viewing the coding stripe. The researcher can check whether each of the resulting passages has been coded under a particular node. This is particularly useful for the researcher to further determine whether conducting further coding is necessary.
Boolean searches combine codes using the logical terms like ‘and’, ‘or’ and ‘not’. Common Boolean searches are ‘or’ (also referred to as ‘combination’ or ‘union’) and ‘and’ (also called ‘intersection’). For example, the researcher may wish to search for a node and an attributed value, such as ‘ever screened for cervical cancer’ and ‘primary educated’. Search results can be displayed in matrix form and it is possible for the researcher to perform quantitative interpretations or simple counts to provide useful summaries of some aspects of the analysis.13 Proximity searches are used to find places where two items (e.g. text patterns, attribute values, nodes) appear near each other in the text.
Using models to show relationships
Models or visualisations are an essential way to describe and explore relationships in qualitative research. NVivo provides a Modeler designated for visual exploration and explanation of relationships between various nodes and documents. In Model Explorer, the researcher can create, label and connect ideas or concepts. NVivo allows the user to create a model over time and have any number of layers to track the progress of theory development to enable the researcher to examine the stages in the model-building over time (Figure 7). Any documents, nodes or attributes can be placed in a model and clicking on the item will enable the researcher to inspect its properties.
Figure 7.
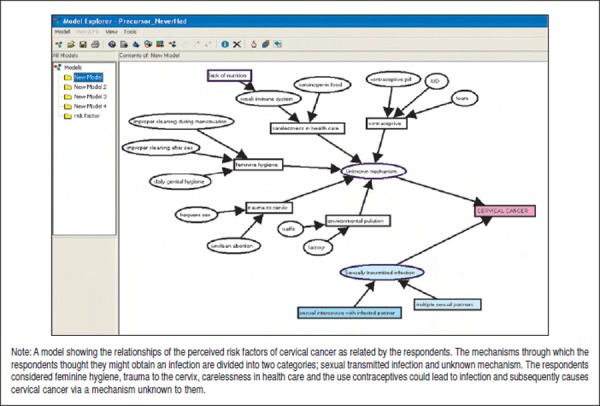
Model explorer showing the perceived risk factors of cervical cancer
SUMMARY
NVivo has clear advantages and can greatly enhance research quality as outlined above. It can ease the laborious task of data analysis which would otherwise be performed manually. The software certainly removes the tremendous amount of manual tasks and allows more time for the researcher to explore trends, identify themes, and make conclusions. Ultimately, analysis of qualitative data is now more systematic and much easier. In addition, NVivo is ideal for researchers working in a team as the software has a Merge tool that enables researchers that work in separate teams to bring their work together into one project.
The NVivo software has been revolutionised and enhanced recently. The newly released NVivo 7 (released March 2006) and NVivo 8 (released March 2008) are even more sophisticated, flexible, and enable more fluid analysis. These new softwares come with a more user-friendly interface that resembles the Microsoft Windows XP applications. Furthermore, they have new data handling capacities such as to enable tables or images embedded in rich text files to be imported and coded as well. In addition, the user can also import and work on rich text files in character based languages such as Chinese or Arabic.
To sum up, qualitative research undoubtedly has been advanced greatly by the development of CAQDAS. The use of qualitative methods in medical and health care research is postulated to grow exponentially in years to come with the further development of CAQDAS.
More information about the NVivo software
Detailed information about NVivo’s functionality is available at http://www.qsrinternational.com. The website also carries information about the latest versions of NVivo. Free demonstrations and tutorials are available for download.
ACKNOWLEDGEMENT
The examples in this paper were adapted from the data of the study funded by the Ministry of Science, Technology and Environment, Malaysia under the Intensification of Research in Priority Areas (IRPA) 06-02-1032 PR0024/09-06.
TERMINOLOGY
Attributes: An attribute is a property of a node, case or document. It is equivalent to a variable in quantitative analysis. An attribute (e.g. ethnicity) may have several values (e.g. Malay, Chinese, Indian, etc.). Any particular node, case or document may be assigned one value for each attribute. Similarities within or differences between groups can be identified using attributes. Attribute Explorer displays a table of all attributes assigned to a document, node or set.
CAQDAS: Computer Aided Qualitative Data Analysis. The CAQDAS programme assists data management and supports coding processes. The software does not really analyse data, but rather supports the qualitative analysis process. NVivo is one of the CAQDAS programmes; others include NUDIST, ATLAS-ti, AQUAD, ETHNOGRAPH and MAXQDA.
Code: A term that represents an idea, theme, theory, dimension, characteristic, etc., of the data.
Coder: A tool used to code a passage of text in a document under a particular node. The coder can be accessed from the Document or Node Browser.
Coding: The action of identifying a passage of text in a document that exemplifies ideas or concepts and connecting it to a node that represents that idea or concept. Multiple codes can be assigned to the same segment of text in a document.
Coding stripes: Coloured vertical lines displayed at the right-hand pane of a Document; each is named with title of the node at which the text is coded.
DataLinks: A tool for linking the information in a document or node to the information outside the project, or between project documents. DocLinks, NodeLinks and DataBite Links are all forms of DataLink.
Document: A document in an NVivo project is an editable rich text or plain text file. It may be a transcription of project data or it may be a summary of such data or memos, notes or passages written by the researcher. The text in a document can be coded, may be given values of document attributes and may be linked (via DataLinks) to other related documents, annotations, or external computer files. The Document Explorer shows the list of all project documents.
Memo: A document containing the researcher”s commentary flagged (linked) on any text in a Document or Node. Any files (text, audio or video, or picture data) can be linked via MemoLink.
Model: NVivo models are made up of symbols, usually representing items in the project, which are joined by lines or arrows, designed to represent the relationship between key elements in a field of study. Models are constructed in the Modeller.
Node: Relevant passages in the project”s documents are coded at nodes. A Node represents a code, theme, or idea about the data in a project. Nodes can be kept as Free Nodes (without organisation) or may be organised hierarchically in Trees (of categories and subcategories). Free nodes are free-standing and are not associated to themes or concepts. Early on in the project, tentative ideas may be stored in the Free Nodes area. Free nodes can be kept in a simple list and can be moved to a logical place in the Tree Node when higher levels of categories are discovered. Nodes can be given values of attributes according to the features of what they represent, and can be grouped in sets. Nodes can be organised (created, edited) in Node Explorer (a window listing all the project nodes and node sets). The Node Browser displays the node”s coding and allow the researcher to change the coding.
Project: Collection of all the files, documents, codes, nodes, attributes, etc. associated with a research project. The Project pad is a window in NVivo when a project is open which gives access to all the main functions of the programme.
Sets: Sets in NVivo hold shortcuts to any nodes or documents, as a way of holding those items together without actually combining them. Sets are used primarily as a way of indicating items that in some way are related conceptually or theoretically. It provides different ways of sorting and managing data.
Tree Node: Nodes organised hierarchically into trees to catalogue categories and subcategories.
References
- 1.Mays N, Pope C. Qualitative research in health care. Assessing quality in qualitative research. BMJ. 2000;320((7226)):50–2. doi: 10.1136/bmj.320.7226.50. [DOI] [PMC free article] [PubMed] [Google Scholar]
- 2.Harding G, Gantley M. Qualitative methods: beyond the cookbook. Fam Pract. 1998;15((1)):76–9. doi: 10.1093/fampra/15.1.76. [DOI] [PubMed] [Google Scholar]
- 3.Pope C, Mays N. In: Qualitative Methods in Health and Health Services Research. Mays N, Pope N, editors. London: BMJ; 1996. Qualitative research in health care. [DOI] [PMC free article] [PubMed] [Google Scholar]
- 4.Holloway I. Qualitative Research In Health Care. Maidenhead, England: Open University Press; 2005. [Google Scholar]
- 5.Basit TN. Manual or electronic? The role of coding in qualitative data analysis. Educational Research. 2003;45((2)):143–54. [Google Scholar]
- 6.Tashakkori A, Teddlie C. Handbook of Mixed Methods in Social and Behavioral Research. Thousand Oaks, California: Sage; 2003. [Google Scholar]
- 7.Bogdan RC, Biklen SK. Qualitative Research for Education: An Introduction to Theory and Methods. Boston: Allyn and Bacon; 1982. [Google Scholar]
- 8.Patton MQ. Qualitative Research & Evaluation Methods. 3rd. Thousand Oaks, Californa: Sage; 2002. [Google Scholar]
- 9.Dey I. Qualitative Data Analysis: A User-Friendly Guide for Social Scientists. London: Routledge; 1993. [Google Scholar]
- 10.Roberts KA, Wilson RW. ICT and the research process: issues around the compatibility of technology with qualitative data analysis. www.qualitative-research.net/fqs-texte/2-02-2-02robertswilson-e.pdf Forum Qualitative Sozialforschung. 2002;3((2)) [Google Scholar]
- 11.Wickham M, Woods M. Reflecting on the strategic use of CAQDAS to manage and report on the qualitative research process. The Qualitative Report. 2005;10((4)):687–702. [Google Scholar]
- 12.Richards L. Using Nvivo in Qualitative Research. London: Sage; 1999. [Google Scholar]
- 13.Pope C, Ziebland S, Mays N. Qualitative research in health care. Analysing qualitative data. BMJ. 2000;320((7227)):114–6. doi: 10.1136/bmj.320.7227.114. [DOI] [PMC free article] [PubMed] [Google Scholar]


