

Significance
Despite the importance of Wnt signaling in bone biology, there is a knowledge gap in the identity of the cells that produce the Wnt ligands and the functions of Wnts produced by specific cell types. In our study, we comprehensively characterized the expression patterns of all 19 Wnts in the developing mouse bone by in situ hybridization, and further showed that Osterix-expressing cells can produce Wnts and respond to Wnt signaling. Additionally, we found that Wnts produced by these Osterix-expressing cells regulate their differentiation and proliferation. Through providing a better understanding of how Wnt signaling contributes to bone biology, our findings also have clinical implications for the mechanism of the osteoporotic drug that targets Sclerostin, a Wnt signaling antagonist.
Keywords: Wnt, bone, development, Osterix, Wntless
Abstract
Wnt signaling is a critical regulator of bone development, but the identity and role of the Wnt-producing cells are still unclear. We addressed these questions through in situ hybridization, lineage tracing, and genetic experiments. First, we surveyed the expression of all 19 Wnt genes and Wnt target gene Axin2 in the neonatal mouse bone by in situ hybridization, and demonstrated—to our knowledge for the first time—that Osterix-expressing cells coexpress Wnt and Axin2. To track the behavior and cell fate of Axin2-expressing osteolineage cells, we performed lineage tracing and showed that they sustain bone formation over the long term. Finally, to examine the role of Wnts produced by Osterix-expressing cells, we inhibited Wnt secretion in vivo, and observed inappropriate differentiation, impaired proliferation, and diminished Wnt signaling response. Therefore, Osterix-expressing cells produce their own Wnts that in turn induce Wnt signaling response, thereby regulating their proliferation and differentiation.
Wnt signaling has been established as one of the pivotal pathways for osteolineage specification and development through genetic studies in humans and mice (1), but little is known about the identity of the sources of the Wnts. In humans, genetic mutations in Wnt pathway components have been associated with skeletal disorders. For example, children with inactivating mutations in lrp5, which encodes for a coreceptor for Wnt ligands, have very low bone mass (2). On the other hand, a gain-of-function mutation in lrp5 leads to high bone mass because LRP5 can no longer bind Sclerostin (SOST), which normally inhibits Wnt signaling by competing with Wnt ligands for binding to LRP5 (3). Over the past few years, two of the components essential for Wnt secretion, Wntless (GPR177/Evi/Ski) and Porcupine (4–9), have been associated with bone mineral density variation and skeletal development, respectively. SNPs in Wntless are linked to reduced bone mineral density (10, 11), and mutations in Porcupine are associated with focal dermal hypoplasia (12, 13), a disorder characterized by multiorgan abnormalities, including those of the skeleton. These findings further underscore the importance of studying the identity and role of Wnt-producing cells in bone development. Furthermore, the antibody blocking SOST is effective in ameliorating catabolic skeletal diseases, like osteogenesis imperfecta (14) and osteoporosis in rats (15), and improves fracture healing (16). Currently, the anti-SOST antibody is undergoing clinical trials in the treatment of osteoporosis and the preliminary results are promising (17). Thus, a comprehensive understanding of the mechanism of Wnt signaling in osteogenesis, including the sources of the Wnts, is of clinical relevance as well.
Osteolineage cells arise from multipotent mesenchymal progenitors, which subsequently give rise to osteolineage-restricted progenitors (18–23). In perinatal mice, Osterix (Osx) appears to be expressed by both populations (20, 21, 24) and continues to be expressed as the cells divide and differentiate into osteoblasts. Osteoblasts begin expressing Col1a1 at an immature stage, followed by Osteocalcin expression as they fully mature. The osteoblasts lay down the matrix, which later becomes the calcified bone, and some of them eventually get encased in the hardened matrix and become osteocytes (15, 25) (summarized in Fig. 1A). Blocking the ability to respond to Wnt signaling at any stage of the osteolineage ontogeny impedes bone formation or bone mass accrual, which could be a result of osteolineage-autonomous effects, or osteolineage cells modulating other cell types that also regulate bone mass, like the bone-resorbing osteoclasts (specialized macrophages) (26–32). Hence, Wnt signaling is established as an important pathway in osteolineage specification, differentiation, and bone mass accrual, primarily through the study of Wnt-responding cells.
Fig. 1.

A subset of Osx-expressing cells coexpress Axin2 and Wnt10b in the neonatal bone. (A) Schematic of osteolineage differentiation and markers associated with each stage. (B–D) Multiplex fluorescent ISH in neonatal wild-type femur, where positive signals appear as punctae. For ease of visualization, the Osx signal (white) has been removed in the right panels. In the trabecular bone (B), perichondrium (C), and cortical bone (D), cells that express Osx (white) commonly coexpress Axin2 (red) and Wnt10b (green). Yellow arrowheads in B point to Osx-expressing cells that coexpress Axin2 and Wnt10b. Autofluorescence is because of erythrocytes and cell cytoplasm. (Scale bars: 10 µm.) (Magnification: C, Inset, 1.9×; D, Inset, 2.1×.) (E) Proportion of sampled Osx-expressing population that expresses Axin2, Wnt10b, both or none (average ± SEM, n = 3). (F) Schematic of the neonatal bone, with the regions depicted in B–D indicated by boxes. See also Fig. S2 for ISH controls. CB, cortical bone; GP, growth plate; M, marrow; Pc, perichondrium; Ps, periosteum; TB, trabecular bone.
On the other hand, little is known about the identity of Wnt-producing cells in the bone. Although several transcriptome-profiling studies have been done, they used microdissected or whole bone samples that contained multiple cell types, and thus lacked precise positional and identity information of the Wnt-producing cells (33, 34). Therefore, histology-based approaches like RNA in situ hybridization (ISH) are more useful for identifying Wnt-producing cells. However, published ISH studies, which were restricted to a handful of Wnts, were limited by the resolution of conventional ISH and the lack of colabeling with marker genes to accurately identify the cells (35). Using a recently developed ISH assay with single-cell resolution (36), we conducted a comprehensive survey of all 19 Wnt genes to map their expression patterns and identify the Wnt-producing cells.
Moreover, the contributions of Wnts produced by specific cell types in bone development and physiology are poorly understood, as most of the studies on Wnt signaling in bone development have manipulated Wnt signaling at the level of the responding cell. To date, only a few studies have tried to delineate the requirement for Wnts secreted from specific cell types in the bone. Two of these studies showed that removing Wntless in differentiated osteoblasts results in insufficient bone mass accrual, suggesting that Wnts produced by osteoblasts have a role in promoting proper bone formation (37, 38).
In our study, we demonstrate that Osx-expressing cells can coexpress Wnt10b and Axin2, a target gene of β-catenin–mediated Wnt signaling (39), and Wnts derived from this population are involved in regulating their proliferation and differentiation.
Results
Osterix-Expressing Cells Express Wnt and Axin2.
We surveyed the expression of all 19 Wnt genes in the neonatal femur using an RNA ISH method that enables us to identify transcripts at the single-cell level (36). We found that multiple Wnts were expressed throughout the bone, mainly in cells lining the trabecular and cortical endosteal surfaces, within the perichondrium and periosteum. During development, osteolineage cells are commonly found in these regions, especially the perichondrium, where the precursors contribute to trabecular and cortical bone formation (40). Interestingly, various individual Wnts displayed distinct expression patterns in different parts of the bone (Fig. S1). For example, although Wnt10b is broadly expressed throughout the bone, Wnt4 expression is noticeably higher around the trabecular endosteum compared with the cortical endosteum, and Wnt7b is more highly expressed in the perichondrium than the trabecular and cortical bone regions. The overall most highly expressed Wnt gene is Wnt10b, which is widely considered one of the most important Wnts in bone biology (41–46). The overall expression levels of all of the Wnt genes are tabulated in Table S1 and ranked in Table S2. The general pattern is compatible with published transcription profiling results from microdissected and whole bone tissue samples (Table S2) (33, 34), thus giving confidence to our approach.
In addition, we identified Wnt-responding cells by expression of Axin2, a Wnt target gene (39). Similar to Wnt genes, Axin2 was widely expressed in cells lining the trabecular and cortical endosteal surfaces, the periosteum and within the perichondrium (Fig. 2 A–C).
Fig. 2.

AXCT2 labels a subset of Osx-expressing cells in the neonatal bone. (A–C) Axin2 mRNA expression in the trabecular bone region (A), cortical bone region (B), and perichondrium (C). (D) Tamoxifen administration in Axin2CreERT2(AXCT2); Ai6(Rosa26-STOPfl/fl-ZsGreen) mice induces a subset of Axin2-expressing cells and their progeny to express ZsGreen indelibly. (E) Flow cytometry analysis of cells from bones of P0–2 traced AXCT2;Ai6 mice. (F–I) Forty-eight hour trace of AXCT2;Ai6 mice labels cells (green) that commonly colocalizes with Osx expression (red, arrowheads) in the trabecular bone (F and G), perichondrium (H), and cortical bone (I). ZsGreen-labeled cells that do not colocalize with Osx are indicated by arrows. Many of the ZsGreen-labeled cells closely associated with bone surfaces are also found in close proximity to endothelial cells (stained with CD31/PECAM-1, white), which are usually found near bone structures. CB, cortical bone; GP, growth plate; M, marrow; Osx, osterix; Pc, perichondrium; Ps, periosteum; TB, trabecular bone. (Scale bars: 10 µm in A–C, 25 µm in F–I.)
To determine the relative locations of Wnt-producing and Wnt-responding cells, we used multiplex ISH to examine cells that express Axin2 and Wnt10b. Both transcripts often colocalized in cells expressing Osx, a commonly used marker for osteolineage cells expressed from the progenitor stage onwards (Fig. 1 B–D and Fig. S2). Specifically, 60.0 ± 1.1% of the Osx-expressing cells expressed both Axin2 and Wnt10b, 21.6 ± 9.3% expressed Axin2 only, and 9.4 ± 7.4% expressed Wnt10b only (n = 3) (Fig. 1E). These numbers are likely to be underestimations because of RNA degradation during processing and other technical limitations, and chondrocytes in the growth plates were excluded from the analysis. Thus, the Osx-expressing population can both produce and respond to Wnts.
Neonatal Wnt-Responding Stromal Population Contains Progenitors That Maintain the Osteolineage Over the Long Term.
As the Osx population has been shown to contain long-lived stromal progenitors that support osteogenesis (20, 21), our observation of the overlap in Axin2 and Osx expression (Fig. 1 B–D) prompted us to ask if the Axin2-expressing population contains osteolineage progenitors. Hence, we performed fate mapping of the Axin2-expressing cells using the Axin2CreERT2 (AXCT2) mouse, which has been used to identify Wnt-responsive stem and progenitor cells in multiple organs including the mammary gland, brain, inner ear, and skin (47–50). We pulsed AXCT2;Ai6 (ZsGreen reporter) mice (47, 51) with tamoxifen at postnatal day 0 (P0), and allowed them to age to various time points for up to a year (Fig. 2D).
To elucidate the identities of the Axin2-expressing cells that were initially labeled, we performed flow cytometry and immunostaining assays on AXCT2;Ai6 (ZsGreen reporter) mice (47, 51) traced for 48 h from P0 (Fig. 2 E–I). Flow cytometry analysis showed that the majority of AXCT2-labeled cells are CD45− Ter119− stromal cells (74.5 ± 6.1%, n = 3) (Fig. 2F). Costaining with antibodies against Osx and CD31/platelet endothelial cell adhesion molecule-1 (PECAM-1) revealed that many of the AXCT2-labeled cells express Osx, and mainly reside along the trabecular and cortical bone surfaces (especially in the primary spongiosa) in the perichondrium (Fig. 2 F–I, arrowheads), and in close association with blood vessels, which are often in proximity to bone structures (Fig. 2 F–I, arrowheads). There were also some AXCT2-labeled cells located in the same regions that were negative for Osx expression (Fig. 2 F–I, arrows). Notably, there were no Osteocalcin-coexpressing mature osteoblasts and osteocytes labeled by AXCT2 (Fig. 2 F–I and Fig. S3). Thus, the initial labeling with AXCT2 contained osteolineage cells that did not include differentiated cells like osteoblasts and osteocytes.
Within a month of initiating the trace, we routinely observed ZsGreen-labeled mature osteoblasts (identified by Osteocalcin immunostaining) and osteocytes in both cortical and trabecular regions (Fig. 3 A and B). The presence of ZsGreen-labeled osteoblasts and osteocytes persisted throughout the bone for up to a year (Fig. 3 A–A′′′ and B–B′′′), with no apparent preference for anatomical locations (Fig. S4). During this period, ZsGreen-labeled Osx+ cells were also observed (Fig. 3 C–C′′′). By 6 mo of age, although plenty of adipocytes were found in the femur, very few of them carried the ZsGreen label (Fig. S5). To control for spontaneous recombination, another set of AXCT2;Ai6 mice was injected with corn oil at P0 and traced for 1 y. The corn oil controls had some ZsGreen-labeled dendritic-like cells in the marrow (Fig. S6F, Inset), and very few ZsGreen-labeled cells along the endostea and within the bone (Fig. S6), indicating that very low frequency of spontaneous recombination in the osteolineage. Given that the average life span of a mature osteoblast is about 60 d (19), and the postmitotic status of both the mature osteoblasts and osteocytes, the persistence of these differentiated osteolineage cells during the lineage tracing implies the presence of self-renewing progenitors initially labeled by AXCT2. Therefore, the fate-mapping study shows that the neonatal stromal Wnt-responding population contains osteolineage progenitors that give rise to descendants capable of sustaining osteogenesis over the long term.
Fig. 3.

Axin2-expressing cells and their descendants contribute to the osteolineage during homeostasis and injury repair. Long-term fate mapping of AXCT2;Ai6 during homeostasis and repair. (A–C′′′) After 1 mo, ZsGreen-labeled osteoblasts (marked by osteocalcin expression in red, arrows) and osteocytes (embedded in bone, asterisks) appear in cortical (A) and trabecular (B) bone. ZsGreen-labeled osteoblasts and osteocytes are still present at 2 mo (A′ and B′), 6 mo (A′′ and B′′), and up to 1 y (A′′′ and B′′′) of tracing. ZsGreen-labeled Osx-expressing cells (arrowheads) also persist for up to 1 y (C–C′′′). (D) Timeline for tamoxifen injection, drill defect, EdU injection and sacrifice (n = 3). (E) An example of an uninjured collateral bone with intact cortical bone, showing the frequency of ZsGreen-labeled cells and paucity of ZsGreen-labeled cells harboring EdU. Immunostaining (Upper) and H&E staining (Lower) of a serial section. (F) An example of a callus at the regenerating site with EdU labeling (white) and Osx immunostaining (red) 2 wk postinjury. (G) Magnified view of part of the callus. Arrowheads point to ZsGreen-labeled cells that are also EdU+. (H) The callus has 2.6-times higher the proportion of cells that are ZsGreen-labeled than a corresponding cortical segment in the contralateral uninjured control. (I) There is a 6.6-fold increase in postinjury-derived (EdU+) ZsGreen-labeled cells in the callus than in the uninjured cortical bone. (J) A much larger fraction of the ZsGreen-labeled population in the callus express Osx compared with the control. (H–J) Two-tailed paired Student t test was used for statistical comparison. CB, cortical bone; Inj, injury site; M, marrow; mth, month; Osx, Osterix; P, periosteum; TB, trabecular bone; Tam, Tamoxifen. (Scale bars: 25 µm in A–C′′′, 100 µm in E and F, and 10 µm in G.)
Descendants of Wnt-Responding Osteolineage Cells Contribute to Bone Injury Repair.
Recent studies have shown that progenitors of the osteolineage can participate in bone tissue repair (18–20, 22). Thus, in addition to lineage tracing during homeostasis, we probed for progenitor activity in the AXCT2-traced population by asking if the progeny of neonatal AXCT2-labeled cells could contribute to bone injury repair in adulthood.
We pulsed newborn AXCT2;Ai6 pups with tamoxifen and performed unicortical 0.5-mm drill defects (through one side of the cortical bone) in the left femurs at 8 wk of age. To label cells that were derived postinjury, we administered EdU (5-ethynyl-2'-deoxyuridine) every other day (Fig. 3D) (n = 3). A new bone structure, called the callus, forms over the injury site within 2 wk after injury. We analyzed the callus to study the behavior of ZsGreen-labeled cells during injury repair, and used a comparable segment of the uninjured contralateral as the pairwise control (Fig. 3E).
In all three calluses, ZsGreen-labeled cells were found along the endosteal surfaces and within the bone as osteocytes (Fig. 3 F and G), indicating that the progeny of neonatal AXCT2-labeled cells had contributed to the repair process. In fact, there was a 2.6-fold increase in the proportion of cells in the calluses that carried the ZsGreen label (45.3 ± 2.8%) compared with the uninjured controls (17.1 ± 0.6%, P = 0.01) (Fig. 3H). Of these ZsGreen-labeled cells, the percentage of EdU+ cells was 6.6-times higher in the callus (19.4 ± 3.1%) than in the controls (2.9 ± 1.3%, P = 0.05) (Fig. 3I), indicating that a sizable proportion of the ZsGreen-labeled cells in the callus arose from proliferation postinjury. We also noticed a significantly larger fraction of Osx+ cells in the ZsGreen-labeled population in the calluses (5.48 ± 0.5%) than in the controls (0.1 ± 0.1%, P = 0.009) (Fig. 2J). In all, our observations suggest that in adulthood, the progeny of neonatal Wnt-responding stromal cells can participate in injury repair, likely through proliferation to give rise to more osteolineage cells. Taken together, the lineage traces during homeostasis and injury repair support that the neonatal Wnt-responding stromal population contains osteolineage progenitors.
Inhibition of Wnt Secretion in Osx-Expressing Cells Affects Differentiation and Reduces Proliferation in Vivo.
Given that the Osx-expressing cells produce Wnts, we went on to investigate the role of these Wnts during bone development. We generated mutant mice whose Osx-expressing cells were unable to secrete Wnts by crossing Osx-GFP::Cre to Wntlessfl/fl (hereafter named OW) (30, 52). Wntless (Wls) is required for Wnt secretion as it facilitates the endosomal transport of Wnts (4–6). In principle, in the OW mutants the Osx-GFP::Cre transgene will drive the excision of the first exon of Wls in every Osx+ cell. A thorough excision of Wlsexon1 in the Osx+ population is important because compensatory Wnts secreted from Osx+ cells with intact Wls alleles could dampen the severity of a potential phenotype. Immunostaining against Wls protein showed that there were much fewer Wls puncta associated with the Osx-expressing cells in the OW mutants than the controls (Fig. S7), indicating that Wls expression was largely knocked down in the OW mutants.
The OW mutants died within their first hour of birth, whereas their heterozygous littermates (Osx-GFP::Cre;Wlsfl/+, controls) survived and were indistinguishable from wild-type newborns (Fig. 4A). Hence, we used embryonic day (E) 18.5 embryos and living P0 pups for our studies. Comparing the gross morphology, multiple long bones from OW mutants were significantly shorter than the controls (by a range of 19–29%), and the mutant bones consistently appeared constricted (to varying degrees in different bones) in the middle of the developing diaphysis (shafts) (Fig. 4 B–L). In particular, all of the mutant ribs had a constriction, or even a kink, that was prone to breakage (Fig. 4F). The fragility of the mutant ribs likely explains why the OW mutants die shortly after birth. Moreover, the average number of Osx+ cells that could be recovered per OW mutant (5,215 ± 1,000 cells, n = 10 mice) was approximately half of that from a control (11,300 ± 2,450 cells, n = 11 mice, P = 0.039) (Fig. 4O). We went on to investigate the possible underlying reasons that could contribute to the shorter bones and smaller Osx-expressing population size observed in the OW mutants.
Fig. 4.

Inhibiting Wnt secretion in Osx-expressing cells in vivo results in shorter bones, fewer Osx-expressing cells, and aberrant differentiation. (A) Representative image of newborn control Osx-Cre::GFP;Wntlessfl/+ (Left) and mutant Osx-Cre::GFP;Wntlessfl/fl (OW) (Right) pups. (B–F) Whole-mount staining with Alizarin Red and Alcian Blue of control (Left) and OW mutant (Right) femurs (B), tibias (C), humeri (D), radii and ulnae (E), and ribs (F). (F) All of the ribs in the OW mutants had obvious constrictions, some of which were broken, suggesting a possible cause for the mutants’ deaths shortly after birth. (G–K) The lengths of the Alizarin Red-stained portions were quantified (as indicated by the red bracket in B) for femurs (G), tibias (H), humeri (I), radii (J), and ulnae (K) (n = 3 mutants and 3 littermate controls, from 3 litters). In all cases, the OW mutant bones were significantly shorter than the control bones by 28% (G), 29% (H), 21% (I), 16% (J), and 16% (K). (L–N) Von Kossa stain for mineralized bone. Note the calcified constriction in the middle of the shaft of mutant bone (arrowhead, L). (M) Magnified view of the shaft of a control bone stained with von Kossa (Upper) and H&E (Lower). (N) Magnified view of the diaphysis of mutant bone stained with von Kossa (Upper) and H&E (Lower). Arrows point to osteocytes. (O) The average number of Osx-GFP–expressing cells that can be recovered per mouse is significantly lower in Osx-GFP::Cre;Wlsfl/fl OW mutants (n = 10) than in Osx-GFP::Cre;Wlsfl/+ controls (n = 11, P = 0.039). (P) Col1a1 qPCR was performed on Osx-GFP+ cells isolated from OW mutants and controls by FACS. Col1a1 is expressed 1.9-fold in mutants (n = 5 pooled samples) compared with controls (n = 6 pooled samples, P = 0.04). (Q and R) Control (Left) and mutant (OW, Right) femurs stained for osteoclasts with TRAP assay (Q, dark purple) and with antibody against CD31/PECAM-1 for endothelial cells (R, brown). Both were counterstained with hematoxylin. Panels (i) and (iii) are views of entire bone sections, with the boxed regions shown at higher magnification in the lower panels (ii) and (iv). Gray arrowheads point to constrictions present in the mutants, black arrowheads point to osteoclasts (in Q) or endothelial cells (in R). There is much less trabecular bone structure in the OW mutants than in the controls. (A–R) The images within each panel are presented to the same scale for direct comparison. AB, aberrant bone (bone found in constriction region in mutant); CB, cortical bone; M, marrow; PS, periosteum; TB, trabecular bone. [Scale bars: 1 mm in B–F and L, 100 µm in M and N; in Q and R, scale bars represent 200 µm in panels (i) and (iii), 20 µm in panels (ii) and (iv).]
First, we asked if the osteolineage differentiation process was perturbed in the OW mutants. Staining with Von Kossa (for mineralized tissue) and H&E of the OW mutant femurs revealed that the constriction consisted of calcified bone (Fig. 4 L and N, Upper) that harbored osteocytes (Fig. 4N, Lower, arrows), indicative of an intact ossification process. The mutant femurs also had noticeably reduced marrow space, especially toward the middle of the diaphysis (Fig. 4 L and N). Hence, aberrant bone has formed in the OW mutant bones. In addition, quantitative RT-PCR (qPCR) of FACS-isolated Osx-GFP+ cells showed that cells from the OW mutants (n = 6 pooled samples) expressed Col1a1, an early osteoblast marker expressed downstream of Osx (24), at a higher level (1.86 ± 0.40-fold) than their counterpart from the controls (n = 5 pooled samples, P = 0.04) (Fig. 4P). To see if the OW mutant phenotype could have arisen from nonosteolineage cells, we examined the vasculature and osteoclasts as well, both of which are required for bone development. As far as we can tell, there is no overt difference in the distribution of the vasculature and osteoclasts between the OW mutants and the controls (Fig. 4 Q and R), suggesting that the underlying basis of the OW mutant phenotype is intrinsic to the osteolineage.
Second, we examined the proliferation and apoptosis status of the Osx-GFP+ cells in the noncartilaginous regions from the OW mutants. We found that the average proportion of Osx+ cells that were proliferating in the OW mutants (as determined by Ki67 expression) was reduced threefold (7.83 ± 1.34%, n = 5) relative to the controls (24.00 ± 2.32%, n = 4, P = 0.0004) (Fig. 5 A, B, and E). Although there was a significantly larger percentage of Osx+ cells in apoptosis in the OW mutants (1.08 ± 0.32%) than in the controls (0.18 ± 0.02% in controls, P = 0.043) (Fig. 5 C, D, and F), it is unclear whether the apparent low apoptosis rates could significantly account for the shorter bones and smaller Osx-GFP+ population.
Fig. 5.
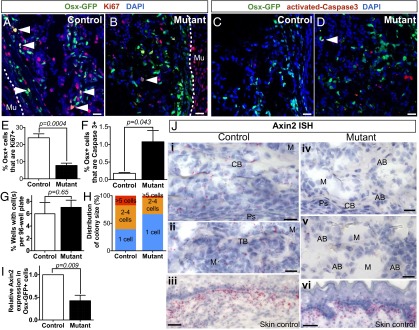
Inhibiting Wnt secretion in Osx-expressing cells causes reduced proliferation and Wnt signaling response. (A–D) Osx-GFP (green) costained with Ki67 (A and B, red), or activated-Caspase 3 (C and D, red) in control (A and C) and OW mutant (B and D) femurs. (A and B) Arrowheads point to Ki67-stained Osx-GFP+ cells. Comparable Ki67 staining in muscle of controls and mutants shows that reaction in Ki67+ cells was specific to Osx-expressing cells, dotted lines denote muscle-bone boundary. (C and D) Arrows point to Caspase 3-stained Osx-GFP+ cells. (E) The proportion of Ki67+ cells within the Osx-GFP+ population in mutants (n = 5) is threefold lower than that of the controls by immunostaining (n = 4). (F) The proportion of activated-Caspase 3+ cells within the Osx-GFP+ population in OW mutants (n = 5) is significantly higher than that of their corresponding heterozygote controls (n = 4), but remains low at around 1%. (G) Osx-GFP+ cells from E18.5 mutants (n = 4) or controls (n = 4) were plated singly in 96-well plates. After 2 wk, there was no significant difference between the number of wells with cells from the controls or mutants. (H) Cells from controls tended to form larger colonies, whereas cells from mutants often remained as single cells. (I) Axin2 is expressed 0.43-fold in Osx-expressing cells from the mutants (n = 3 pooled samples) relative to those from the controls (n = 3 pooled samples, P = 0.09). (J) Axin2 ISH in control (i and ii) and mutant bones (iv and v) (n = 2 mutants and 2 controls). The level of Axin2 signal in the skin of the mutant (vi) is similar to that of the control (iii), indicating that the reduction in Axin2 levels in the bone is specific to the tissue. See Fig. S8 for more controls. (E–I) P values of significance were derived from two-tailed Student t test. AB, aberrant bone (bone found in constriction region in mutant); CB, cortical bone; M, marrow; PS, periosteum; TB, trabecular bone. (Scale bars: 25 µm in A–D, and 10 µm in J.)
To assay for the effect of eliminating Wls in Osx+ cells at the single-cell level, we performed a clonogenic assay. From each E18.5 control or OW mutant embryo, one Osx+ cell was seeded per well of a 96-well plate (n = 4 OW mutants and 4 controls). Two weeks later, we counted the number of wells with one or more cells, as well as the number of cells in each occupied well. There was no significant difference in the average fraction of occupied wells per plate between the OW mutants (7.1 ± 1.0%) and controls (6.0 ± 1.6%, P = 0.65) (Fig. 5G). This finding suggests that the inability to secrete Wnt does not affect the ability of the Osx-GFP+ cells to survive in culture when seeded as single cells. However, cells from the controls generated noticeably larger colonies than those from the OW mutants based on the distribution of colony size. Specifically, from the controls, 44% and 17% of the total occupied wells contained two to four cells and five or more cells, respectively, whereas the corresponding numbers for the OW mutants were 30% and 4%. Moreover, 67% of the wells from the OW mutants remained as single cells, whereas only 39% from the controls contained one cell (Fig. 5H). Hence, Wnts secreted by Osx+ cells support the cells’ ability to expand ex vivo.
Next, to determine whether inhibiting Wnt secretion from Osx+ cells attenuated Wnt signaling response, we assayed for Axin2 expression in OW mutant and control bones using ISH and qPCR. Through ISH, Axin2 expression in the bony regions of the OW mutant femurs was markedly reduced compared with the controls, although Axin2 expression levels in the skin and prehypertrophic chondrocytes were similar between the OW mutants and controls (n = 2 per genotype) (Fig. 5J and Fig. S8). Furthermore, by qPCR, FACS-isolated Osx-GFP+ cells from the OW mutants (n = 3 pooled samples) expressed Axin2 at a significantly lower level (0.43 ± 0.1-fold) than the controls (n = 3 pooled samples, P = 0.009) (Fig. 5I). Both pieces of evidence show that although the Wnt signaling response is not completely eliminated, it is diminished in the absence of Osx+ cell-derived Wnts. Thus, Wnts produced in the Osx+ population promote their Wnt signaling response. In all, the in vivo data point to a role for Wnts produced by Osx+ cells in regulating the cells’ proliferation and differentiation, likely by inducing Wnt signaling response in the Osx+ cells.
Discussion
In view of the knowledge gap about the cells that provide the Wnt signals in the bone and the limitation it poses for our mechanistic understanding of Wnt signaling in the osteolineage, we set out to characterize the Wnt expression patterns in the developing bone in a comprehensive manner and investigate their contributions to the osteolineage. In our study, we identified Osx-expressing cells as Wnt-producing cells, and demonstrated that Wnts produced by these cells regulate their proliferation and differentiation.
Wnts Are Redundantly Expressed Throughout the Bone.
The lack of appropriate tools has hampered efforts to study Wnt-producing cells. Through a systematic ISH survey, we showed that multiple Wnts are expressed throughout the bone. The relative levels of Wnt expression are congruent with the results of transcriptome profiling studies (33, 34). Of note, our ISH data provide information about the anatomical regions where the Wnt genes are expressed, which is lacking in transcription profiling studies. Interestingly, there are distinct expression patterns for different Wnts in the separate anatomical regions, like the endosteum and perichondrium, suggesting that there could be subtle differences in regulation and functions of different Wnts.
The overlap in expression patterns of numerous Wnts likely explains the absence of a strong phenotype when a single Wnt is knocked out. Although Wnt10b and Wnt7b are two of the Wnts most commonly associated with bone biology, and Wnt10b is abundantly expressed based on our ISH survey (Wnt7b was moderately expressed), knocking out either Wnt did not produce a drastic skeletal phenotype: Wnt10b knockout mice exhibited mild age-progressive osteopenia (46) and Wnt7b knockout mice were viable and had reduced ossification (53). Hence, to observe more severe bone defects, multiple Wnts have to be knocked out simultaneously, or the Wnt secretion or posttranslational modification process has to be targeted to affect the availability of Wnt ligands. Indeed, we and others have shown that when Wnt secretion is inhibited in the specific populations in the osteolineage, marked phenotypes can be observed (37, 38).
Wnt-Responding Stromal Population Contains Long-Lived Osteolineage Progenitors.
Lineage tracing with Axin2, a Wnt target gene, initiated at the neonatal stage, showed that the Wnt-responding population contained stromal cells that were able to robustly contribute to bone development, maintenance, and injury repair over the long term. The in vivo fate and longevity of the Axin2-labeled population is similar to those observed from the lineage traces using Osx-CreERT (20, 21), suggesting significant overlap in the Wnt-responding and Osx-expressing stromal populations during the neonatal stage, both of which contain progenitors that contribute to the osteolineage over the long term.
OW Phenotype Likely Arises from the Undifferentiated Osteolineage Progenitors Instead of Their More Differentiated Derivatives and Chondrocytes.
Osx is also expressed in prehypertrophic chondrocytes (24), thus the OW phenotype could have resulted from perturbations in these cells. In another study, Wls was inactivated in all chondrocytes using the Col2-Cre (54). Besides abnormalities in the growth plates of the mutants, the bone was shorter because of delayed mineralization and osteolineage differentiation, distinct from our observations in the OW mutants. Hence, the OW phenotype is likely a result of perturbations within the osteolineage and not the chondrocytes.
Determining the precise cell of origin that resulted in the OW phenotype is not straightforward because of the heterogeneity in the Osx+ osteolineage population. Hence, it is possible that (i) although Wls was inactivated at the progenitor stage when Osx was first expressed, its function was only required later in the more differentiated stages, or (ii) as Osx is expressed in progenitors and more differentiated cells, the OW mutant phenotype could have been (at least partially) because of the inactivation of Wls in the osteoblast derivatives instead of the progenitor. The implication of both possibilities is the same: the OW phenotype is at least partially a result of the absence of Wls in differentiated osteolineage cells.
Two other studies have conditionally inactivated Wls in differentiated osteoblasts using Col1-Cre (38) and Osteocalcin-Cre (37). Both mouse models had lower bone mass relative to the controls, indicating a defect in bone mass accrual, and a diminished capability to mineralize. These observations are distinct from the improper differentiation and impaired proliferation phenotype in the OW mutant in our study. Therefore, it is reasonable to infer that the OW phenotype most likely results from the lack of Wls in at earlier predifferentiated stages, and not the differentiated derivatives of Osx+ cells.
The Use of Different Wntless Conditional Knockout Mouse Models Could Underlie the Different Phenotypes Observed in Different Studies.
A comprehensive study of Wls conditional knockouts (CKOs) using various Cre drivers of different states of osteolineage has been performed by Maruyama et al. (55). Interestingly, although they saw a mineralization defect in the bones of the Dermo1-Cre;Wls CKO mutants (Dermo1 marks mesenchymal progenitor cells), there was no obvious phenotype in the Osx-Cre;Wls nor the Col1a1;Wls CKO mutant. There was also no notable reduction in Axin2 reporter expression level in their Osx-Cre;Wls CKO mutant. Their results suggest that although Wls is required for proper bone development in the mesenchymal precursors, Wls is dispensable in relatively more differentiated osteolineage cells during early bone development.
In contrast, we observed a severe phenotype with our OW mutant along with decreased Axin2 transcript levels. In addition, in another study, Wan et al. (38) observed a lower bone mass in the postnatal Col1a1-Cre;Wls CKO mutants. It should be noted that all three studies used different Wls CKO mouse models: the Maruyama et al. (55) study used Wlsex2 CKO (56), Wan et al. (38) used Wlsex3 CKO (57), and we used Wlsex1 CKO, in which the ATG start site was also floxed, generated by a third group (52). In view of the discrepancies among the findings, it is important to resolve any differences arising from using different mouse models to ensure that the results are truly biologically relevant.
A Possible Mechanism for the Bone Anabolic Effect by Inhibiting Sclerostin, a Promising Drug Target.
SOST is bone-specific extracellular antagonist of Wnt signaling that has emerged as a promising drug target for bone catabolic diseases. It is secreted by osteocytes and acts on cells along the endosteal surfaces (58, 59), and inhibits the binding of Wnts to LRP5 (3, 60). The inhibitory effects of SOST on Wnt signaling and bone formation can be ameliorated by a monoclonal antibody, which has been shown to increase bone mass in postmenopausal women in clinical trials and improve fracture healing and osteogenesis imperfecta in animal models (14, 16, 17). Hence, it has garnered a lot of attention for its promise as a bone anabolic drug.
Because our study shows that Osx-expressing cells produce their own Wnts, which induce Wnt signaling response in these cells, it is possible that the osteo-anabolic effect of the anti-SOST antibody treatment could at least in part be because of its action on this population. Conceivably, inhibiting SOST would elevate Wnt signaling in the Osx+ cells, thereby allowing the population to expand and provide more ground material for building new bone. Therefore, our study has interesting implications for understanding how the behavior of Osx+ cells is regulated for proper skeletal growth and maintenance during development and homeostasis, as well as the mechanism of action of the anti-SOST drug in clinical settings.
Materials and Methods
Animals.
Axin2CreERT2 mice were previously described (47). Ai6 reporter (51), Osx-GFP::Cre (30), and Wntless conditional knockout (49) mice were obtained from The Jackson Laboratory. All experiments were approved by the Stanford University Animal Care and Use Committee (protocols # 8937 and #27460) and performed according to NIH guidelines.
Lineage Tracing Studies.
Tamoxifen (Sigma-Aldrich) was dissolved in 90% corn oil/10% (vol/vol) ethanol, and filtered through a 0.2-μm membrane. Newborn mice were injected with 1 mg tamoxifen subcutaneously (n = 3 or more per time point). Control mice were injected with the filtered corn oil/ethanol vehicle only (n = 2 or more per time point). Mice were killed at various time points by carbon dioxide asphyxiation.
Unicortical Drilling Injury Model.
Newborn mice were injected with 0.05 mg tamoxifen. At 8 wk of age, they received a unicortical drill defect of 0.5 mm in diameter in the cortex of the left femoral plateau. Specifically, with the mouse under 2% (vol/vol) isoflurane anesthesia, and after administration of intraperitoneal ketamine (80 mg/kg) and xylazine (16 mg/kg) the mouse was placed in a supine position, a longitudinal incision was made in the skin parallel to the long-bone, subcutaneous fat and muscles were divided parallel to muscle fibers, and a single 0.5-mm unicortical defect was made taking care not to damage the surrounding soft tissues and periosteum. Skin was subsequently closed and the mice monitored postoperatively according to protocol. Mice received EdU injections (5 mg/kg) (Life Technologies) every other day starting the day after receiving the drill defect and up till the day of killing.
Sample Processing.
For immunostaining, femurs collected were immediately fixed in 4% paraformaldehyde (wt/vol) overnight at 4 °C. The next day, they were decalcified in 19% EDTA, pH 7.4 [10% tetrasodium salt, 9% disodium salt (wt/vol)] for 10–14 d at 4 °C, changing every 3–4 d. The femurs were then incubated in 30% (wt/vol) sucrose at 4 °C overnight, then embedded in OCT. Femurs for ISH were processed the same way except that they were fixed in 10% (vol/vol) Neutral Buffered Formalin (NBF) at room temperature for 24 h.
Immunostaining.
Frozen samples were sectioned at 6um using CryoJane (Leica Microsystems). The slides were blocked in 5% (wt/vol) Normal Donkey Serum (Jackson ImmunoResearch Laboratories) in 5% (vol/vol) PBST (PBS with 0.02% Tween-20) at room temperature for 1 h, then stained with primary antibody diluted in blocking buffer overnight at 4 °C. The next day, the slides were washed in PBS 3 × 10 min, incubated in secondary antibody in blocking buffer for 1 h at room temperature, and washed in PBS 3 × 10 min before mounting on ProLong Gold DAPI (Life Technologies). The primary antibodies used were rabbit anti-Osterix (1:1,000; Abcam), rabbit anti-Osteocalcin (1:1,000; Clontech Laboratories), rabbit anti-Ki67 (1:100; Abcam), rabbit anti-activated Caspase 3 (1:100; Abcam), rabbit anti-Wntless/GPR177 (1:1,000; Abcam), chicken anti-GFP (1:1,000; Abcam) and Biotinylated CD31 (1:200; BD Biosciences). Anti–Rabbit-Cy3, anti–Chicken-AlexaFluor488, and Alexa Fluor 647-Strepravadin (all from Jackson ImmunoResearch) were used for the secondary antibody for immunofluorescent staining. For immunohistochemical research, sections were incubated with anti–rabbit-HRP (Bio-Rad) as secondary antibody, followed by visualization with DAB (3, 3′-diaminobenzidine) kit from Vector Laboratories.
Flow Cytometry Analysis.
Forelimbs and hindlimbs were isolated from AXCT2;Ai6 mice traced from P0 for 48 h. The bones were crushed and digested in 0.15% collagenase type II (Worthington Biochemical). The cell suspensions were stained with anti-CD45-APC (eBioScience) and anti–Ter119-PECy7 (eBioScience), then analyzed on FACSAriaII (BD Biosciences). The cells from AXCT2;Ai6 mice were pooled according to the litter. Three litters were analyzed, and statistics shown in the text were averages ± SEM.
EdU Visualization.
EdU staining was performed according to the kit instructions (Life Technologies) after the immunostaining procedure.
H&E Staining.
Cryosectioned slides were stained with Mayer’s Hematoxylin, blued in 0.02% ammonia water, stained in Eosin solution, further dehydrated up to 100% ethanol, cleared in Orange Terpene, then mounted with EcoMount (BioCare Medical).
Whole-Mount Skeletal Alizarin Red and Alcian Blue Staining.
Skeletal preps were processed according to published protocol (61). Three OW mutants and three littermate controls, from three different litters were used for quantification of the lengths of the calcified portion of the long bones. Statistics shown in text were averages ± SEM.
Von Kossa Staining.
Staining was performed on mineralized bone using 1% silver nitrate solution under strong UV, then washed with 5% (wt/vol) sodium thiosulfate, counterstained with Nuclear Fast Red, dehydrated, cleared with Orange Terpene and mounted with EcoMount.
TRAP Staining.
TRAP staining was performed according to instructions in Leukocyte Acid Phosphatase staining kit (Sigma).
Singleplex and Multiplex Fluorescent ISH.
All ISH experiments were carried out with RNAscope (ACDBio) (36) on wild-type neonatal femurs unless otherwise stated. After sectioning, the slides were placed in cold 10% (vol/vol) NBF for 10 min. They then went through washes of PBS 2 × 1 min, 50%/50% (vol/vol) ethanol/PBS 5 min, 70%/30% (vol/vol) ethanol/PBS 5 min, and 100% ethanol 2 × 5 min, 100% ethanol overnight at −20 °C. On the day of ISH, the slides were allowed to thaw for 30 min, then incubated in pretreatment 1 for 10 min at room temperature, pretreatment 2 for 10 min, and pretreatment 3 for 20 min at room temperature. The remainder of the procedure was carried according to instructions in the singleplex kit or the multiplex fluorescent kit.
Sequences of the probes used in the study are as follows: Wnt1 (NM_021279.4, 1204–2325), Wnt2 (NM_023653.5, 857–2086), Wnt2b (NM_009520.3, 1307–2441), Wnt3 (NM_009521.2, 134–1577), Wnt3a (NM_009522.2, 683–1615), Wnt4 (NM_009523.2, 2147–3150), Wnt5a (NM_009524.3, 200–1431), Wnt5b (NM_001271757.1, 319–1807), Wnt6 (NM_009526.3, 780–2026), Wnt7a (NM_009527.3, 1811–3013), Wnt7b (NM_009528.3, 1597–2839), Wnt8a (NM_009290.2, 180–1458), Wnt8b (NM_011720.3, 2279–3217), Wnt9a (NM_139298.2, 1546–2945), Wnt9b (NM_011719.4, 727–1616), Wnt10a (NM_009518.2, 479–1948), Wnt10b (NM_011718.2, 989–2133), Wnt11 (NM_009519.2, 818–1643), Wnt16 (NM_053116.4, 453–1635) and Axin2 (NM_015732.4, 330–1287).
In the singleplex ISH survey, the level of gene expression was qualitatively determined by comparing the intensity of ISH signal of each gene across the various anatomical locations, as well as with the other genes surveyed.
Quantification for multiplex fluorescent experiment was sampled from one image of the perichondrium, two images of the trabecular region, and two images of the cortical region (n = 3 mice). In each sample, the proportions of cells that expressed Axin2 or Wnt10b, or neither, within the Osx-expressing population were tabulated. For each population, the average percentage ± SD was presented in the pie chart.
Microscopy and Imaging.
All fluorescent immunostaining images were taken as z-stacks on the Leica SP8 Confocal Microscope (Leica Microsystems). The z-stacks were then processed using Maximal Projection on the LAS SF software. The fluorescent multiplex ISH images were taken on the Zeiss Cell Observer Spinning Disk Confocal Microscope (Carl Zeiss), then processed in Volocity in the Extended Focus view (PerkinElmer). The colorimetric images were taken on Zeiss Axio Imager 2 microscope. Tissue culture wells were imaged on Leica M80 stereo-microscope.
Quantified Analyses of Calluses and controls.
For each mouse, the entire callus and a corresponding segment of the cortical bone in the contralateral uninjured femur is imaged (n = 3). The percentage of ZsGreen-labeled cells in Fig. 3E is given by the number of ZsGreen-labeled cells divided by the total number of cells associated with the bone (number of DAPI-stained nuclei). The percentage of ZsGreen-labeled cells that carry the EdU label is given by the number of cells double labeled with EdU and ZsGreen divided by the total number of ZsGreen cells (Fig. 3F). The percentage of Osx-expressing cells in the ZsGreen population is given by the number of ZsGreen-labeled cells that also express Osx divided by the total number of ZsGreen-labeled cells (Fig. 3G). The statistical significances of the differences between the callus and uninjured control were calculated using two-tailed pairwise Student t test.
Quantified Analyses of Mutants.
The percentages of Osx-GFP+ cells that were in proliferation (Ki67) or apoptosis (activated-Caspase 3) were calculated by dividing the number of Osx-GFP+ cells that costained with Ki67 or Caspase 3 by the total number of Osx-GFP+ cells present in a whole section of an entire femur from a P0 or E18.5 mouse. Using the two-tailed Student t test, the numbers from Osx-GFP::Cre;Wlsfl/fl mutants (n = 5) were compared with those from their littermate controls Osx-GFP::Cre;Wlsfl/+ (n = 4). Statistics shown in text were averages ± SEM.
FACS Isolation of Osx-GFP Cells.
Forelimbs, hind limbs and spines were isolated from Osx-GFP::Cre E18.5 littermates that were either Wlsfl/+ or Wlsfl/fl. The bones were crushed and digested in 0.15% collagenase Type II (Worthington Biochemical). The cell suspensions were put through the FACSAriaII (BD Biosciences), and Osx-GFP::Cre-expressing cells were isolated by GFP expression. The GFP gate was set using a littermate negative for Osx-GFP::Cre. Cells for colony forming unit (CFU) assay were sorted into cell culture media, and cells for quantitative RT-PCR were sorted directly into TRIzol LS (Life Technologies). The number of Osx-GFP+ cells that could be recovered per mouse was given by the number of Osx-GFP expressing cells detected on the cytometer in an entire sample (n = 10 OW mutants and 11 controls). Numbers in the text were represented as averages ± SEM. P values of significance were calculated by two-tailed Student t test.
CFU Assay with Primary Cells.
For each embryo, one cell was sorted into each well of a 96-well plate containing cell culture media (10% FBS, 1% Penicillin-Streptomycin and glutamine in α-MEM media; Life Technologies). The cells were cultured for 2 wk in a 37 °C incubator, with a media change after 7 d. At the end of 2 wk, the cells were fixed with 10% NBF, and stained with 0.05% Crystal violet (Sigma) to visualize the cells. The number of wells with visible cells, and the number of cells within each well were counted. Two-tailed Student t test was used to calculate the significance of the difference in the observed number of CFUs between mutants and controls.
RNA Isolation and qPCR.
FACS-isolated cells were collected in TRIzol LS and pooled to attain sufficient cells for RNA isolation, which was carried out as written in the product protocol, with the addition of linear polyacrylamide (Life Technologies). The RNA was reverse transcribed using High Capacity Reverse Transcription Kit (Life Technologies), and qPCR was performed using duplex Taqman Gene Expression Assays (Axin2-FAM, Col1a1-FAM and TBP-VIC as endogenous control; Life Technologies) ran on 7900HT Fast Real-Time PCR System (Life Technologies). Relative expression levels of targets were calculated using the delta-delta CT method. The expression level of the mutants was normalized to that of the control. Significance of differences in relative expression levels were analyzed using two-tailed Student t test. Minus room temperature and no template controls were also performed.
Supplementary Material
Acknowledgments
We thank Catriona Logan for critical reading of the paper.
Footnotes
The authors declare no conflict of interest.
This article contains supporting information online at www.pnas.org/lookup/suppl/doi:10.1073/pnas.1420463111/-/DCSupplemental.
References
- 1.Regard JB, Zhong Z, Williams BO, Yang Y. Wnt signaling in bone development and disease: Making stronger bone with Wnts. Cold Spring Harb Perspect Biol. 2012;4(12):4. doi: 10.1101/cshperspect.a007997. [DOI] [PMC free article] [PubMed] [Google Scholar]
- 2.Gong Y, et al. Osteoporosis-Pseudoglioma Syndrome Collaborative Group LDL receptor-related protein 5 (LRP5) affects bone accrual and eye development. Cell. 2001;107(4):513–523. doi: 10.1016/s0092-8674(01)00571-2. [DOI] [PubMed] [Google Scholar]
- 3.Ellies DL, et al. Bone density ligand, Sclerostin, directly interacts with LRP5 but not LRP5G171V to modulate Wnt activity. J Bone Miner Res. 2006;21(11):1738–1749. doi: 10.1359/jbmr.060810. [DOI] [PubMed] [Google Scholar]
- 4.Bänziger C, et al. Wntless, a conserved membrane protein dedicated to the secretion of Wnt proteins from signaling cells. Cell. 2006;125(3):509–522. doi: 10.1016/j.cell.2006.02.049. [DOI] [PubMed] [Google Scholar]
- 5.Bartscherer K, Pelte N, Ingelfinger D, Boutros M. Secretion of Wnt ligands requires Evi, a conserved transmembrane protein. Cell. 2006;125(3):523–533. doi: 10.1016/j.cell.2006.04.009. [DOI] [PubMed] [Google Scholar]
- 6.Goodman RM, et al. Sprinter: a novel transmembrane protein required for Wg secretion and signaling. Development. 2006;133(24):4901–4911. doi: 10.1242/dev.02674. [DOI] [PubMed] [Google Scholar]
- 7.Fu J, Jiang M, Mirando AJ, Yu HMI, Hsu W. Reciprocal regulation of Wnt and Gpr177/mouse Wntless is required for embryonic axis formation. Proc Natl Acad Sci USA. 2009;106(44):18598–18603. doi: 10.1073/pnas.0904894106. [DOI] [PMC free article] [PubMed] [Google Scholar]
- 8.van den Heuvel M, Harryman-Samos C, Klingensmith J, Perrimon N, Nusse R. Mutations in the segment polarity genes wingless and porcupine impair secretion of the wingless protein. EMBO J. 1993;12(13):5293–5302. doi: 10.1002/j.1460-2075.1993.tb06225.x. [DOI] [PMC free article] [PubMed] [Google Scholar]
- 9.Takada R, et al. Monounsaturated fatty acid modification of Wnt protein: Its role in Wnt secretion. Dev Cell. 2006;11(6):791–801. doi: 10.1016/j.devcel.2006.10.003. [DOI] [PubMed] [Google Scholar]
- 10.Styrkarsdottir U, et al. European bone mineral density loci are also associated with BMD in East-Asian populations. PLoS ONE. 2010;5(10):e13217. doi: 10.1371/journal.pone.0013217. [DOI] [PMC free article] [PubMed] [Google Scholar]
- 11.Rivadeneira F, et al. Genetic Factors for Osteoporosis (GEFOS) Consortium Twenty bone-mineral-density loci identified by large-scale meta-analysis of genome-wide association studies. Nat Genet. 2009;41(11):1199–1206. doi: 10.1038/ng.446. [DOI] [PMC free article] [PubMed] [Google Scholar]
- 12.Grzeschik K-H, et al. Deficiency of PORCN, a regulator of Wnt signaling, is associated with focal dermal hypoplasia. Nat Genet. 2007;39(7):833–835. doi: 10.1038/ng2052. [DOI] [PubMed] [Google Scholar]
- 13.Wang X, et al. Mutations in X-linked PORCN, a putative regulator of Wnt signaling, cause focal dermal hypoplasia. Nat Genet. 2007;39(7):836–838. doi: 10.1038/ng2057. [DOI] [PubMed] [Google Scholar]
- 14.Sinder BP, et al. Sclerostin antibody improves skeletal parameters in a Brtl/+ mouse model of osteogenesis imperfecta. J Bone Miner Res. 2013;28(1):73–80. doi: 10.1002/jbmr.1717. [DOI] [PMC free article] [PubMed] [Google Scholar]
- 15.Li X, et al. Sclerostin antibody treatment increases bone formation, bone mass, and bone strength in a rat model of postmenopausal osteoporosis. J Bone Miner Res. 2009;24(4):578–588. doi: 10.1359/jbmr.081206. [DOI] [PubMed] [Google Scholar]
- 16.Taut AD, et al. Sclerostin antibody stimulates bone regeneration following experimental periodontitis. J Bone Miner Res. 2013;28(11):2347–56. doi: 10.1002/jbmr.1984. [DOI] [PubMed] [Google Scholar]
- 17.McClung MR, et al. Romosozumab in postmenopausal women with low bone mineral density. N Engl J Med. 2014;370(5):412–420. doi: 10.1056/NEJMoa1305224. [DOI] [PubMed] [Google Scholar]
- 18.Grcevic D, et al. In vivo fate mapping identifies mesenchymal progenitor cells. Stem Cells. 2012;30(2):187–196. doi: 10.1002/stem.780. [DOI] [PMC free article] [PubMed] [Google Scholar]
- 19.Park D, et al. Endogenous bone marrow MSCs are dynamic, fate-restricted participants in bone maintenance and regeneration. Cell Stem Cell. 2012;10(3):259–272. doi: 10.1016/j.stem.2012.02.003. [DOI] [PMC free article] [PubMed] [Google Scholar]
- 20.Mizoguchi T, et al. Osterix marks distinct waves of primitive and definitive stromal progenitors during bone marrow development. Dev Cell. 2014;29(3):340–349. doi: 10.1016/j.devcel.2014.03.013. [DOI] [PMC free article] [PubMed] [Google Scholar]
- 21.Liu Y, et al. Osterix-cre labeled progenitor cells contribute to the formation and maintenance of the bone marrow stroma. PLoS ONE. 2013;8(8):e71318. doi: 10.1371/journal.pone.0071318. [DOI] [PMC free article] [PubMed] [Google Scholar]
- 22.Zhou BO, Yue R, Murphy MM, Peyer JG, Morrison SJ. Leptin-receptor-expressing mesenchymal stromal cells represent the main source of bone formed by adult bone marrow. Cell Stem Cell. 2014;15(2):154–168. doi: 10.1016/j.stem.2014.06.008. [DOI] [PMC free article] [PubMed] [Google Scholar]
- 23.Méndez-Ferrer S, et al. Mesenchymal and haematopoietic stem cells form a unique bone marrow niche. Nature. 2010;466(7308):829–834. doi: 10.1038/nature09262. [DOI] [PMC free article] [PubMed] [Google Scholar]
- 24.Nakashima K, et al. The novel zinc finger-containing transcription factor osterix is required for osteoblast differentiation and bone formation. Cell. 2002;108(1):17–29. doi: 10.1016/s0092-8674(01)00622-5. [DOI] [PubMed] [Google Scholar]
- 25.Bilezikian JP, Raisz LG, Martin TJ. Principles of Bone Biology. Elsevier Science & Technology; Waltham, MA: 2008. [Google Scholar]
- 26.Day TF, Guo X, Garrett-Beal L, Yang Y. Wnt/beta-catenin signaling in mesenchymal progenitors controls osteoblast and chondrocyte differentiation during vertebrate skeletogenesis. Dev Cell. 2005;8(5):739–750. doi: 10.1016/j.devcel.2005.03.016. [DOI] [PubMed] [Google Scholar]
- 27.Hu H, et al. Sequential roles of Hedgehog and Wnt signaling in osteoblast development. Development. 2005;132(1):49–60. doi: 10.1242/dev.01564. [DOI] [PubMed] [Google Scholar]
- 28.Hill TP, Später D, Taketo MM, Birchmeier W, Hartmann C. Canonical Wnt/beta-catenin signaling prevents osteoblasts from differentiating into chondrocytes. Dev Cell. 2005;8(5):727–738. doi: 10.1016/j.devcel.2005.02.013. [DOI] [PubMed] [Google Scholar]
- 29.Holmen SL, et al. Essential role of beta-catenin in postnatal bone acquisition. J Biol Chem. 2005;280(22):21162–21168. doi: 10.1074/jbc.M501900200. [DOI] [PubMed] [Google Scholar]
- 30.Rodda SJ, McMahon AP. Distinct roles for Hedgehog and canonical Wnt signaling in specification, differentiation and maintenance of osteoblast progenitors. Development. 2006;133(16):3231–3244. doi: 10.1242/dev.02480. [DOI] [PubMed] [Google Scholar]
- 31.Kramer I, et al. Osteocyte Wnt/beta-catenin signaling is required for normal bone homeostasis. Mol Cell Biol. 2010;30(12):3071–3085. doi: 10.1128/MCB.01428-09. [DOI] [PMC free article] [PubMed] [Google Scholar]
- 32.Glass DA, 2nd, et al. Canonical Wnt signaling in differentiated osteoblasts controls osteoclast differentiation. Dev Cell. 2005;8(5):751–764. doi: 10.1016/j.devcel.2005.02.017. [DOI] [PubMed] [Google Scholar]
- 33.Andrade AC, Nilsson O, Barnes KM, Baron J. Wnt gene expression in the post-natal growth plate: Regulation with chondrocyte differentiation. Bone. 2007;40(5):1361–1369. doi: 10.1016/j.bone.2007.01.005. [DOI] [PMC free article] [PubMed] [Google Scholar]
- 34.Ayturk UM, et al. An RNA-seq protocol to identify mRNA expression changes in mouse diaphyseal bone: applications in mice with bone property altering Lrp5 mutations. J Bone Miner Res. 2013;28(10):2081–2093. doi: 10.1002/jbmr.1946. [DOI] [PMC free article] [PubMed] [Google Scholar]
- 35.Witte F, Dokas J, Neuendorf F, Mundlos S, Stricker S. Comprehensive expression analysis of all Wnt genes and their major secreted antagonists during mouse limb development and cartilage differentiation. Gene Expr Patterns. 2009;9(4):215–223. doi: 10.1016/j.gep.2008.12.009. [DOI] [PubMed] [Google Scholar]
- 36.Wang F, et al. RNAscope: A novel in situ RNA analysis platform for formalin-fixed, paraffin-embedded tissues. J Mol Diagn. 2012;14(1):22–29. doi: 10.1016/j.jmoldx.2011.08.002. [DOI] [PMC free article] [PubMed] [Google Scholar]
- 37.Zhong Z, et al. Wntless functions in mature osteoblasts to regulate bone mass. Proc Natl Acad Sci USA. 2012;109(33):E2197–E2204. doi: 10.1073/pnas.1120407109. [DOI] [PMC free article] [PubMed] [Google Scholar]
- 38.Wan Y, et al. Osteoblastic Wnts differentially regulate bone remodeling and the maintenance of bone marrow mesenchymal stem cells. Bone. 2013;55(1):258–267. doi: 10.1016/j.bone.2012.12.052. [DOI] [PubMed] [Google Scholar]
- 39.Jho EH, et al. Wnt/beta-catenin/Tcf signaling induces the transcription of Axin2, a negative regulator of the signaling pathway. Mol Cell Biol. 2002;22(4):1172–1183. doi: 10.1128/MCB.22.4.1172-1183.2002. [DOI] [PMC free article] [PubMed] [Google Scholar]
- 40.Maes C, et al. Osteoblast precursors, but not mature osteoblasts, move into developing and fractured bones along with invading blood vessels. Dev Cell. 2010;19(2):329–344. doi: 10.1016/j.devcel.2010.07.010. [DOI] [PMC free article] [PubMed] [Google Scholar]
- 41.Bennett CN, et al. Regulation of osteoblastogenesis and bone mass by Wnt10b. Proc Natl Acad Sci USA. 2005;102(9):3324–3329. doi: 10.1073/pnas.0408742102. [DOI] [PMC free article] [PubMed] [Google Scholar]
- 42.Bennett CN, et al. Wnt10b increases postnatal bone formation by enhancing osteoblast differentiation. J Bone Miner Res. 2007;22(12):1924–1932. doi: 10.1359/jbmr.070810. [DOI] [PubMed] [Google Scholar]
- 43.Zhou H, et al. Glucocorticoid-dependent Wnt signaling by mature osteoblasts is a key regulator of cranial skeletal development in mice. Development. 2009;136(3):427–436. doi: 10.1242/dev.027706. [DOI] [PubMed] [Google Scholar]
- 44.Zmuda JM, et al. Association analysis of WNT10B with bone mass and structure among individuals of African ancestry. J Bone Miner Res. 2009;24(3):437–447. doi: 10.1359/JBMR.081106. [DOI] [PMC free article] [PubMed] [Google Scholar]
- 45.Cawthorn WP, et al. Wnt6, Wnt10a and Wnt10b inhibit adipogenesis and stimulate osteoblastogenesis through a β-catenin–dependent mechanism. Bone. 2012;50(2):477–489. doi: 10.1016/j.bone.2011.08.010. [DOI] [PMC free article] [PubMed] [Google Scholar]
- 46.Stevens JR, et al. Wnt10b deficiency results in age-dependent loss of bone mass and progressive reduction of mesenchymal progenitor cells. J Bone Miner Res. 2010;25(10):2138–2147. doi: 10.1002/jbmr.118. [DOI] [PMC free article] [PubMed] [Google Scholar]
- 47.van Amerongen R, Bowman AN, Nusse R. Developmental stage and time dictate the fate of Wnt/β-catenin-responsive stem cells in the mammary gland. Cell Stem Cell. 2012;11(3):387–400. doi: 10.1016/j.stem.2012.05.023. [DOI] [PubMed] [Google Scholar]
- 48.Bowman AN, van Amerongen R, Palmer TD, Nusse R. Lineage tracing with Axin2 reveals distinct developmental and adult populations of Wnt/β-catenin-responsive neural stem cells. Proc Natl Acad Sci USA. 2013;110(18):7324–7329. doi: 10.1073/pnas.1305411110. [DOI] [PMC free article] [PubMed] [Google Scholar]
- 49.Lim X, et al. Interfollicular epidermal stem cells self-renew via autocrine Wnt signaling. Science. 2013;342(6163):1226–1230. doi: 10.1126/science.1239730. [DOI] [PMC free article] [PubMed] [Google Scholar]
- 50.Volkenstein S, et al. Transient, afferent input-dependent, postnatal niche for neural progenitor cells in the cochlear nucleus. Proc Natl Acad Sci USA. 2013;110(35):14456–14461. doi: 10.1073/pnas.1307376110. [DOI] [PMC free article] [PubMed] [Google Scholar]
- 51.Madisen L, et al. A robust and high-throughput Cre reporting and characterization system for the whole mouse brain. Nat Neurosci. 2010;13(1):133–140. doi: 10.1038/nn.2467. [DOI] [PMC free article] [PubMed] [Google Scholar]
- 52.Carpenter AC, Rao S, Wells JM, Campbell K, Lang RA. Generation of mice with a conditional null allele for Wntless. Genesis. 2010;48(9):554–558. doi: 10.1002/dvg.20651. [DOI] [PMC free article] [PubMed] [Google Scholar]
- 53.Tu X, et al. Noncanonical Wnt signaling through G protein-linked PKCdelta activation promotes bone formation. Dev Cell. 2007;12(1):113–127. doi: 10.1016/j.devcel.2006.11.00. [DOI] [PMC free article] [PubMed] [Google Scholar]
- 54.Lu C, et al. Wnt-mediated reciprocal regulation between cartilage and bone development during endochondral ossification. Bone. 2013;53(2):566–574. doi: 10.1016/j.bone.2012.12.016. [DOI] [PubMed] [Google Scholar]
- 55.Maruyama T, Jiang M, Hsu W. Gpr177, a novel locus for bone mineral density and osteoporosis, regulates osteogenesis and chondrogenesis in skeletal development. J Bone Miner Res. 2013;28(5):1150–1159. doi: 10.1002/jbmr.1830. [DOI] [PMC free article] [PubMed] [Google Scholar]
- 56.Fu J, Ivy Yu H-M, Maruyama T, Mirando AJ, Hsu W. Gpr177/mouse Wntless is essential for Wnt-mediated craniofacial and brain development. Dev Dyn. 2011;240(2):365–371. doi: 10.1002/dvdy.22541. [DOI] [PMC free article] [PubMed] [Google Scholar]
- 57.Zhu X, et al. Wls-mediated Wnts differentially regulate distal limb patterning and tissue morphogenesis. Dev Biol. 2012;365(2):328–338. doi: 10.1016/j.ydbio.2012.02.019. [DOI] [PubMed] [Google Scholar]
- 58.van Bezooijen RL, et al. Sclerostin is an osteocyte-expressed negative regulator of bone formation, but not a classical BMP antagonist. J Exp Med. 2004;199(6):805–814. doi: 10.1084/jem.20031454. [DOI] [PMC free article] [PubMed] [Google Scholar]
- 59.Winkler DG, et al. Osteocyte control of bone formation via sclerostin, a novel BMP antagonist. EMBO J. 2003;22(23):6267–6276. doi: 10.1093/emboj/cdg599. [DOI] [PMC free article] [PubMed] [Google Scholar]
- 60.Semënov M, Tamai K, He X. SOST is a ligand for LRP5/LRP6 and a Wnt signaling inhibitor. J Biol Chem. 2005;280(29):26770–26775. doi: 10.1074/jbc.M504308200. [DOI] [PubMed] [Google Scholar]
- 61.Nagy A, Gertsenstein M, Vintersten K, Behringer R. Alcian blue staining of the mouse fetal cartilaginous skeleton. Cold Spring Harbor Protocols. 2009;4(3):pdb.prot5169. doi: 10.1101/pdb.prot5169. [DOI] [PubMed] [Google Scholar]
Associated Data
This section collects any data citations, data availability statements, or supplementary materials included in this article.