

Abstract
Although the majority of Alzheimer's disease (AD) cases are sporadic, about 5% of cases are inherited in an autosomal dominant pattern as familial AD (FAD) and manifest at an early age. Mutations in the presenilin 1 (PSEN1) gene account for the majority of early-onset FAD. Here, we describe the generation of virus-free human induced pluripotent stem cells (hiPSCs) derived from fibroblasts of patients harboring the FAD PSEN1 mutation A246E and fibroblasts from healthy age-matched controls using nonintegrating episomal vectors. We have differentiated these hiPSC lines to the neuronal lineage and demonstrated that hiPSC-derived neurons have mature phenotypic and physiological properties. Neurons from mutant hiPSC lines express PSEN1-A246E mutations themselves and show AD-like biochemical features, that is, amyloidogenic processing of amyloid precursor protein (APP) indicated by an increase in β-amyloid (Aβ)42/Aβ40 ratio. FAD hiPSCs harboring disease properties can be used as humanized models to test novel diagnostic methods and therapies and explore novel hypotheses for AD pathogenesis.
Introduction
Alzheimer's disease (AD) is the most common neurodegenerative disorder in man and characterized by progressive cognitive impairments, including memory loss. Hallmark neuropathologies include widespread neuronal cell death in neocortex, limbic cortex, and amygdala, the extracellular deposition of β-amyloid (Aβ) in senile plaques and the intracellular aggregation of tau protein in the form of neurofibrillary tangles [1,2]. Aβ is a 40- to 42-amino acid peptide derived from the proteolysis of amyloid precursor protein (APP) through several related enzymatic pathways that involve α-, β-, and γ-secretases [3–5]. Although the etiology of AD is unknown, the amyloid cascade hypothesis [6] postulates that Aβ plaque formation is a critical pathogenic step and results from an overabundance of Aβ. Such excess is caused by mutations in the APP and presenilin 1 and 2 (PSEN1 and PSEN2) genes in early-onset AD. An insufficient proteolysis of Aβ is suspected as a mechanism of disease in late-onset AD. PSEN1 is located on chromosome 14 and encodes a multipass transmembrane protein that is the catalytic component of the γ-secretase complex. More than 100 mutations in PSEN1 result in an increase in Aβ42 to Aβ40 ratio and cause dominantly inherited early-onset AD [7–9].
The advent of human induced pluripotent stem cell (hiPSC) technologies with reprogramming of somatic cells has revolutionized the potential to generate any type of cell from normal and disease-affected individuals and to study mechanisms of pathology or to develop novel diagnostic and therapeutic tools [10]. Despite earlier predictions that these breakthroughs would be relevant only to developmental disorders, there has been a recent swell of articles on the use of hiPSCs for modeling neurodegenerative diseases [11–14]. Such models have now become available for AD using fibroblasts from patients with familial AD (FAD) and sporadic AD [15–17]. These hiPSC-based models allow the generation of human neural precursors or nerve cells with AD properties that can be used to create humanized in vitro AD models. They also allow an unprecedented level of cellular resolution and experimental versatility. These new opportunities are especially critical in the field of AD, which is in need of simple models to test large numbers of novel anti-amyloid and neuroprotective molecules and to explore novel hypotheses concerning disease mechanisms.
In the present study, we developed an in vitro humanized model of AD based on hiPSCs from the fibroblasts of two patients with early-onset FAD harboring the disease-causing PSEN1 mutation Ala246Glu (A246E) [7]. To avoid the persistent expression of reprogramming transgenes that may interfere with pathological analyses during differentiation [18–21], our study employed nonintegrating episomal vectors [12,22–24]. We demonstrate that these FAD patient-derived hiPSCs expressed the original pathogenic mutation and can be consistently differentiated into phenotypically and physiologically mature neurons with amyloidogenic properties. Our work confirms the power of hiPSC technology to contribute to in vitro models of AD and adds another important tool to increasingly popular stem-cell based approaches to explore pathogenesis and test novel biomarkers and therapies.
Materials and Methods
Pluripotent stem cell culture
The human embryonic stem cell (hESC) line H9 (WA09) [25] was obtained from the WiCell WISC Bank (Madison, WI). All hiPSC lines derived from AD patients (iPSCAD) and healthy individuals (iPSCWT) were generated from adult fibroblasts using a modified episomal reprogramming methodology [26]. Research was approved by the Johns Hopkins University Institutional Stem Cell Research Oversight (ISCRO) Committee for the use of hESC line H9 and by the Johns Hopkins Medicine Institutional Review Board (IRB) Committee as required by the Maryland Stem Cell Research Act of 2006. Tissue culture reagents were purchased from Life Technologies (Carlsbad, CA) unless otherwise stated. All cells were cultured at 37°C with 5% CO2.
Pluripotent stem cell lines were cultured as colonies on irradiated mouse embryonic fibroblast (MEF, E13.5 embryos from CF1 or DR4) using the hESC medium consisting of Dulbecco's modified Eagle's medium (DMEM)-F12, 15% knockout serum replacer, 1% nonessential amino acids (NEAA), 100 μM 2-mercaptoethanol, and 4 ng/mL human fibroblast growth factor 2 (FGF2; R&D Systems, Minneapolis, MN). Passaging was performed with collagenase type IV. For monolayer cultures, hPSCs were treated with TrypLE Select, and single cells were plated into T25 flasks (BD Biosciences, Bedford, MA) coated with a 1:400 dilution (200 μL/cm2) of Geltrex. Cells were seeded at a concentration of 1.25×10⁶ cells per T25 flask and cultured in the conditioned medium prepared as previously described [26]. Confluent cultures were passaged every 3 days after treatment with TrypLE Select.
Reprogramming of human adult fibroblasts with episomal vectors
Virus-free hiPSC lines were derived using nonintegrating episomal vectors to express the OCT4, SOX2, NANOG, KLF4, MYC, LIN28, and SV40LT reprogramming factors. Specifically, fibroblasts were nucleofected with the EBNA-based pCEP4 plasmid vectors pEP4 EO2S EN2L (OCT4, SOX2, NANOG, LIN28), pEP4 EO2S ET2K (OCT4, SOX2, SV40LT, KLF4), and pEP4 EO2S EM2K (OCT4, SOX2, MYC, KLF4) [22] with modifications as previously described [26–28]. Episomal vectors were obtained from Addgene, Inc. (Cambridge, MA). For the generation of human iPSCAD lines, fibroblasts from two AD donors, one 56-year-old male and one 56-year-old female, both carrying the missense mutation Ala246Glu (A246E) in the PSEN1 gene (Supplementary Table S1; Supplementary Data are available online at www.liebertpub.com/scd) were obtained from the Coriell Institute for Medical Research (Camden, NJ) and cultured in the fibroblast medium consisting of DMEM/10% fetal bovine serum (FBS). Control fibroblasts were taken from gender- and age-matched healthy individuals (Supplementary Table S1) and were reprogrammed to iPSCWT lines using methods identical to those employed for patient fibroblasts.
For reprogramming, 1×10⁶ fibroblasts were conucleofected with 2 μg each of the three episomal plasmids using a Nucleofector II, Human Dermal Fibroblasts Kit (VPD-1001) and the program U023 (Lonza, Walkersville, MD). Cells were subsequently plated on irradiated MEF-seeded dishes in the fibroblast medium. After 3 days, the fibroblast medium was replaced with the hESC medium containing 40 ng/mL FGF2. On day 10, when MEFs began to deteriorate, the medium was replaced daily with the MEF-conditioned medium supplemented with 40 ng/mL FGF2. After 21 days, bulk cultures were passaged onto fresh irradiated MEF. Emerging colonies with morphology similar to hESCs were picked manually, subcloned, and expanded for further characterization as previously described [27].
Immunocytochemistry for pluripotency markers
Pluripotent stem cell colonies were washed in phosphate-buffered saline (PBS) and fixed in 4% paraformaldehyde. After washing twice with PBS, cells were blocked with 5% donkey serum (Sigma-Aldrich, St. Louis, MO) and 0.2% Triton-X (Sigma-Aldrich) in PBS for 1 h at room temperature and incubated overnight at 4°C with anti-human NANOG (1:500, goat IgG1; R&D Systems), anti-human OCT4 (1:200, mouse IgG1; Millipore, Billerica, MA), anti-human stage-specific embryonic antigen-4 (SSEA4, 1:200, mouse IgG1; BD Biosciences), and anti-human TRA-1-60 (1:200, mouse IgM; Millipore). Cells were washed thrice in PBS/Triton and incubated for 1 h at room temperature in the dark with the following secondary antibodies: Cy3-conjugated donkey anti-goat IgG1 (1:1000; Jackson ImmunoResearch, West Grove, PA), Alexa Fluor 488-conjugated goat anti-mouse IgG1 (1:500; Invitrogen, Carlsbad, CA), and Alexa Fluor 488-conjugated goat anti-mouse IgM (1:500; Invitrogen). Cells were then washed thrice in PBS, counterstained with 4′,6′-diamidino-2-phenylindole (DAPI; Invitrogen), and studied with a Zeiss epifluorescence microscope.
Teratoma assays
Teratoma assays were performed as previously described [29]. Briefly, each hiPSC line was expanded onto growth factor-reduced Matrigel (BD Biosciences) with the MEF-conditioned medium. Induced PSCs from one or two 6-well plates at ∼90% confluency were treated with collagenase IV, resuspended in a mixture of the hESC medium and Matrigel (1:1), and injected into the thigh muscles or subcutaneously into 8- to 10-week-old immunodeficient NOG (NOD/Shi-scid/IL-2Rγnull)-SCID mice. Teratomas were harvested 8–10 weeks later and fixed overnight in 4% paraformaldehyde at 4°C. Tissues were embedded in paraffin, sectioned, and stained with hematoxylin and eosin.
Southern hybridization
Genomic DNA (5 μg) from hiPSC samples and control hESCs were digested with SpeI and BamHI. Undigested “combination 6” [23] episomal vectors corresponding to 0.4× and 4× integrations per genome were used as positive controls. The episomal vector pCEP4 backbone was labeled with DIG High Prime DNA using the Detection Starter Kit II (Roche Applied Biosciences, Indianapolis, IN); the labeled sequence was used as probe. Southern blotting was performed as previously described [27].
Genomic PCR, semiquantitative RT-PCR, and real-time qRT-PCR for hiPSC lines
Genomic PCR and gene expression analysis were performed as previously described [27]. Briefly, DNA was extracted with the DNeasy Blood & Tissue, and RNA isolated with RNA RNeasy Mini Kits (Qiagen, Valencia, CA) from early passage (passage 15–18) control- and AD-derived hiPSC cultures. H9 ESCs (p48) were used as negative controls, whereas transfected fibroblasts of early passage (p2) were used as positive controls. Reverse transcription to cDNA was performed with the SuperScript III First-Strand Synthesis System for RT-PCR (Invitrogen) and Oligo (dT) primers (Invitrogen). All PCR reactions were conducted with Pfx DNA polymerase (Invitrogen). Real-time qPCR was performed with the Power SYBR PCR Mastermix (Applied Biosystems, Foster City, CA). Primers for genomic PCR and RT-PCR analysis were performed as previously described [22,27].
To check the presence of the mutant PSEN1 transcript in iPSCAD, the PSEN1 RT-PCR fragments around mutation area were amplified by Taq polymerase (Invitrogen), purified with the Qiagen gel extraction kit (Qiagen), digested with DdeI (Promega, Madison, WI), and analyzed on 3% agarose gels. Primers for the identification of the mutation were previously described [7]. To identify the point mutation, the RT-PCR fragments was subcloned to TA cloning vector (Invitrogen) and the plasmids DNA was subjected to DNA sequencing.
Karyotype analysis
Karyotyping analysis by G-banding was carried out in the Cytogenetics Core Facility at the Johns Hopkins Hospital. Induced PSC lines were cultured on Matrigel with the conditioned medium to avoid MEF contamination. Twenty metaphase cells per line were analyzed using standard methods for high-resolution G-banding.
Flow cytometry analysis
Human ESC and hiPSC cultures were dissociated enzymatically to single cells, passed through a 40-μm filter, gently resuspended in PBS containing 5% FBS, and stained with optimal concentration of primary antibodies for 30 min on ice. Antibodies included APC-conjugated SSEA4 (R&D Systems), Phycoerythrin (PE)-conjugated mouse anti-human TRA-1-60 antigen (BD Biosciences), and PE-conjugated mouse anti-human TRA-1-81 antigen (BD Biosciences). Cells were washed twice in 5% FBS in PBS and analyzed by flow cytometry (BD Biosciences). FlowJo software (Tree Star, Ashland, OR) was used to analyze the flow cytometry data.
Expression and CpG DNA methylation microarrays
Total RNA from hESC lines, parental fibroblasts, and iPSCWT and iPSCAD lines was amplified and labeled using the Illumina TotalPrep RNA Amplification Kit (AMIL1791; Ambion, Austin, TX) following the manufacturer's instructions. Expression microarray hybridizations were performed on HumanHT-12Expression BeadChip arrays (Illumina, San Diego, CA) using standard protocols. For DNA methylation studies, DNA samples were analyzed using the Illumina Infinium Human DNA Methylation27 BeadChip (Illumina) according to the manufacturer's instructions. This method detects cytosine methylation of 27,578 CpG sites covering more than 14,000 genes. DNA methylation levels were obtained as β-values using a scoring system ranging from 0 (completely unmethylated) to 1 (fully-methylated).
Gene expression fluorescent intensity signal values and methylation β-values were obtained from the Illumina Genome Studio and further processed on the Partek Genomics Suite (Partek, Inc., St. Louis, MO) and Spotfire Decision Site (TIBCO Spotfire, Inc., Somerville, MA) software platforms. Before the analysis of variance of log2 signals [principal component analysis (PCA) plots] and β-values of all cell lines, genes mapped to the X and Y sex chromosomes were filtered out. Since there was an uneven representation of the two genders in the iPSCAD and iPSCWT groups, only autosomal differences were evaluated among AD, WT, and hESC groups of cell lines. All samples for gene arrays were processed at the Sidney Kimmel Comprehensive Cancer Center Microarray Core Facility at the Johns Hopkins University School of Medicine (Baltimore, MD).
Neural differentiation of hiPSCs via embryoid body formation
Neural differentiation of embryoid bodies (EBs) was performed with standard methods, essentially as described [30]. Briefly, hiPSCs were propagated as colonies on irradiated MEFs [25]. To induce neuroectodermal differentiation, colonies were detached by dispase treatment (1 mg/mL). Clumps were grown in suspension for 4 days in the hESC medium without FGF2. Floating EBs (about 50 per flask) were maintained in a tissue culture flask with the Neural Induction Medium [DMEM-F12, supplemented with 1% N2, 1% NEAA, 0.2% heparin (StemCell Technologies, Vancouver, BC, Canada) and 20 ng/mL FGF2]. After 3 days, the EBs were plated onto polyornithine/laminin-coated plates. About 8–10 days after differentiation of EBs, cells formed well-defined neural rosettes.
In addition, we employed a forced aggregation method for EB formation. To this goal, PSC lines were cultured in feeder-free conditions as monolayers with the conditioned medium and passaged every 3 days as described previously. For the production of uniform-size EBs, PSCs grown for 3–10 passages were passaged as single cells and seeded at 2.5×10⁶ cells per T25 flask. Next day, cells were counted and seeded at 5,000 cells per well in 96-well, V-bottom uncoated plates (249952; NUNC, Rochester, NY). For induction of neural differentiation, EBs were grown in suspension for 10 days followed by adherence to Matrigel-coated plates in the Neurobasal (NB) complete medium consisting of 94% Neurobasal medium (v/v), 2 mM l-glutamine, 0.1% bovine serum albumin (Fraction V; Sigma-Aldrich), 1% NEAA, 2% B27 without retinoic acid, 1% N2 supplement, 100 ng/mL noggin (Sigma-Aldrich) throughout culture, and 10 μM SB431542 (Tocris Bioscience, Bristol, United Kingdom) only for the first 5 days. Numerous late rosette structures were formed 3 days after the adherent culture of EBs. The forced aggregation methodology was the primary method used for the generation of neurons and characterizing their phenotypic, functional, and amyloidogenic features.
Isolation and culture of neural precursor cells
Neural rosettes were manually collected with stretched glass Pasteur pipettes and expanded either as monolayer cultures of neural precursors or as cell aggregates in suspension with the neurosphere proliferation medium. For monolayer cultures, EB-derived neural rosettes were dissociated into single cells with Accutase for 5 min at 37°C and plated on polyornithine/laminin-coated plates in the NB complete medium supplemented with FGF2 (20 ng/mL) and epidermal growth factor (EGF) (20 ng/mL; PeproTech, Rocky Hill, NJ). Cells were expanded for several passages as a homogeneous population of neural precursors.
For the formation of neurospheres, neural rosettes were detached from the surrounding flat cells as clusters after incubation with dispase (0.1 mg/mL) at 37°C for 20 min. The clumps were gently triturated with a 5-mL pipette and cultured into uncoated tissue culture flasks to prohibit attachment with the neurosphere proliferation medium consisting of DMEM/Hams F12 supplement (3:1), 2% B27 supplement, 2 mM l-glutamine, FGF2 (20 ng/mL), EGF (20 ng/mL), and heparin (5 μg/mL) at 37°C, 5% CO2, and atmospheric oxygen levels. Neurospheres were split 1:2 every other week by trituration. Neuronal differentiation was induced by plating the neurosphere-derived neural precursors on polyornithine/laminin-coated plates with the NB complete medium in the absence of mitogens or with the differentiation medium [DMEM-F12, 1% N2, 1% B27, 1 mM dibutyryl-cyclic AMP (Sigma-Aldrich), 200 nM ascorbic acid (Sigma-Aldrich), 20 ng/mL brain-derived neurotrophic factor (BDNF), and 20 ng/mL glial cell line-derived neurotrophic factor (GDNF)]. Human iPSC-derived neurons were differentiated for about 1–2 months.
Characterization of neurally differentiated hiPSC lines with quantitative real-time RT-PCR
Neural precursors and mature neurons derived from hiPSC lines were characterized for neural gene expression. RNA extraction from cultures of three iPSCWT (WT2, WT4, and WT22) and five iPSCAD (AD1, AD6, AD10, AD36, and AD38) lines was carried out using the RNeasy Mini Kit (Qiagen) with one-column DNA digestion. Quantitative real-time PCR (qPCR) was performed as previously described (22, 27) with primer sequences shown in Supplementary Table S2. All the reactions were carried out with experimental triplicates using an iQ5 Multicolor qPCR detection system (Bio-Rad, Hercules, CA), with SYBR Green (Applied Biosystems) as fluorescent dye and normalized to GAPDH mRNA levels. Experiments were performed in biological triplicates for each of the eight cell lines, and the data are presented as mean±standard deviation.
Expression levels of the neural stem/progenitor marker Nestin and the pan-neuronal marker MAP2 were used to further normalize the expression of neuroepithelial (positional) and regional, neurotransmitter and synaptic neuronal markers for each one of the differentiated cell lines. Levels for each of the differences in values of transmitter markers between iPSCWT (WT2, WT4, and WT22) and iPSCAD (AD1, AD6, AD10, AD36, and AD38) lines were determined for by two-tailed Student's t-test, with P-values lower than 0.05 considered statistically significant. Statistical calculations were performed using GraphPad Prism4 software (San Diego, CA).
Characterization of neuronally differentiated hiPSC lines with immunocytochemistry
Neural precursor and neuronal cultures derived from hiPSCs were rinsed with PBS and fixed with freshly depolymerized, neutral-buffered 4% paraformaldehyde for 15 min. After fixation, cells were rinsed twice with PBS, incubated for 1 h in the blocking solution (3% normal goat or donkey serum and 0.2% Triton X-100 in PBS), and primary antibodies were applied in the blocking solution overnight at room temperature. Primary antibodies were directed against the neural progenitor marker nestin (1:200, mouse anti-human nestin IgG1; Millipore), the neuronal marker class III β-tubulin (1:600, rabbit polyclonal anti-TUJ1; Covance, Princeton, NJ), the neuronal marker MAP2 (1:250, mouse IgG; Sigma-Aldrich), the astrocyte marker glial fibrillary acidic protein (GFAP) (1:1,000, rabbit polyclonal; Novus), the cortical neuron markers special AT-rich sequence-binding protein 2 (SATB2) (1:800, mouse monoclonal; Abcam, Cambridge, United Kingdom) and T-brain-1 (Tbr1) (1:800, rabbit polyclonal; Abcam), and the synaptic marker synapsin (1:1,000, rabbit polyclonal anti-Synapsin I; Millipore). Cells were then washed with 0.1% Triton X-100 in PBS and treated with secondary antibodies coupled to Cy2 or Cy3 (1:400; Jackson ImmunoResearch) for 1 h. Cells were subsequently washed twice in PBS and stained with DAPI. In control cultures, primary antibodies were omitted from the immunocytochemistry (ICC) procedure. Cells were studied with epifluorescence microscopy.
Electrophysiology of neuronally differentiated hiPSC lines
Whole-cell patch-clamp recordings were made with glass pipettes pulled on a P-97 electrode puller (Sutter Instruments, Novato, CA). The resistance of the pipettes was 3–5 MΩ when filled with an intracellular solution (135 mM KCl, 2 mM MgCl2, 10 mM HEPES, 5 mM EGTA, 2 mM Mg-ATP, 0.3 mM NaGTP, and 10 mM phosphocreatine, pH 7.25 adjusted with KOH). Coverslips were superfused at a rate of 2 mL/min with an external bath solution containing the following: 150 mM NaCl, 2.5 mM KCl, 10 mM HEPES, 10 mM d-glucose, 2 mM CaCl2, and 1 mM MgCl2, pH 7.3–7.4. Experiments were performed at room temperature (22°C–24°C). Currents from cells were monitored with an Axopatch 200B amplifier (Molecular Devices, Sunnyvale, CA) and acquired through Digidata 1440A (Molecular Devices) onto a computer using pClamp 10 software (Molecular Devices). All chemicals used for electrophysiological recordings were purchased from Sigma-Aldrich. All drugs and solutions were made fresh from stock solutions.
Aβ peptide quantitation by ELISA
Conditioned media of differentiated neurons derived from iPSCAD and iPSCWT lines were collected after 48 h of incubation and diluted in assay buffer. Aβ40 and Aβ42 levels in cell media were measured with human Aβ (1–40 and 1–42) ELISA kits (Invitrogen) according to the manufacturer's instructions. Aβ levels were normalized for total protein content and relative levels of the mature neuronal marker MAP2. Western blot analysis was used to determine the relative levels of MAP2 protein in adherent cell lysates of iPSC-derived neuronal cultures. Levels of MAP2 protein were measured by densitometry and normalized by GAPDH content in the same extracts. Levels of Aβ42 and Aβ40 from iPSCAD lines were pooled and compared with the pooled levels from control (iPSCWT) lines. Statistical analysis was performed using the nonparametric Mann–Whitney test (also known as the Wilcoxon two-sample test). ELISA experiments were performed in triplicate, and the results were expressed as mean±standard error.
Results
Derivation and characterization of virus-free hiPSC lines from fibroblasts of AD patients and controls
Virus-free hiPSCs were generated from adult human skin fibroblasts of two patients carrying the PSEN1 A246E mutation as well as gender- and age-matched healthy adults. For the generation of these hiPSC lines, we used an EBNA-based, three-plasmid, seven-factor episomal system (SOKMNLT; SOX2, OCT4 [POU5F1], KLF4, MYC, NANOG, LIN28, and SV40LT) originally employed in the reprogramming of neonatal fibroblasts [22] and recently modified for reprogramming of a variety of starting human cells, including adult fibroblasts [26,28].
A number of hiPSC lines from both AD-affected and normal fibroblasts were generated, and some of them were selected for expansion and characterization (Supplementary Table S1). Induced PSC colonies demonstrated typical hESC morphology with cells that were tightly packed; such colonies have well-defined borders and cells with high nucleus-to-cytoplasm ratio and prominent nucleoli (Fig. 1A). AD- and normal-derived hiPSC clones (named iPSCAD and iPSCWT, respectively) were subcloned for more than 10 passages before their characterization and confirmation for loss of episomal reprogramming plasmids. Flow cytometry analysis showed that these hiPSC clones expressed the surface pluripotency markers SSEA4, TRA-1-60, and TRA-1-81 at levels similar to the control hESC line H9 (Supplementary Fig. S1A). All hiPSC clones evaluated in these studies were also shown to express SSEA4, TRA-1-60, TRA-1-81, and OCT4 by ICC analysis (Supplementary Fig. S1B).
FIG. 1.

Generation of human induced pluripotent stem cell (hiPSC) lines from Alzheimer's disease (AD) patients and healthy individuals with nonintegrating episomal vectors. (A) Representative images of passage 24 (p24) iPSCWT4 (left) and iPSCAD10 (right) cell lines with compact colony appearance, large nuclei, and prominent nucleoli typical of human embryonic stem cells (hESCs). Bottom panels are higher magnifications of hiPSC colonies similar to the ones shown on top panels. Scale bars: 200 μm. (B) Genomic PCR (left panel) and RT-PCR (right panel) of WT and AD hiPSC lines at passages 15–18. The hESC line H9 (p48) was used as a negative control and early hiPSC cultures from p2 (Bulk p2), containing residual episomal vector sequences, served as a positive control. (C) Genomic Southern blot analysis of WT and AD hiPSC lines indicates that episomal vector backbone sequences are absent in all hiPSC clones. “Combination 6” episomal vector DNA was diluted as positive control to the equivalents of 0.4 and 4 integrations per haploid genome (0.4× and 4×). Marker: 1 kb Plus ladder. (D) Representative hematoxylin and eosin-stained sections of teratomas derived from iPSCWT4 and iPSCAD6 lines after injection into immunocompromised (NOD/Shi-scid/IL-2Rγnull)-SCID mice. These sections demonstrate pluripotent differentiation to ectoderm (neural tissue, arrows), endoderm (glandular epithelium, arrowheads), and mesoderm (cartilage, arrows). Scale bars: 100 μm. (E) Expression of endogenously expressed pluripotency-associated transcripts of WT and AD hiPSC lines by real-time qRT-PCR analysis using primers that distinguish endogenous from transgenic open reading frames. Expression relative to hESC line H9 is shown. Color images available online at www.liebertpub.com/scd
Genomic PCR (p15–18) and Southern blot analysis showed that all iPSCAD and iPSCWT clones were free of integrated and episomal transgenes (Fig. 1B, C). RT-PCR analysis using transgene-specific primers similarly demonstrated a lack of residual transgene expression in these hiPSC clones (Fig. 1B).
The pluripotency of reprogrammed AD- and normal fibroblast-derived hiPSC lines was demonstrated with teratoma formation assays. All cell lines and clones tested formed well-differentiated cystic teratomas 2–3 months after they were intramuscularly or subcutaneously injected into immunodeficient NOG-SCID mice, and histological analysis showed a robust differentiation to all three embryonic germ layers. Tissues of ectodermal (neural rosettes, pigmented neural epithelium), mesodermal (cartilage, skeletal muscles), and endodermal (intestinal epithelium) origin were detected in all teratomas (Fig. 1D).
The endogenous expression of pluripotency-associated transcripts was next evaluated with quantitative real-time RT-PCR (qRT-PCR) methods. These studies revealed that both the iPSCAD and iPSCWT lines expressed pluripotency-associated transcripts at levels comparable to the hESC line H9 (Fig. 1E). With the exception of one WT hiPSC line, all other lines maintained a normal karyotype (Supplementary Fig. S1D). Direct sequencing of PCR-amplified genomic DNA identified the PSEN1 A246E mutation in iPSCAD, but not iPSCWT lines (Supplementary Fig. S1C). Furthermore, sequencing and restriction digestion with DdeI of RT-PCR products confirmed the presence of mutant A246E transcripts specifically in iPSCAD lines (Fig. 2A, B).
FIG. 2.

Expression of the presenilin 1 (PSEN1) A246E mutation and whole genome expression and methylation profiling of hiPSCs. (A, B) Expression of the PSEN1 A246E mutation in hiPSC lines: (A) sequencing of RT-PCR products of PSEN1 cDNA reveals the A246E missense mutation in a representative iPSCAD line. Human iPSCWT39 and hESC H9 lines were used as controls. Asterisk indicates the C to A (246 Ala to Glu) point mutation; (B) restriction endonuclease digestion analysis of RT-PCR products: the point mutation creates a DdeI site and the digestion of the RT-PCR products results in two smaller fragments (200 and 50 bp) in addition to the original PCR products (250 bp). (C, D) Whole genome CpG methylation array analysis of PSC lines: (C) the histogram depicts the Illumina Infinium β-values for autosomal CpG probes from nine PSC lines and two donor fibroblast lines. The X-axis represents β-value methylated/unmethylated probe ratios (from 0.0 to 1.0), and the Y-axis represents the number of autosomal probes evaluated; (D) dendrogram depicting the unsupervised hierarchical correlation clustering of methylation β-values from cell lines indicated above. The clustering pattern shows that the hiPSC lines derived from human fibroblasts have close similarity to hESCs but are quite distinct from their parent fibroblasts. (E, F) Genome-wide expression analysis of PSC lines and somatic donor cells: (E) principal component analysis (PCA) of whole genome microarray expression. The PCA plot of log2-expression signals depicts the total variance across all the Illumina array's probes. The first most significant component lies on the X-axis, the second on the Y-axis, and the third on the Z-axis representing 28.5%, 10.6%, and 8.98% of the total variance, respectively; (F) dendrogram of the unsupervised hierarchical correlation clustering of Illumina expression microarray signal intensity values from the PSC lines and fibroblasts. Human iPSCs were positioned closer to control hESC lines in their global expression patterns than did donor fibroblasts. Color images available online at www.liebertpub.com/scd
To investigate the quality of reprogramming achieved by nonintegrating episomal plasmids, we evaluated global DNA CpG methylation among seven hiPSC lines, their parental fibroblasts, and two control hESC lines (H9 and ES03). Using Infinium microarray analysis of bisulfite-treated genomic DNA, we analyzed the β-values of all cell lines to quantify their class similarity at a global CpG methylation level. Histogram and unsupervised hierarchical cluster analyses of autosomal CpG methylation levels for hiPSC lines, parent fibroblasts, and control hESC lines (Fig. 2C, D) confirmed that global CpG DNA methylation was much more comparable between iPSC and hESC lines than between hiPSC lines and parent fibroblasts.
Similarly, we determined the global gene expression profiles of these same 11 PSC lines (at passage 25) via PCA and hierarchical clustering analysis. PCA plots of log2-expression signals revealed that at least a quarter of all gene expression variance separated differentiated fibroblasts from PSCs (Fig. 2E). Hierarchical clustering analysis similarly revealed that hiPSC lines clustered together with hESC lines H9 and ES03 were transcriptionally distinct from adult human fibroblasts (Fig. 2F).
Neural differentiation of AD- and normal-derived hiPSC lines
To validate that the generated hiPSC lines can be used as an in vitro model to study the pathogenesis of AD, we differentiated several hiPSC clones and the hESC line H9 toward a neuronal fate. Two different approaches were taken, based on the EB formation methodology. The first approach utilized the protocol of Zhang et al. [30], where EBs are derived from clumps of manually dislodged hPSC colonies after dispase treatment (Supplementary Fig. S1E). The second approach involves the technique of forced aggregation that generates EBs of same sizes from known numbers of cells [31–33]. EB formation by this method enabled the consistent production of EBs uniform in size and morphology for each pluripotent cell line in every experiment (Fig. 3A). Forced aggregation was the main method used in this article to characterize the phenotypic, functional, and pathogenic properties of hiPSC-derived neurons to achieve reproducible and consistent EB cultures.
FIG. 3.

Stepwise differentiation of iPSCAD cell lines in the neural lineage. (A–D) Generation of embryoid bodies (EBs) and neurospheres: (A) formation of identical sized EBs by the forced aggregation procedure; (B) 1 day after the attachment of EBs on Matrigel-coated plates, EBs spread out and flat cells grow at the periphery, while primitive neuroepithelium forms at the center; (C) formation of well-defined rosette structures at the center of EBs 4 days after plating; (D) floating formation of neurospheres containing rosette-like structures. (E, F) Generation of neural precursors: (E) at the early stage of neural differentiation, cells express the neuroepithelial marker PAX6; (F) EB-derived neural rosettes dissociated into single cells and plated as monolayer cultures are immunoreactive for nestin [red; cell nuclei are counterstained with 4′,6′-diamidino-2-phenylindole (DAPI)]. (G) Quantitative RT-PCR analysis for forebrain (FOXG1, OTX1, PAX6, SIX3) and hindbrain (KROX20) positional markers in neural progenitor cultures derived from four iPSCAD (AD1, AD6, AD10, and AD36) and three iPSCWT (WT2, WT4, and WT22) lines. Expression levels of individual genes calculated relative to GAPDH (used here as housekeeping gene) and normalized against the neuroepithelial marker Nestin were grouped per iPSCAD or iPSCWT designation. Differences between the two groups were analyzed with the Student's t-test for all transcripts. Forebrain and hindbrain markers were present in all cell lines, but a 3-fold higher expression of the telencephalic marker FOXG1 was detected in AD-derived compared to wild-type cultures **(P<0.05). Color images available online at www.liebertpub.com/scd
To induce neuroectodermal differentiation of EBs generated by forced aggregation, we modified a differentiation protocol previously shown to induce rapid and highly efficient neural conversion of hESCs through the inhibition of both the bone morphogenetic protein (BMP) and transforming growth factor beta (TGFβ)/activin/nodal pathways [34,35]. To this effect, we combined two different inhibitors, recombinant noggin BMP-inhibitor [36–40] and SB431542, a TGFβ/activin/nodal inhibitor, each one of which has been separately shown to induce the neural conversion of hESCs [41,42]. EBs were grown in suspension for 10 days in the medium supplemented with noggin and SB431542, the last only for the first 5 days. Noggin was continuously added in the medium, even after the plating of EBs, until rosette structures were formed. As soon as the EBs attached to Matrigel-coated plates, they started spreading out and, as early as 1 day after attachment, cells began to elongate and form clusters of columnar cells (primitive neuroepithelial cells) at the center of each EB (Fig. 3B). Three days later, a number of rosette structures emerged at the center of the colonies (definite neuroepithelium) (Fig. 3C). The efficiency of neural differentiation of all wild-type and AD hiPSC lines was as high as 100% based on the number of EBs containing neural rosettes 1–2 days after seeding (Fig. 3B). Similar results were obtained from three independent experiments for each cell line.
Neuronal differentiation of AD- and normal-derived hiPSC lines
Rosettes generated as above were manually collected and expanded, either as monolayer cultures of neural precursors or as suspended cell aggregates in the neurosphere proliferation medium (Fig. 3D). In the case of monolayer cultures, EB-derived neural rosettes were dissociated into single cells and replated to obtain a homogeneous population of neural precursors that was expanded over several passages after attachment on polyornithine/laminin-coated plates. Immunocytochemical profiling showed a uniform expression of PAX6, a neural stem cell marker and transcription factor expressed in early neuroepithelial cells (Fig. 3E), and of nestin, a marker of neural stem/progenitor cells (Fig. 3F). In the case of neurosphere formation, neural rosettes were manually isolated and cultured in suspension for 6 days (Fig. 3D). Neurospheres were subsequently dissociated into single cells and plated on polyornithine/laminin-coated plates in the presence of FGF2 and EGF. Nestin-normalized positional profiling of early-passage neural precursors revealed the expression of forebrain (FOXG1, PAX6, SIX3, OTX1) and hindbrain (KROX20) markers in both AD and WT, with a distinct predominance of the forebrain/telencephalic marker FOXG1 in AD-derived cultures (Fig. 3G).
We next assessed the ability of early-passage neural precursors derived from control and AD cell lines to differentiate into mature functional neurons after withdrawal of FGF2 and EGF and supplementation with the neurotrophic factors BDNF and GDNF. Over a period of 4 weeks, neural precursors formed a dense network of neuronal cell bodies and processes that were positive for neuron-specific markers, for example, class III-β-tubulin (TUJ1) for immature neurons (Fig. 4A, B, F) and MAP2 for mature nerve cells (Fig. 4C–E).
FIG. 4.

Characterization of human hiPSC-derived neurons by immunocytochemistry and RT-PCR. (A–F) Human iPSC-derived neurons extend numerous processes forming bundles of fibers (A, B) that are immunoreactive for neuron-specific markers, including class III-β-tubulin (TUJ1) (green, B, F) and MAP2A (red, C–E); they are also immunoreactive for synapsin I after 1 month of differentiation (green, D). (E, F) The cortical identity of some hiPSC-derived neurons cultured for over 2 months is ascertained with immunocytochemistry for the neocortical markers T-brain-1 (TBR1) (green, E) and special AT-rich sequence-binding protein 2 (SATB2) (red, F). Scale bars: (A) 100 μm; (B) 25 μm; (C) 50 μm; (D) 25 μm; (E) 50 μm; (F) 25 μm. (G) Quantitative RT-PCR analysis for the synaptic markers (GluR1, PSD95, SYT1) was performed in neuronal cultures derived from five iPSCAD (AD1, AD6, AD10, AD36, and AD38) and three iPSCWT (WT2, WT4, and WT22) lines. Levels of individual gene expression were calculated relative to GAPDH (used here as housekeeping gene), normalized against MAP2 expression, and grouped per iPSCAD or iPSCWT designation. Differences between the two groups were analyzed with the Student's t-test for all transcripts. Synaptic markers were present in all cell lines, but AD neurons were enriched in SYT1, as well as in mGLUR1. *P<0.05; **P<0.05. Color images available online at www.liebertpub.com/scd
Maturation of hiPSC-derived neurons grown in culture for longer periods of time (ie, more than 1 month) was associated with a sustained expression of MAP2 and the presence of synaptic markers. Synaptic maturity was demonstrated by the expression of the presynaptic marker synapsin I that decorated puncta on the surfaces of MAP2-positive neurons (Fig. 4D). hiPSC-generated neurons were also positive for the expression of position-specifying markers, such as the cortical markers TBR1 [41,43] (Fig. 4E) and SATB2 [44] (Fig. 4F). Culturing of neurons for longer periods of time (ie, more than 2 months) resulted in the spontaneous differentiation of mature GFAP+ astrocytes that formed a layer underneath neurons (data not shown).
Neuronal maturation of iPSCWT and iPSCAD-derived neuronal cultures were further characterized with RT-PCR using primers for structural synaptic transcripts. Neural precursors from eight different cell lines, that is, three WT and five AD lines, were differentiated for about 2 months. Postsynaptic density protein 95 (PSD95) and synaptotagmin 1 (SYT1) were present in all cell lines, a pattern that confirms the extensive synaptic differentiation and thus neuronal maturity of these cells (Fig. 4G).
Electrophysiological characterization of hiPSC-derived neurons
We studied cultured hiPSC-derived neurons using whole-cell patch-clamp methods to demonstrate that these cells differentiate as functional neurons. In voltage-clamp mode, large inward and outward currents were induced in iPSCWT- and iPSCAD-derived neurons by incremental depolarization steps from −70 mV to +20 mV (10 mV increments) from a holding potential of −110 mV (Fig. 5A) (total n=47 neurons). The fast-activating, fast-inactivating inward currents were blocked by sodium channel blocker tetrodotoxin (TTX; 0.5 μM) (data not shown). Induced PSCWT- and iPSCAD-derived neurons showed the capacity to generate action potentials in response to current injections (Fig. 5B). TTX (0.5 μm) blocked the action potentials (data not shown). Thus, both wild-type and disease-specific hiPSC-derived neurons have the potential to differentiate appropriately to functional neurons defined electrophysiologically. To demonstrate that hiPSC-derived neurons can establish functional synaptic networks in culture, we analyzed continuous whole-cell voltage-clamp recordings. At the holding potential of −70 mV, spontaneous postsynaptic currents were detected in both iPSCWT- and hiPSC-derived neurons (Fig. 5C).
FIG. 5.

Electrophysiological properties of wild-type and disease-specific hiPSC-derived neurons. (A) Whole-cell voltage-clamp recordings showing voltage-dependent sodium and potassium currents in hiPSC-derived neurons (iPSCWT4 and iPSCAD41 cell lines). Current traces were elicited by step depolarizations from −70 to +20 mV (10 mV increments) from a holding potential of −110 mV (lower panel). Neurons cultured for 19–28 days after differentiation were initiated (total n=47 neurons). (B) Representative current-clamp recordings in a wild-type and a disease hiPSC-derived neuron showing action potentials in response to 20 pA current injections. (C) Spontaneous postsynaptic currents (PSCs) were detected in both wild-type and familial AD (FAD) hiPSC-derived neurons.
Aβ in the conditioned medium of iPSCAD-derived neurons
After we achieved the neuronal differentiation of hiPSC lines, we examined whether iPSCAD-derived neurons express key aspects of AD pathology. APP processing was examined in neurons derived from three representative iPSCWT lines (WT2, WT4, and WT22) and six iPSCAD lines. Levels of Aβ42 and Aβ40 proteins secreted in the conditioned medium of each neuronal culture were measured with an ELISA assay and normalized by relative levels of MAP2 protein in the cell cultures (Fig. S2). Normalized levels of Aβ42 and Aβ40 proteins, and their ratios, were calculated and presented as the WT and AD groups (Fig. 6).
FIG. 6.
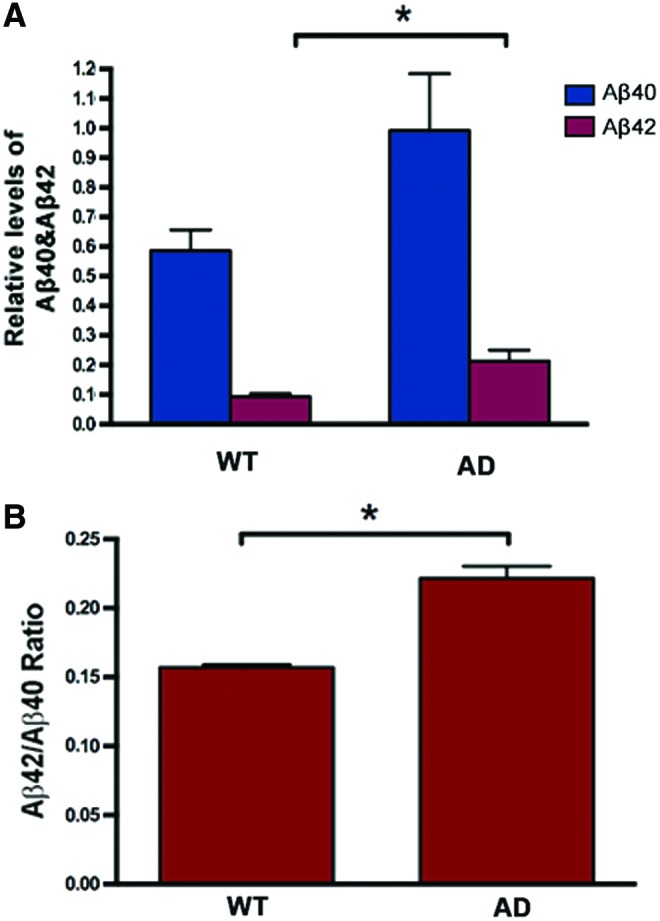
Analysis of β-amyloid (Aβ) secretion by neurons derived from iPSCAD lines. (A) Amounts of Aβ40 and Aβ42 secreted by hiPSC-derived neurons in neuron-conditioned culture media from three representative control hiPSC lines (WT) and six representative AD hiPSC (AD) lines. Aβ40 and Aβ42 were measured by Aβ40- and Aβ42-specific ELISA kits (Invitrogen) and normalized for total protein levels and expression levels of the neuronal marker MAP2. All six iPSCAD lines were pooled (AD) and compared with pooled control (WT) lines using the nonparametric Mann–Whitney test (also known as the Wilcoxon two-sample test) and levels of significance are indicated above bars (*P<0.05). Aβ40 levels were not significantly different between AD and WT cell lines. (B) Bar diagrams representing Aβ42/Aβ40 ratios in neuron-conditioned culture media from representative control iPSCWT lines and representative iPSCAD lines. Comparisons were made as described in (A). The Aβ42/Aβ40 ratio in neurons derived from iPSCAD lines is significantly higher compared with that in control cells. Results represent the mean±SEM from three separate experiments per cell line (n=3). Significant differences in the Aβ42/Aβ40 ratio between iPSCAD-derived neurons versus control cultures were examined by the nonparametric Mann–Whitney test (*P<0.05). Color images available online at www.liebertpub.com/scd
Results indicate that normalized levels of Aβ42 were significantly higher in the conditioned media of neuronal cultures derived from AD iPSC lines (Fig. 6A). The Aβ42/Aβ40 ratio in media collected from the AD hiPSCs was also significantly higher relative to controls (Fig. 6B). These results are consistent with previous studies showing that the major biochemical alteration of missense mutations in PSEN genes and a key pathological feature in brains of patients with AD is the relative elevation of Aβ42 to Aβ40 peptides [45–47].
Discussion
Our findings show that we successfully implemented a nonintegrating episomal methodology to generate hiPSCs from adult skin fibroblasts of patients with FAD, demonstrated that these stem cell-like cells can be consistently differentiated into neural and neuronal lineages, and showed that the neuronal progeny of these hiPSCs displays amyloidogenic properties. To date, most studies on mechanisms of AD have been limited to postmortem human brain tissues that represent full-blown disease or transgenic mouse models of AD that, due to differences between human and mouse, may not reproduce the full phenotype of the illness [48,49]. Our findings indicate that hiPSCs harboring FAD-causing mutations can provide an abundant source of neural precursors and neurons that can serve as models for the study of pathogenic cascades downstream to FAD gene transcripts. These FAD-derived hiPSCs can serve as powerful tools that can extend our ability to model AD at the cellular and molecular level and innovate in the areas of pathology, diagnosis, and treatment [50].
In the present study, we generated several representative hiPSC lines to ensure the reliability and efficiency of methods used to reprogram fibroblasts from middle-aged individuals with FAD and normal age-matched controls. We also extensively characterized neurons generated from several hiPSC lines, that is, three iPSCWT and five iPSCAD lines, with respect to structural and functional maturation. Our findings demonstrate that iPSCWT and iPSCAD lines generate functional neurons displaying action potentials and postsynaptic potentials. Critically, both iPSCWT- and iPSCAD-derived neurons showed spontaneous synaptic activity, indicating functional neuronal network activity in the cultures, but further electrophysiological studies are necessary to determine if differences exist between iPSCWT and iPSCAD lines.
More importantly, neurons differentiated from iPSCAD lines recapitulate the amyloidogenic properties of mutant presenilins, as they show a significantly increased ratio of Aβ42/Aβ40 compared with control neurons that is consistent in all cell lines tested from two FAD patients. PSEN1 mutations, including the mutation A246E present in the fibroblast cell lines used here, are the most common cause of early-onset FAD. These mutations exert their pathogenic role by affecting γ-secretase activity and increasing the Aβ42/Aβ40 ratio [45,51–53]. Our findings are in agreement with those of Yagi et al. who used retroviral reprogramming of primary human fibroblasts harboring PSEN1 and PSEN2 mutations to generate hiPSC clones [15]. The increased Aβ42/Aβ40 ratio displayed in iPSCAD-derived neurons suggests that these nerve cells may potentially form Aβ aggregates and highlights the potential utility of these hiPSC lines to model FAD.
One of the challenges of using hiPSCs for modeling neurological diseases and exploring new therapies is the problem of integration of reprogramming genes into the genome with commonly used retroviral or lentiviral vectors. Despite the silencing of viral vectors during hiPSC generation, randomly integrated transgenes can cause insertional mutagenesis. These transgenes may also be reactivated in terminally differentiated neural cells. Such genetic events can increase the genomic variability among generated hiPSC lines and their progenies and influence their neural differentiation potential [54,55]. These are factors that complicate the use of such hiPSCs as models of disease. The risk of malignant transformation can also be a serious drawback for the use of hiPSCs for disease modeling in vivo or as cellular therapies.
Early-onset FAD is inherited in an autosomal dominant pattern and results in rapidly progressive illness that is diagnosed before the age of 65 years [56]. Even in late-onset cases, there is growing suspicion for events that set apart future patients from successfully aging peers fairly early in life [57,58]. These clinical and prognostic patterns suggest a possible developmental component in AD, which can be addressed with greater interpretative accuracy with the establishment of in vitro and, in the future, in vivo models using stem cells that harbor disease-causing mutations. Advantages of such models over existing transgenic animal models of AD [48,59,60] are the possibility for a higher level of resolution of cellular and molecular information and the potential of exploring critical pathogenic events very early in neural development that cannot be easily accessed in transgenic animals.
Together, our findings confirm that episomal hiPSC technologies can be readily deployed to generate patient-specific PSCs and neuronal progenies with FAD properties. These virus-free hiPSC lines can serve as cellular models of AD with great potential to address developmental mechanisms in the early stages of the formation of the nervous system. Furthermore, these models can be used for investigations linking the products of mutant PSEN1 (or other AD-causing genes) to downstream events leading to the signature neuropathologies of Aβ deposition in senile plaques or tau hyperphosphorylation in the form of paired helical filaments. Further disease modeling possibilities introduced by hiPSC-based strategies may eventually lead to the development of new diagnostic tools and novel therapies.
Supplementary Material
Acknowledgments
This work was supported by the Maryland Stem Cell Research Fund (2011-MSCRF-11-0067-00-VEK, 2010-MSCRF-0171-00-VEK, 2011-MSCRF-II-0008-00-ETZ, 2007-MSCRF-II-0379-00-ETZ, 2014-MSCRFE-0724-VM), NIH R01NS045140 (V.E.K.), NIH 1U01HL099775 (E.T.Z.), and generous gifts from the Kate Sidran Family Foundation and Sam and Sheila Giller family (V.E.K.). V.M., T.S.P., and P.W.B. were supported by postdoctoral fellowship grants from the Maryland Stem Cell Research Fund. Q.C. and L.J.M. were supported by NIH-NINDS R01 NS052098 and NS079348 (L.J.M.). The authors thank Dr. Philip C. Wong for his helpful comments on the article.
Author Disclosure Statement
The authors declare no potential conflicts of interest.
References
- 1.Alzheimer A. (1911). Ueber eigenartige Krankheitsfaelle des spaeteren Alters. Z Ges Neurol Psychiat 4:356–385 [Google Scholar]
- 2.Walsh DM. and Selkoe DJ. (2004). Deciphering the molecular basis of memory failure in Alzheimer's disease. Neuron 44:181–193 [DOI] [PubMed] [Google Scholar]
- 3.Yankner BA, Dawes LR, Fisher S, Villa-Komaroff L, Oster-Granite ML. and Neve RL. (1989). Neurotoxicity of a fragment of the amyloid precursor associated with Alzheimer's disease. Science 245:417–420 [DOI] [PubMed] [Google Scholar]
- 4.Yankner BA. (1996). Mechanisms of neuronal degeneration in Alzheimer's disease. Neuron 16:921–932 [DOI] [PubMed] [Google Scholar]
- 5.Sisodia SS. and St George-Hyslop PH. (2002). gamma-Secretase, Notch, Abeta and Alzheimer's disease: where do the presenilins fit in?. Nat Rev Neurosci 3:281–290 [DOI] [PubMed] [Google Scholar]
- 6.Small SA. and Duff K. (2008). Linking Abeta and tau in late-onset Alzheimer's disease: a dual pathway hypothesis. Neuron 60:534–542 [DOI] [PMC free article] [PubMed] [Google Scholar]
- 7.Sherrington R, Rogaev EI, Liang Y, Rogaeva EA, Levesque G, Ikeda M, Chi H, Lin C, Li G, et al. (1995). Cloning of a gene bearing missense mutations in early-onset familial Alzheimer's disease. Nature 375:754–760 [DOI] [PubMed] [Google Scholar]
- 8.Cruts M, van Duijn CM, Backhovens H, Van den Broeck M, Wehnert A, Serneels S, Sherrington R, Hutton M, Hardy J, et al. (1998). Estimation of the genetic contribution of presenilin-1 and -2 mutations in a population-based study of presenile Alzheimer disease. Hum Mol Genet 7:43–51 [DOI] [PubMed] [Google Scholar]
- 9.Selkoe DJ. (2001). Presenilin, Notch, and the genesis and treatment of Alzheimer's disease. Proc Natl Acad Sci U S A 98:11039–11041 [DOI] [PMC free article] [PubMed] [Google Scholar]
- 10.Mattis VB. and Svendsen CN. (2001). Induced pluripotent stem cells: a new revolution for clinical neurology?. Lancet Neurol 4:383–394 [DOI] [PubMed] [Google Scholar]
- 11.Dimos JT, Rodolfa KT, Niakan KK, Weisenthal LM, Mitsumoto H, Chung W, Croft GF, Saphier G, Leibel R, et al. (2008). Induced pluripotent stem cells generated from patients with ALS can be differentiated into motor neurons. Science 321:1218–1221 [DOI] [PubMed] [Google Scholar]
- 12.Chiang CH, Su Y, Wen Z, Yoritomo N, Ross CA, Margolis RL, Song H. and Ming GL. (2011). Integration-free induced pluripotent stem cells derived from schizophrenia patients with a DISC1 mutation. Mol Psychiatry 16:358–360 [DOI] [PMC free article] [PubMed] [Google Scholar]
- 13.Soldner F, Hockemeyer D, Beard C, Gao Q, Bell GW, Cook EG, Hargus G, Blak A, Cooper O, et al. (2009). Parkinson's disease patient-derived induced pluripotent stem cells free of viral reprogramming factors. Cell 136:964–977 [DOI] [PMC free article] [PubMed] [Google Scholar]
- 14.Zhang N, An MC, Montoro D. and Ellerby LM. (2010). Characterization of human Huntington's disease cell model from induced pluripotent stem cells. PLoS Curr 2:RRN1193. [DOI] [PMC free article] [PubMed] [Google Scholar]
- 15.Yagi T, Ito D, Okada Y, Akamatsu W, Nihei Y, Okano H. and Suzuki N. (2011). Modeling familial Alzheimer's disease with induced pluripotent stem cells. Hum Mol Genet 20:4530–4539 [DOI] [PubMed] [Google Scholar]
- 16.Israel MA, Yuan SH, Bardy C, Reyna SM, Mu Y, Herrera C, Hefferan MP, Van Gorp S, Nazor KL, et al. (2012). Probing sporadic and familial Alzheimer's disease using induced pluripotent stem cells. Nature 482:216–220 [DOI] [PMC free article] [PubMed] [Google Scholar]
- 17.Kondo T, Asai M, Tsukita K, Kutoku Y, Ohsawa Y, Sunada Y, Imamura K, Egawa N, Yahata N, et al. (2013). Modeling Alzheimer's disease with iPSCs reveals stress phenotypes associated with intracellular Aβ and differential drug responsiveness. Cell Stem Cell 12:487–496 [DOI] [PubMed] [Google Scholar]
- 18.Yamanaka S. (2007). Strategies and new developments in the generation of patient-specific pluripotent stem cells. Cell Stem Cell 1:39–49 [DOI] [PubMed] [Google Scholar]
- 19.Knoepfler PS. (2008). Why myc?. An unexpected ingredient in the stem cell cocktail. Cell Stem Cell 2:18–21 [DOI] [PubMed] [Google Scholar]
- 20.Wei D, Kanai M, Huang S. and Xie K. (2006). Emerging role of KLF4 in human gastrointestinal cancer. Carcinogenesis 27:23–31 [DOI] [PubMed] [Google Scholar]
- 21.Okita K, Ichisaka T. and Yamanaka S. (2007). Generation of germline-competent induced pluripotent stem cells. Nature 448:313–317 [DOI] [PubMed] [Google Scholar]
- 22.Yu J, Hu K, Smuga-Otto K, Tian S, Stewart R, Slukvin II. and Thomson JA. (2009). Human induced pluripotent stem cells free of vector and transgene sequences. Science 324:797–801 [DOI] [PMC free article] [PubMed] [Google Scholar]
- 23.Okita K, Nakagawa M, Hyenjong H, Ichisaka T. and Yamanaka S. (2008). Generation of mouse induced pluripotent stem cells without viral vectors. Science 322:949–953 [DOI] [PubMed] [Google Scholar]
- 24.Stadtfeld M, Nagaya M, Utikal J, Weir G. and Hochedlinger K. (2008). Induced pluripotent stem cells generated without viral integration. Science 322:945–949 [DOI] [PMC free article] [PubMed] [Google Scholar]
- 25.Thomson JA, Itskovitz-Eldor J, Shapiro SS, Waknitz MA, Swiergiel JJ, Marshall VS. and Jones JM. (1998). Embryonic stem cell lines derived from human blastocysts. Science 282:1145–1147 [DOI] [PubMed] [Google Scholar]
- 26.Burridge PW, Thompson S, Millrod MA, Weinberg S, Yuan X, Peters A, Mahairaki V, Koliatsos VE, Tung L. and Zambidis ET. (2011). A universal system for highly efficient cardiac differentiation of human induced pluripotent stem cells that eliminates interline variability. PLoS One 6:e18293. [DOI] [PMC free article] [PubMed] [Google Scholar]
- 27.Peters A. and Zambidis E. (2011). Generation of nonviral integration-free induced pluripotent stem cells from plucked human hair follicles. In: Human Embryonic and Induced Pluripotent Stem Cells: Lineage-Specific Differentiation Protocols. Kaiming Y, Sha J, eds. Springer Protocols Handbooks, Humana Press, New York, pp. 203–227 [Google Scholar]
- 28.Park TS, Huo JS, Peters A, Talbot CC, Jr., Verma K, Zimmerlin L, Kaplan IM. and Zambidis ET. (2012). Growth factor-activated stem cell circuits and stromal signals cooperatively accelerate non-integrated iPSC reprogramming of human myeloid progenitors. PLoS One 7:e42838. [DOI] [PMC free article] [PubMed] [Google Scholar]
- 29.Park IH, Zhao R, West JA, Yabuuchi A, Huo H, Ince TA, Lerou PH, Lensch MW. and Daley GQ. (2008). Reprogramming of human somatic cells to pluripotency with defined factors. Nature 451:141–146 [DOI] [PubMed] [Google Scholar]
- 30.Zhang SC, Wernig M, Duncan ID, Brüstle O. and Thomson JA. (2001). In vitro differentiation of transplantable neural precursors from human embryonic stem cells. Nat Biotechnol 19:1129–1133 [DOI] [PubMed] [Google Scholar]
- 31.Ng ES, Davis RP, Azzola L, Stanley EG. and Elefanty AG. (2005). Forced aggregation of defined numbers of human embryonic stem cells into embryoid bodies fosters robust, reproducible hematopoietic differentiation. Blood 106:1601–1603 [DOI] [PubMed] [Google Scholar]
- 32.Burridge PW, Anderson D, Priddle H, Barbadillo Muñoz MD, Chamberlain S, Allegrucci C, Young LE. and Denning C. (2007). Improved human embryonic stem cell embryoid body omogeneity and cardiomyocyte differentiation from a novel V-96 plate aggregation system highlights interline variability. Stem Cells 25:929–938 [DOI] [PubMed] [Google Scholar]
- 33.Xu C, Inokuma MS, Denham J, Golds K, Kundu P, Gold JD. and Carpenter MK. (2001). Feeder-free growth of undifferentiated human embryonic stem cells. Nat Biotechnol 19:971–974 [DOI] [PubMed] [Google Scholar]
- 34.Chambers SM, Fasano CA, Papapetrou EP, Tomishima M, Sadelain M. and Studer L. (2009). Highly efficient neural conversion of human ES and iPS cells by dual inhibition of SMAD signaling. Nat Biotechnol 27:275–280 [DOI] [PMC free article] [PubMed] [Google Scholar]
- 35.Morizane A, Doi D, Kikuchi T, Nishimura K. and Takahashi J. (2011). Small-molecule inhibitors of bone morphogenic protein and activin/nodal signals promote highly efficient neural induction from human pluripotent stem cells. J Neurosci Res 89:117–126 [DOI] [PubMed] [Google Scholar]
- 36.Ben-Hur T, Idelson M, Khaner H, Pera M, Reinhartz E, Itzik A. and Reubinoff BE. (2004). Transplantation of human embryonic stem cell-derived neural progenitors improves behavioral deficit in Parkinsonian rats. Stem Cells 22:1246–1255 [DOI] [PubMed] [Google Scholar]
- 37.Pera MF, Andrade J, Houssami S, Reubinoff B, Trounson A, Stanley EG, Ward-van Oostwaard D. and Mummery C. (2004). Regulation of human embryonic stem cell differentiation by BMP-2 and its antagonist noggin. J Cell Sci 117:1269–1280 [DOI] [PubMed] [Google Scholar]
- 38.Chiba S, Lee YM, Zhou W. and Freed CR. (2008). Noggin enhances dopamine neuron production from human embryonic stem cells and improves behavioral outcome after transplantation into Parkinsonian rats. Stem Cells 26:2810–2820 [DOI] [PubMed] [Google Scholar]
- 39.Elkabetz Y, Panagiotakos G, Al Shamy G, Socci ND, Tabar V. and Studer L. (2008). Human ES cell-derived neural rosettes reveal a functionally distinct early neural stem cell stage. Genes Dev 22:152–165 [DOI] [PMC free article] [PubMed] [Google Scholar]
- 40.Nasonkin I, Mahairaki V, Xu L, Hatfield G, Cummings BJ, Eberhart C, Ryugo DK, Maric D, Bar E. and Koliatsos VE. (2009). Long-term, stable differentiation of human embryonic stem cell-derived neural precursors grafted into the adult mammalian neostriatum. Stem Cells 27:2414–2426 [DOI] [PMC free article] [PubMed] [Google Scholar]
- 41.Eiraku M, Watanabe K, Matsuo-Takasaki M, Kawada M, Yonemura S, Matsumura M, Wataya T, Nishiyama A, Muguruma K. and Sasai Y. (2008). Self-organized formation of polarized cortical tissues from ESCs and its active manipulation by extrinsic signals. Cell Stem Cell 3:519–532 [DOI] [PubMed] [Google Scholar]
- 42.Smith JR, Vallier L, Lupo G, Alexander M, Harris WA. and Pedersen RA. (2008). Inhibition of Activin/Nodal signaling promotes specification of human embryonic stem cells into neuroectoderm. Dev Biol 313:107–117 [DOI] [PubMed] [Google Scholar]
- 43.Li XJ, Zhang X, Johnson MA, Wang ZB, Lavaute T. and Zhang SC. (2009). Coordination of sonic hedgehog and Wnt signaling determines ventral and dorsal telencephalic neuron types from human embryonic stem cells. Development 136:4055–4063 [DOI] [PMC free article] [PubMed] [Google Scholar]
- 44.Saito T, Hanai S, Takashima S, Nakagawa E, Okazaki S, Inoue T, Miyata R, Hoshino K, Akashi T, et al. (2011). Neocortical layer formation of human developing brains and lissencephalies: consideration of layer-specific marker expression. Cereb Cortex 21:588–596 [DOI] [PubMed] [Google Scholar]
- 45.Scheuner D, Eckman C, Jensen M, Song X, Citron M, Suzuki N, Bird TD, Hardy J, Hutton M, et al. (1996). Secreted amyloid beta-protein similar to that in the senile plaques of Alzheimer's disease is increased in vivo by the presenilin 1 and 2 and APP mutations linked to familial Alzheimer's disease. Nat Med 2:864–870 [DOI] [PubMed] [Google Scholar]
- 46.Lemere CA, Lopera F, Kosik KS, Lendon CL, Ossa J, Saido TC, Yamaguchi H, Ruiz A, Martinez A, et al. (1996). The E280A presenilin 1 Alzheimer mutation produces increased A beta 42 deposition and severe cerebellar pathology. Nat Med 2:1146–1150 [DOI] [PubMed] [Google Scholar]
- 47.Hardy J. and Selkoe DJ. (2002). The amyloid hypothesis of Alzheimer's disease: progress and problems on the road to therapeutics. Science 297:353–356 [DOI] [PubMed] [Google Scholar]
- 48.Wong PC, Cai H, Borchelt DR. and Price DL. (2002). Genetically engineered mouse models of neurodegenerative diseases. Nat Neurosci 5:633–639 [DOI] [PubMed] [Google Scholar]
- 49.Mucke L, Masliah E, Yu GQ, Mallory M, Rockenstein EM, Tatsuno G, Hu K, Kholodenko D, Johnson-Wood K, and McConlogue L. (2000). High-level neuronal expression of abeta 1–42 in wild-type human amyloid protein precursor transgenic mice: synaptotoxicity without plaque formation. J Neurosci 20:4050–4058 [DOI] [PMC free article] [PubMed] [Google Scholar]
- 50.Israel MA. and Goldstein LS. (2011). Capturing Alzheimer's disease genomes with induced pluripotent stem cells: prospects and challenges. Genome Med 3:49. [DOI] [PMC free article] [PubMed] [Google Scholar]
- 51.Wolfe MS. (2007). When loss is gain: reduced presenilin proteolytic function leads to increased Abeta42/Abeta40. Talking Point on the role of presenilin mutations in Alzheimer disease. EMBO Rep 8:136–140 [DOI] [PMC free article] [PubMed] [Google Scholar]
- 52.Bentahir M, Nyabi O, Verhamme J, Tolia A, Horré K, Wiltfang J, Esselmann H, and De Strooper B. (2006). Presenilin clinical mutations can affect gamma-secretase activity by different mechanisms. J Neurochem 96:732–742 [DOI] [PubMed] [Google Scholar]
- 53.Bergmans BA. and De Strooper B. (2010). gamma-Secretases: from cell biology to therapeutic strategies. Lancet Neurol 9:215–226 [DOI] [PubMed] [Google Scholar]
- 54.Hu BY, Weick JP, Yu J, Ma LX, Zhang XQ, Thomson JA. and Zhang SC. (2010). Neural differentiation of human induced pluripotent stem cells follows developmental principles but with variable potency. Proc Natl Acad Sci U S A 107:4335–4340 [DOI] [PMC free article] [PubMed] [Google Scholar]
- 55.Boulting GL, Kiskinis E, Croft GF, Amoroso MW, Oakley DH, Wainger BJ, Williams DJ, Kahler DJ, Yamaki M, et al. (2011) A functionally characterized test set of human induced pluripotent stem cells. Nat Biotechnol 29:279–286 [DOI] [PMC free article] [PubMed] [Google Scholar]
- 56.Jacobs D, Sano M, Marder K, Bell K, Bylsma F, Lafleche G, Albert M, Brandt J, and Stern Y. (1994). Age at onset of Alzheimer's disease: relation to pattern of cognitive dysfunction and rate of decline. Neurology 44:1215–1220 [DOI] [PubMed] [Google Scholar]
- 57.Riley KP, Snowdon DA, Desrosiers MF. and Markesbery WR. (2005). Early life linguistic ability, late life cognitive function, and neuropathology: findings from the Nun Study. Neurobiol Aging 26:341–347 [DOI] [PubMed] [Google Scholar]
- 58.Iacono D, Markesbery WR, Gross M, Pletnikova O, Rudow G, Zandi P. and Troncoso JC. (2009). The Nun study: clinically silent AD, neuronal hypertrophy, and linguistic skills in early life. Neurology 73:665–673 [DOI] [PMC free article] [PubMed] [Google Scholar]
- 59.Price DL, Sisodia SS. and Borchelt DR. (1988). Genetic neurodegenerative diseases: the human illness and transgenic models. Science 282:1079–1083 [DOI] [PubMed] [Google Scholar]
- 60.Dodart JC, Mathis C, Bales KR. and Paul SM. (2002). Does my mouse have Alzheimer's disease?. Genes Brain Behav 1:142–155 [DOI] [PubMed] [Google Scholar]
Associated Data
This section collects any data citations, data availability statements, or supplementary materials included in this article.