

SUMMARY
Pyruvate lies at a central biochemical node connecting carbohydrate, amino acid, and fatty acid metabolism, and the regulation of pyruvate flux into mitochondria represents a critical step in intermediary metabolism impacting numerous diseases. To characterize changes in mitochondrial substrate utilization in the context of compromised mitochondrial pyruvate transport, we applied 13C metabolic flux analysis (MFA) to cells after transcriptional or pharmacological inhibition of the mitochondrial pyruvate carrier (MPC). Despite profound suppression of both glucose and pyruvate oxidation, cell growth, oxygen consumption, and tricarboxylic acid (TCA) metabolism were surprisingly maintained. Oxidative TCA flux was achieved through enhanced reliance on glutaminolysis through malic enzyme and pyruvate dehydrogenase (PDH) as well as fatty acid and branched chain amino acid oxidation. Thus, in contrast to inhibition of complex I or PDH, suppression of pyruvate transport induces a form of metabolic flexibility associated with use of lipids and amino acids as catabolic and anabolic fuels.
INTRODUCTION
Mitochondria execute core metabolic functions in eukaryotes ranging from catabolic energy conversion to anabolism of biosynthetic intermediates. Cells must negotiate their nutritional environment to control which substrates are metabolized in mitochondria while continuing to meet their bioenergetic and/or biosynthetic needs. Pyruvate lies at the intersection of glycolysis, gluconeogenesis, and the tricarboxylic acid (TCA) cycle; as such, its transport into the mitochondrial matrix influences carbohydrate, fatty acid, and amino acid metabolism. Dysregulation of these processes contributes to the pathogenesis of numerous diseases, including diabetes and obesity (DeFronzo and Tripathy, 2009; Sugden et al., 2009), mitochondrial disorders (Kerr, 2013), cardiac failure (Fillmore and Lopaschuk, 2013), neurodegenerative disorders (Cunnane et al., 2011; Yao et al., 2011), and cancer (Currie et al., 2013; Tennant et al., 2010). Therefore, strategies that modulate the extent of pyruvate flux into mitochondrial pathways may have therapeutic potential by directly or indirectly affecting glucose, lipid, and/or amino acid homeostasis in the body.
Existence of a protein carrier to facilitate pyruvate transport into mitochondria has been recognized for decades (Halestrap and Denton, 1974; Papa et al., 1971). Although activity of this transporter and sensitivity to inhibitors have been characterized (Clark and Land, 1974; Halestrap and Denton, 1974; Papa and Paradies, 1974), the genes encoding this complex remained a mystery for many years. Two recent studies revealed strong evidence that the genes, renamed MPC1 and MPC2, encode the multimeric mitochondrial pyruvate carrier (MPC) complex embedded in the mitochondrial inner mitochondrial membrane (Bricker et al., 2012; Herzig et al., 2012). Indeed, Herzig et al. observed that coexpression of Mpc1 and Mpc2 in Lactococcus lactis induced a fourfold increase in pyruvate uptake (Herzig et al., 2012). Consistent with these results, Bricker et al. described the functional redundancy of MPC across several species (yeast, drosophila, human) and identified a mutation in MPC1 that confers resistance to inhibition by the α-cyanocinnamate analog UK5099 (Halestrap, 1975). These discoveries provide an exciting potential drug target through which mitochondrial substrate utilization may be controlled in the context of metabolic disorders. In fact, the MPC has emerged as an unanticipated target of thiazolidinediones (Colca et al., 2013; Divakaruni et al., 2013), a class of insulin sensitizing drugs, and as a regulator of insulin secretion (Patterson et al., 2014; Vigueira et al., 2014); suggesting this transporter plays a central role in substrate selection and metabolic signaling. Moreover, recent work shows the phosphodiesterase inhibitor Zaprinast can alter aspartate and glutamate metabolism via the MPC (Du et al., 2013) and glutaminase (Elhammali et al., 2014).
The high biosynthetic and energetic demands of skeletal muscle myoblasts render them an ideal system to characterize the influence of mitochondrial pyruvate carrier function on metabolic flux and substrate selection. This study is the first to examine metabolic flux regulation by MPC in the context of the metabolic network in intact cells. Mpc1 or Mpc2 was chronically suppressed using lentiviral-mediated delivery of shRNAs and/or pharmacologically inhibited with UK5099 in both proliferating and differentiated mouse C2C12 muscle cells, several human transformed cell lines, and primary human skeletal myotubes (hSKMs). Surprisingly, proliferating myoblasts maintained growth and ATP-linked respiration despite profound inhibition of MPC activity; however, reliance on substrates for energy and biosynthetic metabolism shifted from glucose to amino acid and fatty acid oxidation. TCA flux and fatty acid synthesis were maintained through increased glutamine anaplerosis and oxidation, malic enzyme flux, and fatty acid oxidation. Pharmacological inhibition of MPC activity in hSKMs increased the extent that branched chain amino acids (BCAAs) were oxidized in the TCA cycle.
RESULTS
Proliferation and oxidative metabolism are maintained upon Mpc depletion
To investigate how metabolism is reprogrammed in response to MPC inhibition we depleted Mpc levels in C2C12 myoblasts using targeting Mpc1 (Mpc1KD), Mpc2 (Mpc2KD), or control sequences (Control). Stable knockdown was confirmed at the transcriptional and protein levels (Figures 1A-1B). Despite the importance of glucose and pyruvate metabolism for biosynthesis and ATP generation, cell proliferation rates and ATP-linked respiration were unaffected by the absence of Mpc1 and Mpc2 (Figures 1C-1D). In fact, Mpc knockdown only influenced oxygen consumption in the uncoupled state when all substrates were present, while pyruvate-dependent respiration in permeabilized cells was significantly compromised (Figure 1D). Surprisingly, Mpc knockdown had little effect on glucose and glutamine uptake as well as lactate and glutamate secretion, though pyruvate secretion was significantly increased (Figure 1E).
Figure 1. MPC knockdown does not affect the overall metabolic state of cells.

(A, B) Relative expression of Mpc1 and Mpc2 as determined by qPCR (A) and western blot (B). (C-E) Proliferation (C), oxygen consumption rates (OCR; D), and extracellular substrate fluxes (E) of Control, Mpc1KD, and Mpc2KD cells. (D) ATP-linked and maximal respiration of intact cells and pyruvate-dependent respiration in permeabilized cells (measured as outlined in Experimental Procedures). (F) Relative abundance of intracellular metabolites. Error bars represent minimum and maximum relative expression as calculated by qPCR data analysis software (A), standard deviation (SD) (C, E, F), or standard error of the mean (SEM) (D). *, **, and *** indicate p<0.05, p<0.01, and p<0.001 respectively by ANOVA with Dunnett's post-hoc test.
We next performed a targeted metabolomic analysis to gain more insight into the intracellular metabolic changes occurring upon Mpc depletion (Figure 1F). Intracellular pyruvate was elevated upon Mpc knockdown, whereas the abundances of most TCA cycle intermediates were unaffected. Citrate levels, however, were markedly decreased in Mpc1KD or Mpc2KD (Mpc1/2KD) cells, as this metabolite is generated predominantly from pyruvate-derived AcCoA under normal growth conditions (Metallo et al., 2012). Aspartate and alanine abundances were significantly increased and decreased, respectively, suggesting that amino acid metabolism was altered to maintain metabolic homeostasis.
Oxidative glutaminolysis supports the TCA cycle in cells lacking Mpc
To gain more detailed insights into mitochondrial substrate utilization we cultured cells in the presence of [U-13C6]glucose for 24 hours and observed steady state isotopic labeling (Figure S1A). Consistent with the expected decrease in glucose-derived pyruvate oxidation, labeling of citrate and all TCA intermediates was significantly decreased in Mpc1/2KD cells relative to controls (Figure 2A-2B). While the relative abundances of fully labeled (M3) lactate and pyruvate were unchanged in Mpc1/2KD cells, the extent of alanine labeling from [U-13C6]glucose was significantly decreased (Figure 2C). Additionally, we observed an increase in de novo serine synthesis from glucose in the cytosol (Figure 2D), highlighting potential compartment-specific shifts in amino acid metabolism (Figure S1B).
Figure 2. MPC regulates mitochondrial substrate utilization.

(A) Citrate mass isotopomer distribution (MID) resulting from culture with [U-13C6]glucose (UGlc). (B) % 13C labeled metabolites from UGlc. (C) % fully labeled lactate, pyruvate, and alanine from UGlc. (D) Serine MID resulting from culture with UGlc. (E) % fully labeled metabolites derived from [U-13C5]glutamine (UGln). (F) Schematic of UGln labeling of carbon atoms in TCA cycle intermediates arising via glutaminoloysis and reductive carboxylation. Mitochondrion schematic inspired by Lewis et al. (Lewis et al., 2014) (G, H) Citrate (G) and alanine (H) MIDs resulting from culture with UGln. (I) Maximal oxygen consumption rates ±3 μM BPTES in medium supplemented with 1 mM pyruvate (J) % newly synthesized palmitate as determined by ISA. (K) Contribution of UGln and UGlc to lipogenic AcCoA as determined by ISA. (L) Contribution of glutamine to lipogenic AcCoA via glutaminolysis (ISA using a [3-13C]glutamine [3Gln]) and reductive carboxylation (ISA using a [5-13C]glutamine [5Gln]) under normoxia and hypoxia. (M) Citrate MID resulting from culture with 3Gln. (N) Contribution of UGln and exogenous [3-13C]pyruvate (3Pyr) to lipogenic AcCoA. 2KD+Pyr refers to Mpc2KD cells cultured with 10 mM extracellular pyruvate. Error bars represent SD (A-E, G, H,M), SEM (I), or 95% confidence intervals (J,K,L,N). *, **, and *** indicate p<0.05, p<0.01, and p<0.001 respectively by ANOVA with Dunnett's post-hoc test (A-E, G-J) or * indicates significance by non-overlapping 95% confidence intervals (J,K,L,N).
Next we cultured C2C12 myoblasts in the presence of [U-13C5]glutamine to detect changes in glutamine utilization in the context of decreased Mpc function. The abundance of fully labeled succinate, fumarate, α-ketoglutarate, and malate increased significantly in Mpc1/2KD cells (Figure 2E), suggesting that cells increase their reliance on glutamine anaplerosis when mitochondrial pyruvate transport is limited. Isotopic enrichment in citrate provides additional insight into reprogramming of TCA metabolism. Increased M5 citrate abundance from [U-13C5]glutamine can arise via reductive carboxylation by isocitrate dehydrogenase (IDH) enzymes, and M6 citrate arises through the combined activity of glutaminolysis and pyruvate dehydrogenase (Figure 2F) (Le et al., 2012; Metallo and Vander Heiden, 2013). In the glutaminolysis pathway, glutamine is oxidized in the mitochondria and converted to pyruvate via malic enzymes (MEs). AcCoA is then generated by the PDH complex and condenses with oxaloacetate to form citrate (Figure 2F). The relative abundances of both M5 and M6 mass isotopomers were significantly increased in Mpc1/2KD cells (Figure 2G). Furthermore, the abundance of glutamine-derived alanine was significantly elevated (Figure 2H), consistent with higher flux through mitochondrial MEs as opposed to reductive carboxylation.
To further highlight the increased role of glutaminolysis in cells with Mpc knockdown we measured uncoupled respiration in the absence or presence of the glutaminase inhibitor, bis-2-(5-phenylacetamido-1,3,4-thiazol-2-yl)ethyl sulfide (BPTES). Uncoupler-stimulated respiration in Mpc1/2KD cells was more sensitive to BPTES treatment, signifying an increased reliance on glutamine oxidation in these cells (Figure 2I). Collectively, these results provide evidence that cells with depleted Mpc1 or Mpc2 increase oxidative glutamine metabolism to maintain flux through the TCA cycle.
MPC knockdown induces substrate switching for de novo lipogenesis
We next quantified isotope enrichment in palmitate and performed isotopomer spectral analysis (ISA) to determine 1) the percent of newly synthesized palmitate after tracer addition and 2) the relative contribution of glucose and glutamine to lipogenic AcCoA (Kharroubi et al., 1992; Metallo et al., 2012). Although we observed no significant change in relative palmitate synthesis upon Mpc depletion (Figure 2J), the extent of glutamine conversion to the lipogenic AcCoA pool was significantly increased in Mpc2KD cells (Figure 2K). Glutamine can contribute carbon to fatty acid synthesis via reductive carboxylation or oxidative glutaminolysis. The former pathway is highly active in cells proliferating under hypoxia or those with a compromised respiratory chain (Metallo et al., 2012; Mullen et al., 2012; Scott et al., 2011; Wise et al., 2011), while the latter pathway has been observed in B cell lymphoma (Le et al., 2012). While the contribution of glutamine flux through reductive carboxylation to lipogenesis increased in Control and Mpc2KD cells cultured under hypoxia (measured specifically using [5-13C]glutamine (Yoo et al., 2008)); flux through this pathway did not account for the increased glutamine-derived AcCoA in Mpc2KD cells grown under normoxia. The increased glutamine-derived AcCoA was almost exclusively attributed to the glutaminolysis pathway, as evidenced by transfer of label from [3-13C]glutamine to palmitate (Figure 2L, S1C). We also measured a significant increase in M2 labeling in Mpc2KD myoblasts cultured with [3-13C]glutamine (Figure 2M), which arises from condensation of labeled oxaloacetate and AcCoA (Figure S1C). No change in labeling was observed in lactate (Figure S1D), providing evidence that this ME flux was catalyzed within the mitochondrial compartment. These results demonstrate that Mpc knockdown causes metabolic reprogramming that is distinct from hypoxia-associated PDH inhibition (Kim et al., 2006; Papandreou et al., 2006), with an increased proportion of mitochondrial AcCoA derived from mitochondrial ME and PDH activity rather than reductive carboxylation.
At high concentrations pyruvate passively enters the matrix, bypassing the MPC (Bakker and van Dam, 1974; Halestrap, 1975). To further demonstrate that PDH activity is maintained in Mpc knockdown cells we quantified how glutamine to AcCoA conversion was affected by exogenous pyruvate. In the presence 10 mM extracellular pyruvate, Mpc2KD cells failed to increase the contribution of glutamine carbon to palmitate synthesis. Indeed, this difference was almost entirely accounted for by the conversion of exogenous [3-13C]pyruvate to lipogenic AcCoA through the PDH complex (Figure 2N).
Amino acid and β-oxidation fuel mitochondrial metabolism upon Mpc knockdown
To quantify changes in intracellular fluxes in a more unbiased and comprehensive manner we conducted 13C MFA on Mpc2KD and Control cells. Steady state mass isotopomer distributions (MIDs) measured in cells cultured with [U-13C5]glutamine and [1,2-13C2]glucose along with independently determined uptake/secretion fluxes were incorporated into a model of central carbon metabolism. (Ahn and Antoniewicz, 2011; Murphy et al., 2013). The INCA software suite was used to estimate fluxes and associated confidence intervals using an elementary metabolite unit-based algorithm (Antoniewicz et al., 2006; Young, 2014). Results are illustrated in Figures 3A and S2A-S2B and tabulated in Tables S1 and S2; a detailed description of the model, data, and assumptions are included in the Supplemental Experimental Procedures and in Table S3. Flux data indicated that mitochondrial pyruvate transport and PDH flux decreased significantly upon Mpc2 knockdown. Oxidative TCA flux through IDH was also decreased with no absolute increase in reductive carboxylation flux, while pyruvate cycling and glutaminolytic flux were increased. Increased flux through mitochondrial MEs at least partially sustained AcCoA metabolism. Intriguingly, an acceptable fit for Mpc2 knockdown cells could only be obtained when an exogenous source of AcCoA was included in the model. Flux from this AcCoA pool into the TCA cycle increased 5-fold in Mpc2KD cells compared to Control cells, suggesting that oxidation of mitochondrial substrates other than glutamine were also induced upon Mpc depletion (Figure 3A and Tables S1-S2).
Figure 3. Mpc knockdown increases fatty acid oxidation.

(A) Schematic of changes in flux through metabolic pathways in Mpc2KD relative to Control cells. (B) Citrate MID resulting from culture with [U-13C16]palmitate conjugated to BSA (UPalm). (C) % 13C enrichment resulting from culture with UPalm. (D) ATP-linked and maximal oxygen consumption rate, ± 20 μM etomoxir, ±3 μM BPTES. Culture medium supplemented with 0.5 mM carnitine. Error bars represent SD (B, C) or SEM (D). *, **, and *** indicate p<0.05, p<0.01, and p<0.001 respectively by two-tailed, equal variance, Student's t-test (B-D), or by ANOVA with Dunnett's post-hoc test (D).
Given the lack of branched chain amino acid (BCAA) oxidation to TCA intermediates observed in both Control and Mpc2KD cells (Figure S2C) we hypothesized that this AcCoA was derived from β-oxidation. To more explicitly determine if Mpc knockdown drives an increase in fatty acid oxidation, we cultured Mpc2KD and Control cells in the presence of [U-13C16]palmitate bound to bovine serum albumin (BSA) and observed 13C enrichment in TCA intermediates. We observed a significant increase in the relative abundance of M2 citrate from this tracer in Mpc2KD compared to control cells (Figure 3B). Increased label incorporation into numerous TCA metabolites downstream of citrate was also detected (Figure 3C), indicating that knockdown of Mpc2 induced a significant increase in fatty acid oxidation flux in C2C12 myoblasts.
To confirm the observed metabolic shifts in mitochondrial substrate utilization in an orthogonal manner we quantified the ATP-linked and maximal respiration of each cell line in the presence of either or both BPTES and etomoxir. The former compound inhibits glutamine oxidation via glutaminase whereas the latter inhibits fatty acid oxidation at carnitine palmitoyltransferase-1 (CPT1). ATP-linked respiration was only affected when all three pathways (i.e., pyruvate transport, glutamine and fatty acid oxidation) were inhibited (Figures 1D, 3D, and S2D for raw values). On the other hand, maximal respiration was significantly decreased by each individual treatment with the most pronounced effect being observed when BPTES and etomoxir were both added to the culture (Figures 1D, 3D, and S2E for raw values). The synergistic effect of inhibiting these three mitochondrial substrate oxidation pathways highlights the plasticity of mitochondrial metabolism in respiring cells and independently demonstrates that Mpc depletion potentiates cells to employ fatty acid and amino acid oxidation to meet their bioenergetic demands.
Small molecule inhibition of MPC enhances amino acid and fatty acid oxidation
Pharmacological inhibition of Mpc function rather than shRNAs may provide a more clinically relevant means of exploiting mitochondrial flexibility. To determine whether small molecules targeting the Mpc elicit similar effects to inhibition at the transcriptional level we treated cells with UK5099, which covalently binds to Mpc and blocks pyruvate transport (Hildyard et al., 2005). Culture of proliferating C2C12 cells for 24 hours with 10 μM UK5099 in the presence of [U-13C6]glucose revealed a relative decrease in glucose flux to the TCA cycle, and results using [U-13C5]glutamine indicate that glutaminolytic flux through malic enzyme was significantly increased, as evidenced by the relative abundance of M6 citrate (Figures 4A-4B). As observed in the comparison to hypoxia (Figure 2L), the metabolic response to UK5099 treatment is distinct to that occurring in response to Complex I inhibition. Whereas oxidative TCA flux is maintained during UK5099 treatment, rotenone, a potent inhibitor of complex I, shuts down oxidative glutamine metabolism and increases reductive carboxylation activity, resulting in a dramatic increase in the relative abundance of M5 citrate from [U-13C5]glutamine (Figure 4B). C2C12 myoblasts also displayed a shift away from glucose to glutamine as a substrate for fatty acid synthesis in the presence of UK5099 (Figure 4C).
Figure 4. Metabolic reprogramming resulting from pharmacological Mpc inhibition is distinct from hypoxia or Complex I inhibition.
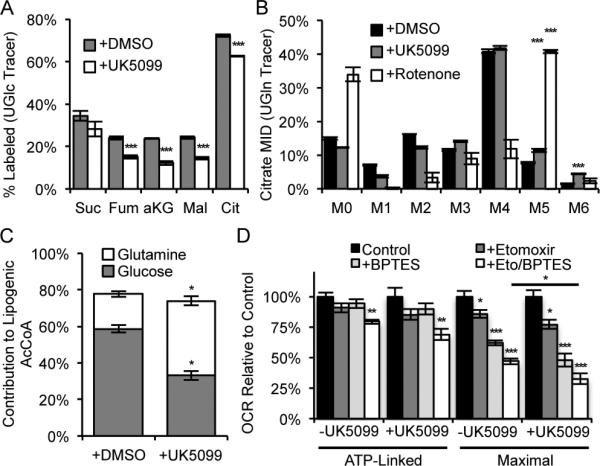
(A) % 13C labeled metabolites from UGlc, ±10 μM UK5099. (B) Citrate MID resulting from culture with UGln, ±10 μM UK5099, or ±30 nM rotenone. (C) Relative contribution of UGlc and UGln to lipogenic AcCoA, ±10 μM UK5099. (D) ATP-linked and maximal oxygen consumption rate, ±10 μM UK5099, ±20 μM etomoxir, and ±3 μM BPTES. Culture medium supplemented with 0.5 mM carnitine. Error bars represent a SD (A, B), 95% confidence intervals (C), or SEM (D). *, **, and *** indicate p<0.05, p<0.01, and p<0.001 respectively by two-tailed, equal variance, Student's t-test (A, D), by ANOVA with Dunnett's post-hoc test (B, D), or by non-overlapping 95% confidence intervals (C).
Additionally, ATP-linked and uncoupled oxygen consumption were measured when C2C12 cells were cultured for 24 h with UK5099 to examine their dependency on different oxidative substrates. We observed no change in ATP-linked or maximal respiration with UK5099 treatment, presumably due to the metabolic plasticity of cells when other pathways (i.e., glutamine and fatty acid oxidation) were not inhibited (Figures 4D, S2F-S2G for raw values). However, when cells were treated with combinations of UK5099, BPTES, and etomoxir we detected a significant effect of UK5099 only with combinatorial treatments (Figures 4D, S2F-S2G for raw values). These results further highlight the flexibility of oxidative mitochondrial metabolism that can be induced by Mpc inhibition such that C2C12 cells meet their energetic demands through glutamine and fatty acid oxidation.
Proliferating human transformed cells reprogram metabolism
To validate these findings in human cells using independent shRNAs, MPC levels were also depleted in A549 carcinoma cells using shRNAs targeting MPC1 (MPC1KD), MPC2 (MPC2KD), or a Control sequence. These cells were cultured with [U-13C6]glucose, [U-13C5]glutamine, and [U-13C16]palmitate-BSA to observe metabolic reprogramming in response to MPC depletion. Results supported findings in C2C12 myoblasts, as glucose conversion to citrate, TCA intermediates, and alanine were all significantly decreased in MPC1/2KD A549 cells (Figures S3A-S3C). On the other hand, glutamine anaplerosis and oxidation through malic enzymes were elevated upon MPC KD in these cells, as evidenced by labeling of TCA intermediates (citrate in particular) and alanine from [U-13C5]glutamine and [3-13C]glutamine (Figure S3D-S3G). Finally, we observed that MPC1KD in A549 cells exhibited an increased reliance on fatty acid oxidation to fuel TCA cycle metabolism, as 13C labeling of citrate and other TCA metabolites derived from [U-13C]palmitate increased significantly (Figures S3H-S3I). A549 cells also responded to pharmacological inhibition of MPC by UK5099, as glucose contribution to the TCA cycle declined (Figure S3J) and glutamine oxidation increased (Figure S3K). Finally, both A549 cells and the Huh7 human hepatocarcinoma cell line increased their reliance on fatty acid oxidation to fuel TCA metabolism upon MPC inhibition (Figure S3L-S3M).
MPC influences mitochondrial substrate utilization in differentiated myotubes
To determine whether Mpc functions similarly in more differentiated cells we formed myotubes using Control, Mpc1KD, and Mpc2KD C2C12 cells via four-day treatments with 2% horse serum. Differentiation was confirmed by observing elongation and fusion of myoblasts to form multi-nucleated tubes using light microscopy and by immunofluorescent staining of desmin, a marker of differentiated muscle (Figure S4A). Maintenance of the knockdown upon differentiation was confirmed at the protein and mRNA levels (Figures 5A-5B). Knockdown of Mpc did not affect glycolytic flux in C2C12 myotubes, as lactate secretion, glucose uptake and the ratio of the two were surprisingly unchanged (Figure 5C). Furthermore, respiratory inhibition of intact cells presented with all substrates was evident only when oxidative phosphorylation was uncoupled, yet Mpc activity was clearly compromised as indicated by a decreased rate of pyruvate-driven respiration in permeabilized myotubes (Figure 5D).
Figure 5. Mpc controls oxidative substrate utilization in myotubes.

(A, B) Protein (A) and mRNA (B) levels of Mpc1 and Mpc2. (C) Extracellular substrate fluxes in Control or Mpc2KD C2C12 myotubes. (D) ATP-linked and maximal OCR of intact C2C12 myotubes and pyruvate-dependent OCR of permeabilized C2C12 myotubes. (E, F) % 13C enrichment resulting from culture of C2C12 myotubes with UGlc (E) and 3Pyr (F) for 2 hours, ±5 μM UK5099. (G) Citrate MID resulting from culture of C2C12 myotubes with UGln, ±10 μM UK5099. (H) % 13C enrichment in Patient 1 hSKMs cultured with with [U-13C5]valine, [U-13C6]leucine, and [U-13C6]isoleucine (collectively UBCAA), ±10 μM UK5099. (I) hSKMs glutamate MID resulting from culture with [U-13C6]glucose, ±10 μM UK5099. Error bars represent minimum and maximum relative expression as calculated by qPCR data analysis software (B), SD (C, E-I), or SEM (D). *, **, and *** indicate p<0.05, p<0.01, and p<0.001 respectively by a two-tailed, equal variance, Student's t-test (C, E-I), or by ANOVA with Dunnett's post-hoc test (D).
Targeted metabolomic analysis revealed increases in intracellular abundances of pyruvate and aspartate in Mpc2KD myotubes (Figure S4B). In contrast to proliferating cells, myotubes rely primarily on glucose carbon for the generation of TCA intermediates (rather than glutamine) (Figure S4C). To better resolve changes in pyruvate metabolism upon Mpc knockdown or inhibition we cultured myotubes in the presence of either [U-13C6]glucose or [3-13C]pyruvate for 2 hours before quantifying isotopic labeling in TCA intermediates. Enrichment of glucose and pyruvate carbons in the TCA cycle was significantly decreased in response to UK5099 treatment (Figures 5E-5F) or when comparing Mpc2KD to Control myotubes (Figures S4D-S4E). Importantly, the pool sizes of all intermediates shown was less than or equal to those quantified in controls. As such, the decreased labeling observed under non-steady state conditions is indicative of decreases in metabolic flux (rather than pool size changes). Additionally, we observed a significant increase in glutaminolysis in C2C12 myotubes treated with UK5099, as evidenced by steady-state labeling from [U-13C5]glutamine (Figure 5G). Similar trends were observed in myotubes generated using Control or Mpc2KD cells (Figure S4F). Although the lower metabolic rate of non-proliferating myotubes (compared to proliferating cells) minimized the observed differences and limited our ability to quantify fatty acid oxidation in these cultures, results indicate that Mpc inhibition induces differentiated myotubes to increase glutamine oxidation.
Whereas glutamine is an important substrate for proliferating cells, BCAAs are critical bioenergetic substrates for muscle and other tissues, particularly in the fasted state (Rosenthal et al., 1974). BCAAs have recently been demonstrated to accumulate in the context of obesity and insulin resistance (Adams, 2011; Newgard et al., 2009; Wang et al., 2011), though the mechanisms leading to this metabolic phenotype (i.e., higher intake, decreased catabolism) are not yet clear. We failed to detect significant flux through this pathway in any of the C2C12 myoblasts (Figure S2C), myotubes, or engineered lines generated here using [13C]BCAA tracers. To determine whether MPC inhibition promoted BCAA catabolism in a more physiologically relevant system we cultured hSKMs in medium containing [U-13C5]valine, [U-13C6]leucine, and [U-13C6]isoleucine in the presence or absence of UK5099. Notably, 13C enrichment throughout the TCA cycle was significantly increased in hSKMs treated with 10 μM UK5099 compared to controls (Figures 5H and S4G). As expected, glucose oxidation was inhibited in hSKMs cultured with UK5099 (Figure 5I). Consistent increases in BCAA oxidation were observed in hSKMs obtained from 2 independent subjects (Figures 5H and S4G). These results suggest that mitochondrial substrate utilization can be controlled in terminally differentiated hSKMs by modulating Mpc activity to influence BCAA catabolism.
DISCUSSION
Traditional approaches to modulate eukaryotic cell metabolism have focused on controlling enzyme activity and/or expression. Such treatments can cause bottlenecks and place constraints on cells that limit metabolism globally. Since metabolic processes in eukaryotes are segregated within the mitochondrial matrix, cytosol, and other subcellular compartments, an alternate approach may be to target compartment-specific transporters and exploit the inherent metabolic flexibility of cells to control substrate utilization. In this manner, cells and tissues that pathologically rely on particular nutrients (e.g., anabolic glucose metabolism in diabetes, obesity, and cancer) may be coaxed to shift toward a catabolic state of metabolism while maintaining enzyme activity throughout the cell. A critical step in this process is to functionally characterize how substrate utilization and intracellular metabolic activity (i.e., fluxes) are reprogrammed upon inhibition of specific transporters (Zamboni et al., 2009). Here we have outlined the metabolic phenotype of cell lines and hSKMs that emerges upon inhibition of the mitochondrial pyruvate transporter encoded by MPC1 and MPC2. The observed changes in substrate utilization provide some insights through which MPC inhibition can elicit beneficial effects via reprogramming of mitochondrial metabolism.
Knockdown of either Mpc1 or Mpc2 abrogated expression of both proteins, as observed previously (Divakaruni et al., 2013). Comprehensive 13C MFA integrating data from parallel tracer experiments using [13C]glucose and [13C]glutamine was applied to MPC knockdown cells, as this modeling approach has been shown to increase flux resolution throughout central carbon metabolism (Ahn and Antoniewicz, 2013). Although ATP-linked respiration and cell growth remained unchanged, we identified specific changes in amino acid and fatty acid metabolism that were recapitulated using the MPC inhibitor UK5099. Glucose metabolism in the TCA cycle was significantly decreased but not completely, presumably due to incomplete knockdown, passive diffusion, or the presence of an alternate or non-facilitated transport mechanism. Rather than divert excess cytosolic pyruvate to lactate or alanine, this carbon was either secreted from cells as pyruvate or converted to serine. This latter activity may be driven by accumulation of glycolytic intermediates (Chaneton et al., 2012; Ye et al., 2012) or due to increased serine catabolism in mitochondria (Jain et al., 2012; Lewis et al., 2014). Notably, alanine levels were significantly decreased in Mpc knockdown cells, highlighting a role for mitochondrial pyruvate and mitochondrial alanine aminotransferase (ALT2) in mediating glutamine anaplerosis which was previously described in cancer cells (Weinberg et al., 2010). The accumulation of aspartate in these cells provides evidence of the expected switch to rely on oxaloacetate and mitochondrial glutamic-oxaloacetic transaminase 2 (GOT2) to facilitate this process (Figure S1B). A similar response was observed in isolated retina treated with the MPC inhibitor Zaprinast (Du et al., 2013).
In addition to these metabolomic changes we also observed increased amino acid and fatty acid oxidation upon inhibition of MPC. Elevated glutamine anaplerosis and oxidation are likely a consequence of decreased citrate synthase and oxidative IDH flux downstream of PDH while the ETC remained active (Fan et al., 2013; Le et al., 2012). We also observed a significant increase in BCAA oxidation upon MPC inhibition using hSKM cultures, which are of perhaps greater physiological relevance than C2C12 cells. Consistent with this change, Bricker et al. (Bricker et al., 2012) and Herzig et al. (Herzig et al., 2012) both observed growth defects in medium lacking leucine or valine in their characterizations of yeast with Mpc deletions. Mpc inhibition may potentiate oxidation of BCAAs or other amino acids that accumulate in the context of insulin resistance (Adams, 2011; Newgard et al., 2009; Wang et al., 2011). Citrate mass isotopomer labeling and flux estimations also highlighted a significant increase in flux through malic enzyme upon Mpc knockdown, which could provide additional reducing equivalents [NAD(P)H] within the matrix. These results are consistent with the severe growth defect previously observed in yeast with deletions in both mpc1 and mitochondrial malic enzyme growing on glucose (Bricker et al., 2012), highlighting the remarkably conserved nature of metabolism across species.
An initial lack of fit observed in our Mpc knockdown model led us to hypothesize that fatty acid oxidation was increased under these conditions. This response was validated by tracing with [13C]palmitate-BSA in myoblasts and cancer cells and using either shRNAs or UK5099 to inhibit mitochondrial pyruvate transport. Here β-oxidation was presumably stimulated, in part, due to decreases in citrate and the downstream lipogenic intermediate malonyl-CoA, which inhibits CPT1 (McGarry et al., 1983). In this manner, pharmacological inhibition of the MPC could stimulate catabolic metabolism in muscle or liver.
Our analyses also more explicitly delineate the roles of MPC1 and MPC2 as components of the mitochondrial pyruvate transporter. Although strong evidence supports this functionality (Bricker et al., 2012; Divakaruni et al., 2013; Herzig et al., 2012), MPC-mediated regulation of pyruvate dehydrogenase (PDH) complex activity has been suggested as an alternative function of the MPC proteins (Halestrap, 2012). While our MFA results indicated that overall flux through PDH was decreased in Mpc2 knockdown cells, supplementation of pyruvate at concentrations expected to enter mitochondria through passive diffusion abrogated the increase in glutamine to fatty acid conversion. Furthermore, conversion of [13C]pyruvate carbons to lipogenic AcCoA confirmed this pyruvate was metabolized by PDH, since carbon atoms in oxaloacetate do not enter the AcCoA pool without PDH activity.
These results also demonstrate that MPC inhibition elicits a distinct metabolic phenotype compared to hypoxia or ETC inhibition. Whereas elevated glycolytic rates and reductive carboxylation are predominant modes of metabolism under such conditions (Metallo et al., 2012; Mullen et al., 2012; Scott et al., 2011; Wise et al., 2011), Mpc inhibition instead promoted oxidative glutaminolysis to fuel the mitochondrial AcCoA pool. Surprisingly, we observed no increase in reductive carboxylation flux. Fatty acid synthesis rates were also maintained upon Mpc knockdown, in contrast to that observed when comparing normoxic and hypoxic cell growth (Kamphorst et al., 2013; Metallo et al., 2012).
It is well established that oxidation of glucose and fatty acids are dynamically balanced in response to nutrient availability and hormonal control (Keung et al., 2013; Muoio et al., 2012), and disruptions of these processes are evident in metabolic and heart disease. Extensive studies support that inhibition of fatty acid oxidation, via genetic manipulation or pharmacologic intervention, can increase the rate of pyruvate oxidation (Fillmore and Lopaschuk, 2013). However, the converse principle has yet to be shown: that a reduction in pyruvate oxidation can stimulate β-oxidation. This may be partly due to the lack of a druggable therapeutic target. Our model, though, suggests that inhibition of mitochondrial pyruvate uptake can rewire cellular metabolism to boost fatty acid oxidation, which may provide an approach to further studies of the interplay between carbohydrate and fat metabolism. Given the importance of this metabolic control point, significant interest in identifying drugs that control MPC activity has emerged (Colca et al., 2013; Divakaruni et al., 2013; Du et al., 2013). The metabolic phenotype of MPC inhibition defined here using both shRNAs and UK5099 in cultured cell lines and hSKMs will provide a roadmap for molecular level validation of new compounds, facilitating the ability of researchers to identify drugs that target MPC versus other mitochondrial enzymes. Indeed, the phosphodiesterase inhibitor Zaprinast was recently demonstrated to inhibit mitochondrial pyruvate uptake. While Du et al. similarly observed an increase in aspartate levels, no evidence of glutaminolysis through malic enzyme was observed (Du et al., 2013), potentially due to off-target effects on mitochondrial glutaminase (Elhammali et al., 2014). These findings highlight the need for systems-level analyses of metabolism to functionally validate gene function and drug specificity. In turn, the identification of selective compounds that influence mitochondrial substrate transport and utilization may provide new therapeutic avenues to exploit the exquisite flexibility of these organelles.
EXPERIMENTAL PROCEDURES
Cell Culture and 13C Tracing
C2C12, A549, and Huh7 cells were cultured in DMEM with 10% FBS. Terminal differentiation of C2C12 cells was initiated by four-day culture in DMEM with 2% horse serum. Human skeletal muscle satellite cells were proliferated in SkFM (Lonza, Walkerville, MD) and then differentiated to myotubes in MEMα supplemented with 2% FBS as described previously (Henry et al., 1995). For tracer and MFA studies, custom, phenol red-free DMEM or amino acid-free DMEM/F12 (for hSKMs) was formulated by replacing the substrate of interest with 13C-labeled glucose, glutamine, pyruvate, or BCAAs (all from Cambridge Isotopes) with other components unlabeled. Cultures were washed with PBS before adding tracer media for 15-30 hours unless otherwise specified. Fatty acid oxidation studies were conducted using [U-13C16]palmitate non-covalently bound to fatty acid-free BSA. [U-13C16]palmitate-BSA was added to culture medium at 5% of the final volume (50 μM final concentration) with 1 mM carnitine in medium formulated with FBS that was delipidated using fumed silica (Sigma) according to the manufacturer's instructions.
Metabolic Flux Analysis
MFA was performed using the elementary metabolite units based software package INCA. Inputs to the model include the chemical reactions and atom transitions of central carbon metabolism, measured substrate extracellular fluxes, the identity of the 13C labeled tracers, and mass isotopomer distributions of select intracellular metabolites. Assumptions are listed in the Supplemental Experimental Procedures.
Oxygen Consumption Measurements
Respiration was measured in adherent monolayers of C2C12 myocytes using a Seahorse XF96 Analyzer. Myoblasts were plated at 1×10⁴ cells/well and grown for two days. Cells were assayed in unbuffered DMEM (Sigma #D5030) supplemented with 8 mM glucose and 3 mM glutamine. Unless stated in the figure legend, pyruvate was omitted from the assay medium. ATP-linked respiration was calculated as the oxygen consumption rate sensitive to 2 μg/mL oligomycin. Maximal respiration was calculated as the difference between protonophore-stimulated respiration (measured as the highest rate from sequential additions of FCCP; final concentrations between 400 and 800 nM) and non-mitochondrial respiration (measured after addition of 2 μM rotenone and 2 μM antimycin A). Where indicated, etomoxir (20 μM) or BPTES (3 μM) were added to the plate 20 minutes prior to basal respiration measurements. Respiration in permeabilized cells (1 nM XF PMP, Seahorse Bioscience) was measured in cells offered 5 mM pyruvate, 0.5 mM malate, 2 mM DCA, 2 μg/mL oligomycin, and 400 nM FCCP. All data are mean ± S.E.M. of at least four biological replicates (with a minimum of 5 technical replicates per experiment). Statistical analysis was conducted using ANOVA of repeated measures with Dunnett's post-hoc test. Where appropriate, the square root of normalized data was analyzed.
Metabolite Extraction and GC/MS analysis
At the conclusion of a tracer experiment the tracer media was removed from the culture wells, the cells washed with a saline solution and the bottom of the well covered with cold methanol to lyse the cells and halt metabolism. Water containing norvaline at 5 μg/mL was charged to each well at a volume ratio of 1:2.5 relative to the methanol. The bottom of each well was scraped with a 1000 μL pipette tip and the cells collected in 1.5 mL tubes. Cold chloroform containing 2 μg/mL of heptadodecnaoate was added to each sample at a 1:1 volume ratio relative to the methanol. The mixtures were vortexed, and the polar and non-polar layers were separated and evaporated after centrifugation. Details of the derivatization process can be found in the Supplemental Experimental Procedures.
Derivatized metabolites were analyzed using a DB-35MS column (30m × 0.25mm i.d. × 0.25μm, Agilent J&W Scientific) in an Agilent 7890A gas chromatograph coupled to a 5975C mass spectrometer. Details of the chromatography method and mass spectrometry scanning parameters can be found in the Supplemental Experimental Procedures.
Human Subjects
All human skeletal muscle biopsies were obtained with approval from the University of California San Diego's Committee on Human Investigation. All donors provided informed written consent after listening to an explanation of the protocol.
Supplementary Material
ACKNOWLEDGEMENTS
We thank Sandra E. Wiley, Hui Zhang, Ryan LaCroix, Spencer Lee, and Mehmet G. Badur for technical assistance and members of the Metallo lab for discussions. This work was supported, in part, by NIH grants P30DK063491, R01CA188652, T32HL105373 (to NMV), DOD grant W81XWH-13-1-0105, a Hellman Faculty Fellowship, and a Searle Scholar Award (to CMM), a grant from the Medical Research Service, Department of Veterans Affairs, VA San Diego Healthcare System (to RRH), and NIH grant R01NS087611 and Seahorse Bioscience (to ANM).
Footnotes
Publisher's Disclaimer: This is a PDF file of an unedited manuscript that has been accepted for publication. As a service to our customers we are providing this early version of the manuscript. The manuscript will undergo copyediting, typesetting, and review of the resulting proof before it is published in its final citable form. Please note that during the production process errors may be discovered which could affect the content, and all legal disclaimers that apply to the journal pertain.
REFERENCES
- Adams SH. Emerging perspectives on essential amino acid metabolism in obesity and the insulin-resistant state. Adv Nutr. 2011;2:445–456. doi: 10.3945/an.111.000737. [DOI] [PMC free article] [PubMed] [Google Scholar]
- Ahn WS, Antoniewicz MR. Metabolic flux analysis of CHO cells at growth and non-growth phases using isotopic tracers and mass spectrometry. Metabolic engineering. 2011;13:598–609. doi: 10.1016/j.ymben.2011.07.002. [DOI] [PubMed] [Google Scholar]
- Ahn WS, Antoniewicz MR. Parallel labeling experiments with [1,2-(13)C]glucose and [U-(13)C]glutamine provide new insights into CHO cell metabolism. Metabolic engineering. 2013;15:34–47. doi: 10.1016/j.ymben.2012.10.001. [DOI] [PubMed] [Google Scholar]
- Antoniewicz MR, Kelleher JK, Stephanopoulos G. Determination of confidence intervals of metabolic fluxes estimated from stable isotope measurements. Metab Eng. 2006;8:324–337. doi: 10.1016/j.ymben.2006.01.004. [DOI] [PubMed] [Google Scholar]
- Bakker EP, van Dam K. The movement of monocarboxylic acids across phospholipid membranes: evidence for an exchange diffusion between pyruvate and other monocarboxylate ions. Biochim Biophys Acta. 1974;339:285–289. doi: 10.1016/0005-2736(74)90325-3. [DOI] [PubMed] [Google Scholar]
- Bricker DK, Taylor EB, Schell JC, Orsak T, Boutron A, Chen YC, Cox JE, Cardon CM, Van Vranken JG, Dephoure N, et al. A mitochondrial pyruvate carrier required for pyruvate uptake in yeast, Drosophila, and humans. Science. 2012;337:96–100. doi: 10.1126/science.1218099. [DOI] [PMC free article] [PubMed] [Google Scholar]
- Chaneton B, Hillmann P, Zheng L, Martin AC, Maddocks OD, Chokkathukalam A, Coyle JE, Jankevics A, Holding FP, Vousden KH, et al. Serine is a natural ligand and allosteric activator of pyruvate kinase M2. Nature. 2012;491:458–462. doi: 10.1038/nature11540. [DOI] [PMC free article] [PubMed] [Google Scholar]
- Clark JB, Land JM. Differential effects of 2-oxo acids on pyruvate utilization and fatty acid synthesis in rat brain. Biochem J. 1974;140:25–29. doi: 10.1042/bj1400025. [DOI] [PMC free article] [PubMed] [Google Scholar]
- Colca JR, McDonald WG, Cavey GS, Cole SL, Holewa DD, Brightwell-Conrad AS, Wolfe CL, Wheeler JS, Coulter KR, Kilkuskie PM, et al. Identification of a mitochondrial target of thiazolidinedione insulin sensitizers (mTOT)--relationship to newly identified mitochondrial pyruvate carrier proteins. PLoS One. 2013;8:e61551. doi: 10.1371/journal.pone.0061551. [DOI] [PMC free article] [PubMed] [Google Scholar]
- Cunnane S, Nugent S, Roy M, Courchesne-Loyer A, Croteau E, Tremblay S, Castellano A, Pifferi F, Bocti C, Paquet N, et al. Brain fuel metabolism, aging, and Alzheimer's disease. Nutrition. 2011;27:3–20. doi: 10.1016/j.nut.2010.07.021. [DOI] [PMC free article] [PubMed] [Google Scholar]
- Currie E, Schulze A, Zechner R, Walther TC, Farese RV., Jr. Cellular fatty acid metabolism and cancer. Cell Metab. 2013;18:153–161. doi: 10.1016/j.cmet.2013.05.017. [DOI] [PMC free article] [PubMed] [Google Scholar]
- DeFronzo RA, Tripathy D. Skeletal muscle insulin resistance is the primary defect in type 2 diabetes. Diabetes Care 32 Suppl. 2009;2:S157–163. doi: 10.2337/dc09-S302. [DOI] [PMC free article] [PubMed] [Google Scholar]
- Divakaruni AS, Wiley SE, Rogers GW, Andreyev AY, Petrosyan S, Loviscach M, Wall EA, Yadava N, Heuck AP, Ferrick DA, et al. Thiazolidinediones are acute, specific inhibitors of the mitochondrial pyruvate carrier. Proc Natl Acad Sci U S A. 2013;110:5422–5427. doi: 10.1073/pnas.1303360110. [DOI] [PMC free article] [PubMed] [Google Scholar]
- Du J, Cleghorn WM, Contreras L, Lindsay K, Rountree AM, Chertov AO, Turner SJ, Sahaboglu A, Linton J, Sadilek M, et al. Inhibition of mitochondrial pyruvate transport by Zaprinast causes massive accumulation of aspartate at the expense of glutamate in the retina. J Biol Chem. 2013 doi: 10.1074/jbc.M113.507285. [DOI] [PMC free article] [PubMed] [Google Scholar]
- Elhammali A, Ippolito JE, Collins L, Crowley J, Marasa J, Piwnica-Worms D. A High-Throughput Fluorimetric Assay for 2-hydroxyglutarate Identifies Zaprinast as a Glutaminase Inhibitor. Cancer Discov. 2014 doi: 10.1158/2159-8290.CD-13-0572. [DOI] [PMC free article] [PubMed] [Google Scholar]
- Fan J, Kamphorst JJ, Mathew R, Chung MK, White E, Shlomi T, Rabinowitz JD. Glutamine-driven oxidative phosphorylation is a major ATP source in transformed mammalian cells in both normoxia and hypoxia. Mol Syst Biol. 2013;9:712. doi: 10.1038/msb.2013.65. [DOI] [PMC free article] [PubMed] [Google Scholar]
- Fillmore N, Lopaschuk GD. Targeting mitochondrial oxidative metabolism as an approach to treat heart failure. Biochim Biophys Acta. 2013;1833:857–865. doi: 10.1016/j.bbamcr.2012.08.014. [DOI] [PubMed] [Google Scholar]
- Halestrap AP. The mitochondrial pyruvate carrier. Kinetics and specificity for substrates and inhibitors. Biochem J. 1975;148:85–96. doi: 10.1042/bj1480085. [DOI] [PMC free article] [PubMed] [Google Scholar]
- Halestrap AP. The mitochondrial pyruvate carrier: has it been unearthed at last? Cell Metab. 2012;16:141–143. doi: 10.1016/j.cmet.2012.07.013. [DOI] [PubMed] [Google Scholar]
- Halestrap AP, Denton RM. Specific inhibition of pyruvate transport in rat liver mitochondria and human erythrocytes by alpha-cyano-4-hydroxycinnamate. Biochem J. 1974;138:313–316. doi: 10.1042/bj1380313. [DOI] [PMC free article] [PubMed] [Google Scholar]
- Henry RR, Abrams L, Nikoulina S, Ciaraldi TP. Insulin action and glucose metabolism in nondiabetic control and NIDDM subjects. Comparison using human skeletal muscle cell cultures. Diabetes. 1995;44:936–946. doi: 10.2337/diab.44.8.936. [DOI] [PubMed] [Google Scholar]
- Herzig S, Raemy E, Montessuit S, Veuthey JL, Zamboni N, Westermann B, Kunji ER, Martinou JC. Identification and functional expression of the mitochondrial pyruvate carrier. Science. 2012;337:93–96. doi: 10.1126/science.1218530. [DOI] [PubMed] [Google Scholar]
- Hildyard JC, Ammala C, Dukes ID, Thomson SA, Halestrap AP. Identification and characterisation of a new class of highly specific and potent inhibitors of the mitochondrial pyruvate carrier. Biochim Biophys Acta. 2005;1707:221–230. doi: 10.1016/j.bbabio.2004.12.005. [DOI] [PubMed] [Google Scholar]
- Jain M, Nilsson R, Sharma S, Madhusudhan N, Kitami T, Souza AL, Kafri R, Kirschner MW, Clish CB, Mootha VK. Metabolite profiling identifies a key role for glycine in rapid cancer cell proliferation. Science. 2012;336:1040–1044. doi: 10.1126/science.1218595. [DOI] [PMC free article] [PubMed] [Google Scholar]
- Kamphorst JJ, Cross JR, Fan J, de Stanchina E, Mathew R, White EP, Thompson CB, Rabinowitz JD. Hypoxic and Ras-transformed cells support growth by scavenging unsaturated fatty acids from lysophospholipids. Proc Natl Acad Sci U S A. 2013;110:8882–8887. doi: 10.1073/pnas.1307237110. [DOI] [PMC free article] [PubMed] [Google Scholar]
- Kerr DS. Review of clinical trials for mitochondrial disorders: 1997-2012. Neurotherapeutics. 2013;10:307–319. doi: 10.1007/s13311-013-0176-7. [DOI] [PMC free article] [PubMed] [Google Scholar]
- Keung W, Ussher JR, Jaswal JS, Raubenheimer M, Lam VH, Wagg CS, Lopaschuk GD. Inhibition of carnitine palmitoyltransferase-1 activity alleviates insulin resistance in diet-induced obese mice. Diabetes. 2013;62:711–720. doi: 10.2337/db12-0259. [DOI] [PMC free article] [PubMed] [Google Scholar]
- Kharroubi AT, Masterson TM, Aldaghlas TA, Kennedy KA, Kelleher JK. Isotopomer spectral analysis of triglyceride fatty acid synthesis in 3T3-L1 cells. Am J Physiol. 1992;263:E667–675. doi: 10.1152/ajpendo.1992.263.4.E667. [DOI] [PubMed] [Google Scholar]
- Kim JW, Tchernyshyov I, Semenza GL, Dang CV. HIF-1-mediated expression of pyruvate dehydrogenase kinase: a metabolic switch required for cellular adaptation to hypoxia. Cell Metab. 2006;3:177–185. doi: 10.1016/j.cmet.2006.02.002. [DOI] [PubMed] [Google Scholar]
- Le A, Lane AN, Hamaker M, Bose S, Gouw A, Barbi J, Tsukamoto T, Rojas CJ, Slusher BS, Zhang H, et al. Glucose-independent glutamine metabolism via TCA cycling for proliferation and survival in B cells. Cell Metab. 2012;15:110–121. doi: 10.1016/j.cmet.2011.12.009. [DOI] [PMC free article] [PubMed] [Google Scholar]
- Lewis CA, Parker SJ, Fiske BP, McCloskey D, Gui DY, Green CR, Vokes NI, Feist AM, Vander Heiden MG, Metallo CM. Tracing compartmentalized NADPH metabolism in the cytosol and mitochondria of Mammalian cells. Mol Cell. 2014;55:253–263. doi: 10.1016/j.molcel.2014.05.008. [DOI] [PMC free article] [PubMed] [Google Scholar]
- McGarry JD, Mills SE, Long CS, Foster DW. Observations on the affinity for carnitine, and malonyl-CoA sensitivity, of carnitine palmitoyltransferase I in animal and human tissues. Demonstration of the presence of malonyl-CoA in non-hepatic tissues of the rat. Biochem J. 1983;214:21–28. doi: 10.1042/bj2140021. [DOI] [PMC free article] [PubMed] [Google Scholar]
- Metallo CM, Gameiro PA, Bell EL, Mattaini KR, Yang J, Hiller K, Jewell CM, Johnson ZR, Irvine DJ, Guarente L, et al. Reductive glutamine metabolism by IDH1 mediates lipogenesis under hypoxia. Nature. 2012;481:380–384. doi: 10.1038/nature10602. [DOI] [PMC free article] [PubMed] [Google Scholar]
- Metallo CM, Vander Heiden MG. Understanding metabolic regulation and its influence on cell physiology. Mol Cell. 2013;49:388–398. doi: 10.1016/j.molcel.2013.01.018. [DOI] [PMC free article] [PubMed] [Google Scholar]
- Mullen AR, Wheaton WW, Jin ES, Chen PH, Sullivan LB, Cheng T, Yang Y, Linehan WM, Chandel NS, DeBerardinis RJ. Reductive carboxylation supports growth in tumour cells with defective mitochondria. Nature. 2012;481:385–388. doi: 10.1038/nature10642. [DOI] [PMC free article] [PubMed] [Google Scholar]
- Muoio DM, Noland RC, Kovalik JP, Seiler SE, Davies MN, DeBalsi KL, Ilkayeva OR, Stevens RD, Kheterpal I, Zhang J, et al. Muscle-specific deletion of carnitine acetyltransferase compromises glucose tolerance and metabolic flexibility. Cell Metab. 2012;15:764–777. doi: 10.1016/j.cmet.2012.04.005. [DOI] [PMC free article] [PubMed] [Google Scholar]
- Murphy TA, Dang CV, Young JD. Isotopically nonstationary 13C flux analysis of Myc-induced metabolic reprogramming in B-cells. Metabolic engineering. 2013;15:206–217. doi: 10.1016/j.ymben.2012.07.008. [DOI] [PMC free article] [PubMed] [Google Scholar]
- Newgard CB, An J, Bain JR, Muehlbauer MJ, Stevens RD, Lien LF, Haqq AM, Shah SH, Arlotto M, Slentz CA, et al. A branched-chain amino acid-related metabolic signature that differentiates obese and lean humans and contributes to insulin resistance. Cell Metab. 2009;9:311–326. doi: 10.1016/j.cmet.2009.02.002. [DOI] [PMC free article] [PubMed] [Google Scholar]
- Papa S, Francavilla A, Paradies G, Meduri B. The transport of pyruvate in rat liver mitochondria. FEBS Lett. 1971;12:285–288. doi: 10.1016/0014-5793(71)80200-4. [DOI] [PubMed] [Google Scholar]
- Papa S, Paradies G. On the mechanism of translocation of pyruvate and other monocarboxylic acids in rat-liver mitochondria. Eur J Biochem. 1974;49:265–274. doi: 10.1111/j.1432-1033.1974.tb03831.x. [DOI] [PubMed] [Google Scholar]
- Papandreou I, Cairns RA, Fontana L, Lim AL, Denko NC. HIF-1 mediates adaptation to hypoxia by actively downregulating mitochondrial oxygen consumption. Cell Metab. 2006;3:187–197. doi: 10.1016/j.cmet.2006.01.012. [DOI] [PubMed] [Google Scholar]
- Patterson JN, Cousteils K, Lou JW, Manning Fox JE, Macdonald PE, Joseph JW. Mitochondrial metabolism of pyruvate is essential for regulating glucose-stimulated insulin secretion. J Biol Chem. 2014 doi: 10.1074/jbc.M113.521666. [DOI] [PMC free article] [PubMed] [Google Scholar]
- Rosenthal J, Angel A, Farkas J. Metabolic fate of leucine: a significant sterol precursor in adipose tissue and muscle. Am J Physiol. 1974;226:411–418. doi: 10.1152/ajplegacy.1974.226.2.411. [DOI] [PubMed] [Google Scholar]
- Scott DA, Richardson AD, Filipp FV, Knutzen CA, Chiang GG, Ronai ZA, Osterman AL, Smith JW. Comparative metabolic flux profiling of melanoma cell lines: beyond the Warburg effect. J Biol Chem. 2011;286:42626–42634. doi: 10.1074/jbc.M111.282046. [DOI] [PMC free article] [PubMed] [Google Scholar]
- Sugden MC, Zariwala MG, Holness MJ. PPARs and the orchestration of metabolic fuel selection. Pharmacol Res. 2009;60:141–150. doi: 10.1016/j.phrs.2009.03.014. [DOI] [PubMed] [Google Scholar]
- Tennant DA, Duran RV, Gottlieb E. Targeting metabolic transformation for cancer therapy. Nat Rev Cancer. 2010;10:267–277. doi: 10.1038/nrc2817. [DOI] [PubMed] [Google Scholar]
- Vigueira PA, McCommis KS, Schweitzer GG, Remedi MS, Chambers KT, Fu X, McDonald WG, Cole SL, Colca JR, Kletzien RF, et al. Mitochondrial pyruvate carrier 2 hypomorphism in mice leads to defects in glucose-stimulated insulin secretion. Cell reports. 2014;7:2042–2053. doi: 10.1016/j.celrep.2014.05.017. [DOI] [PMC free article] [PubMed] [Google Scholar]
- Wang TJ, Larson MG, Vasan RS, Cheng S, Rhee EP, McCabe E, Lewis GD, Fox CS, Jacques PF, Fernandez C, et al. Metabolite profiles and the risk of developing diabetes. Nat Med. 2011;17:448–453. doi: 10.1038/nm.2307. [DOI] [PMC free article] [PubMed] [Google Scholar]
- Weinberg F, Hamanaka R, Wheaton WW, Weinberg S, Joseph J, Lopez M, Kalyanaraman B, Mutlu GM, Budinger GR, Chandel NS. Mitochondrial metabolism and ROS generation are essential for Kras-mediated tumorigenicity. Proc Natl Acad Sci U S A. 2010;107:8788–8793. doi: 10.1073/pnas.1003428107. [DOI] [PMC free article] [PubMed] [Google Scholar]
- Wise DR, Ward PS, Shay JE, Cross JR, Gruber JJ, Sachdeva UM, Platt JM, DeMatteo RG, Simon MC, Thompson CB. Hypoxia promotes isocitrate dehydrogenase-dependent carboxylation of alpha-ketoglutarate to citrate to support cell growth and viability. Proc Natl Acad Sci U S A. 2011;108:19611–19616. doi: 10.1073/pnas.1117773108. [DOI] [PMC free article] [PubMed] [Google Scholar]
- Yao J, Rettberg JR, Klosinski LP, Cadenas E, Brinton RD. Shift in brain metabolism in late onset Alzheimer's disease: implications for biomarkers and therapeutic interventions. Mol Aspects Med. 2011;32:247–257. doi: 10.1016/j.mam.2011.10.005. [DOI] [PMC free article] [PubMed] [Google Scholar]
- Ye J, Mancuso A, Tong X, Ward PS, Fan J, Rabinowitz JD, Thompson CB. Pyruvate kinase M2 promotes de novo serine synthesis to sustain mTORC1 activity and cell proliferation. Proc Natl Acad Sci U S A. 2012;109:6904–6909. doi: 10.1073/pnas.1204176109. [DOI] [PMC free article] [PubMed] [Google Scholar]
- Yoo H, Antoniewicz MR, Stephanopoulos G, Kelleher JK. Quantifying reductive carboxylation flux of glutamine to lipid in a brown adipocyte cell line. J Biol Chem. 2008;283:20621–20627. doi: 10.1074/jbc.M706494200. [DOI] [PMC free article] [PubMed] [Google Scholar]
- Young JD. INCA: a computational platform for isotopically non-stationary metabolic flux analysis. Bioinformatics. 2014 doi: 10.1093/bioinformatics/btu015. [DOI] [PMC free article] [PubMed] [Google Scholar]
- Zamboni N, Fendt SM, Ruhl M, Sauer U. (13)C-based metabolic flux analysis. Nat Protoc. 2009;4:878–892. doi: 10.1038/nprot.2009.58. [DOI] [PubMed] [Google Scholar]
Associated Data
This section collects any data citations, data availability statements, or supplementary materials included in this article.