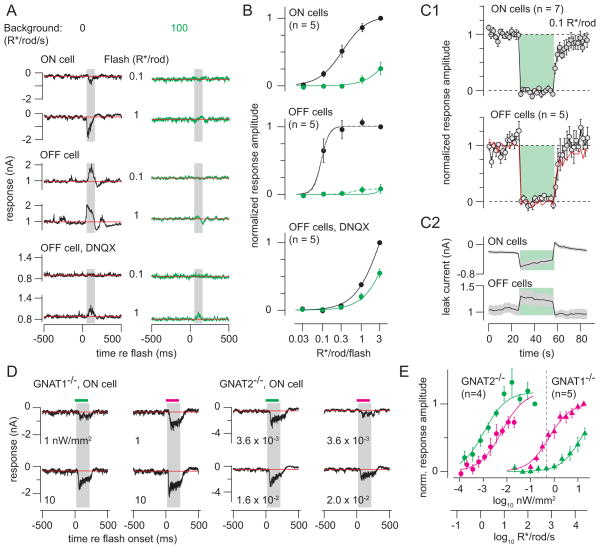
Figure 2. Background light suppresses rod-mediated flash responses.
(A) 10 ms flashes (at time 0) evoking 0.1 or 1 R*/rod (green light, 0.3-mm diameter) were presented on darkness or added to a background (100 R*/rod/s). Responses were measured in ON or OFF ganglion cells; OFF responses also were recorded in DNQX (100 μM). Vhold = −70 mV (ON cells) or 0 mV (OFF cells; 10 kHz sampling; 2 or 4 kHz Bessel filtering). Amplitudes were measured in a window 50–125 ms after flash onset (shaded region) after subtracting the baseline current (red line, measured over 500 ms prior to flash).
(B) Intensity-response functions for flashes presented on darkness (black) or background (green). Responses were normalized to the response to the brightest flash from darkness before averaging across cells. Error bars: ±SEM. Lines show fitted sigmoidal equations that share amplitude (A) and exponent (q) values but have unique half-saturation constants (σ). ON cell parameters: A = 1.0, σdark = 0.31, σbackground = 6.5, q = 1.4; OFF cell parameters: A = 1.0, σdark = 0.088, σbackground = 5.3, q = 4.2; OFF cell in DNQX parameters: A = 2.2, σdark = 3.5, σbackground = 7.0, q = 1.3. OFF cell data with the background were better captured by an independent fit (dashed line): A = 0.082, σbackground = 0.56, q = 2.6. (C1) Background-subtracted responses to flashes (0.1 R*/rod, 1-mm diameter spot) before, during and after presentation of a background (100 R*/rod/s) for 30 seconds (green region). Responses were normalized to the average flash response before the background presentation. (C2) Baseline currents measured between the flash responses for the data in C1. (D) Responses to flashes of either green or UV light (200 ms, 1-mm diameter spot) presented on darkness in mice lacking either rod (Gnat1−/−) or cone (Gnat2−/−) function. Intensity is indicated below each trace (nW/mm2). Background-subtracted responses were measured over a window 20–220 ms after flash onset. (E) Intensity-response functions for data in D. Responses were normalized across cells before averaging by dividing by the response to the brightest green stimulus (Gnat2−/−; n = 2 ON cells, 2 OFF cells) or UV stimulus (Gnat1−/−; n = 5 ON cells). Error bars: ±SEM across cells. Gnat2−/− parameters: A = 1.2, σgreen = 0.0011, σUV = 0.0061, q = 0.92; Gnat1−/− parameters: A = 1.0, σgreen = 14.3, σUV = 0.61, q = 0.98. Dashed vertical line indicates the brightest green light used in the remainder of this study (−0.33 log10 nW/mm2, equivalent to ~600 R*/rod/s).Green light at this intensity did not elicit significant cone-mediated responses in the Gnat1−/− mice.

