

Abstract
Germinal center (GC) B cell-like diffuse large B cell lymphoma (GCB-DLBCL) is a common malignancy yet the signaling pathways deregulated and the factors leading to its systemic dissemination are poorly defined1,2. Work in mice showed that sphingosine-1-phosphate receptor-2 (S1PR2), a Gα12 and Gα13 coupled receptor, promotes growth regulation and local confinement of GC B cells3,4. Recent GCB-DLBCL deep sequencing studies have revealed mutations in a large number of genes in this cancer, including in GNA13 (encoding Gα13) and S1PR25-7. Here we show using in vitro and in vivo assays that GCB-DLBCL associated mutations occurring in S1PR2 frequently disrupt the receptor's Akt and migration inhibitory functions. Gα13-deficient mouse GC B cells and human GCB-DLBCL cells were unable to suppress pAkt and migration in response to S1P, and Gα13-deficient mice developed GC B cell-derived lymphoma. GC B cells, unlike most lymphocytes, are tightly confined in lymphoid organs and do not recirculate. Remarkably, deficiency in Gα13, but not S1PR2, led to GC B cell dissemination into lymph and blood. GCB-DLBCL cell lines frequently carried mutations in the Gα13 effector ARHGEF1, and Arhgef1-deficiency also led to GC B cell dissemination. The incomplete phenocopy of Gα13- and S1PR2-deficiency led us to discover that P2RY8, an orphan receptor that is mutated in GCB-DLBCL and another GC B cell-derived malignancy, Burkitt lymphoma (BL), also represses GC B cell growth and promotes confinement via Gα13. These findings identify a Gα13-dependent pathway that exerts dual actions in suppressing growth and blocking dissemination of GC B cells that is frequently disrupted in GC B cell-derived lymphoma.
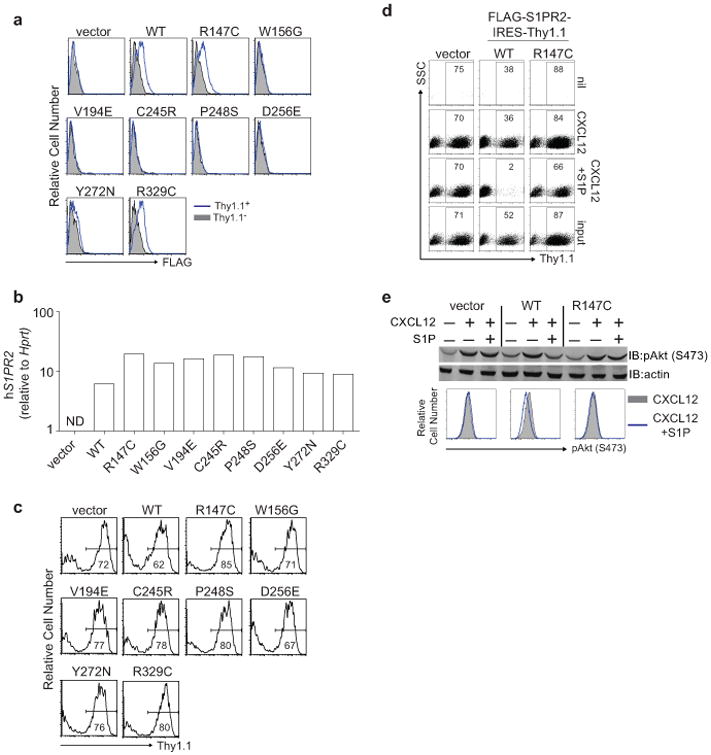
We sequenced the S1PR2 coding region in 117 GCB-DLBCL, 31 BL and 68 activated B cell-like (ABC)-DLBCL samples. Twelve S1PR2 coding mutations were identified in the GCB-DLBCL samples versus one in each of the BL and ABC-DLBCL cohorts (Supplementary Tables 1 and 2). The majority of GCB-DLBCL mutations were in conserved transmembrane (TM) residues (Fig. 1a) and all were predicted to be structurally damaging. Cell line transduction experiments showed that 5 of 8 tested mutations disrupted S1PR2 protein expression (Fig. 1b and Extended Data Fig. 1a-c).
Figure 1. Lymphoma-associated S1PR2 mutations are functionally disruptive and loss of Gα13 is sufficient to promote GC B cell survival and lymphomagenesis.
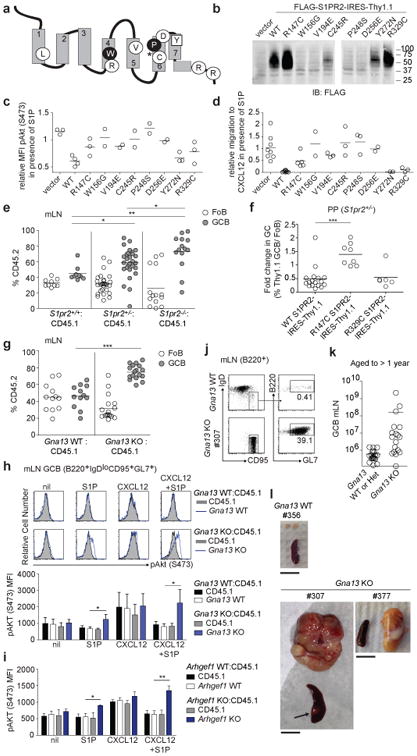
(a) Schematic of S1PR2 with mutated residues highlighted. Circles denote mutated residues conserved in S1PR2 across species, filled circles, conserved across Type A GPCRs, squares, residues not conserved across species, and asterisk, position of truncating frameshift mutation. (b) Western blot of FLAG expression in WEHI231 cells transduced with FLAG-tagged WT or mutant S1PR2 or empty vector. Shown is one experiment representative of 3 independent biologic replicates. The gap in the gel image marks the position of one lane that was not relevant to this experiment and was removed for clarity. (c) WEHI231 cells transduced as in b were stimulated with CXCL12 (100 ng/ml) in the presence or absence of S1P (1 nM) for 5 minutes and analyzed for phosphorylation of Akt (pAkt S473) by intracellular FACS. Shown is MFI of pAkt in samples treated with both CXCL12 and S1P relative to CXCL12 alone. Data are pooled from 4 independent experiments. (d) Transwell migration of cells transduced as in b, in response to CXCL12 (100 ng/ml) in the presence or absence of S1P (1 nM). Shown is the relative migration of transduced cells to CXCL12 in the presence versus absence of S1P. Data are pooled from 8 independent experiments. (e) Percentages of CD45.2 follicular B cells (Fo) and GC B cells from mLNs of mixed BM chimeras generated with ∼70% WT CD45.1 cells and ∼30% S1pr2 WT (n=9), heterozygous (n=28) or knockout (n=19) CD45.2 BM, assessed by FACS. Gating scheme is shown in Extended Data Fig 3a. Data are pooled from 4 independent experiments. (f) Fold change in frequency of Thy1.1 reporter+ cells in GC relative to Fo B cells of PPs from chimeras reconstituted with S1pr2+/- BM transduced with retrovirus expressing either WT (n=17) or mutant S1PR2 (R147C, n=8; R329C, n=6). Gating scheme is shown in Extended Data Fig. 3c. Data are pooled from 3 independent experiments. (g) Percentages of CD45.2+ Fo and GC B cells from mLNs of mixed BM chimeras generated with ∼40% Gna13 WT (f/+) (n=12) or KO (f/f mb1-cre) (n=17) CD45.2 cells and ∼60% WT CD45.1 cells. Data are pooled from 4 independent experiments. (h, i) Intracellular FACS for pAkt in GC B cells from mLN of Gna13 (h) or Arhgef1 (i) mixed BM chimeras that were stimulated ex vivo with or without CXCL12 (300 ng/ml) in the presence or absence of S1P (10 nM) for 10 minutes. Data in graphs are mean +/- SEM and are from one experiment with 3 biologic replicates for each treatment and are representative of 4 experiments (Gna13) or 3 experiments (Arhgef1) (j) FACS analysis of mLN of 1 year-old Gna13 WT or Gna13 KO (#307). Percent of total cells that are GC B cells is indicated. (k) GC B cell number from mLN of Gna13 WT and heterozygous (n=20) or KO (n=18) animals aged to 12 to 16 months. (l) Gross appearance of mLN and spleen from Gna13 WT control and 2 Gna13 KO animals. Arrow in #307 denotes splenic nodule (see also Extended Data Fig. 4c-e). Scale bar is 1 cm. *P<0.05, **P<0.01, ***P<0.001, unpaired two-tailed Student's t test.
These same mutations disrupted S1P-mediated inhibition of CXCL12-induced pAkt and migration (Fig. 1c, d). One additional mutant, R147C, which was expressed at levels similar to wild-type (WT) (Fig. 1b and Extended Data Fig. 1), showed a strongly reduced ability to support S1P-mediated inhibition of pAkt and migration (Fig. 1c, d and Extended Data Fig. 1d, e). These observations suggested that tumors harboring single mutant S1PR2 alleles (Extended Data Fig. 2) are often likely to be functionally heterozygous for S1PR2. Using a mixed BM chimera system in mice3, S1pr2 heterozygous B cells showed marked expansion in the GC relative to the follicular compartment in mesenteric lymph nodes (mLNs) and Peyer's patches (PPs) of unimmunized mice (Fig. 1e and Extended Data Fig. 3a, b). Over-expression of WT S1PR2 repressed the outgrowth of S1pr2+/- GC B cells and this was also seen for mutant R329C, whereas the R147C mutation caused the receptor to lose GC growth suppressive activity (Fig. 1 f and Extended Data Fig. 3c, d). Based on molecular simulation analysis (Supplementary Text and Extended Data Fig. 3e-g) we propose that the R147C S1PR2 mutant cannot attain the active conformation necessary for G-protein recruitment and signaling.
Gα12 and Gα13 often function redundantly in transmitting GPCR signals8. Transcripts for both G-proteins are upregulated in GC B cells, with Gna13 transcripts appearing more abundant (Extended Data Fig. 4a). In accord with recent whole exome sequencing studies that reported mutations in GNA13 but not GNA125,6,9-11, we found frequent GNA13 coding mutations in GCB-DLBCL and BL biopsy samples, with a number of biallelic cases (Supplementary Table 2 and Extended Data Fig. 2). Mixed BM chimera analysis revealed that Gα13-deficiency was sufficient to confer a GC B cell growth advantage in mLNs and to a lesser extent in PPs (Fig. 1g and Extended Data Fig. 4b). Gα13-deficient mLN GC B cells showed increased pAkt relative to WT when incubated ex vivo with CXCL12 and S1P (Fig. 1h). Deficiency in the Gα13 effector, Arhgef1 (p115 RhoGEF or Lsc), led to a similar defect in the ability of S1P to repress chemokine induced pAkt (Fig. 1i).
To determine whether loss of Gα13 in B cells could promote lymphomagenesis, we allowed a cohort of Gna13-deficient mice to age. At one year, 10 of 18 Gna13-deficient mice showed a greater than 10-fold expansion of GC B cells compared to littermate controls (Fig. 1j, k) and at least five of the outgrowths appeared clonal (Extended Data Fig. 4c). Three of the Gna13-deficient animals showed massive mesenteric lymphadenopathy (Fig. 1l and not shown), with evidence in one case (#307) of spleen and PP involvement (Fig. 1l and Extended Data Fig. 4c-e). Immunophenotyping of the Gα13-deficient tumors confirmed they were of GC origin (Extended Data Fig. 4f).
To test the conservation of the Gα13-signaling pathway in human GC B cells, we performed gene rescue experiments in GCB-DLBCL cell lines. Sequencing of S1PR2, GNA13 and ARHGEF1 in a panel of GCB-DLBCL cell lines identified several with deleterious mutations in these genes (Supplementary Table 3 and Extended Data Fig. 5a). The mutations in GNA13 matched those previously described and were associated with reduced protein levels6. ARHGEF1 mutations have not previously been reported, likely because the large size (∼24 kb) of this 27 exon gene and its multiple splice variants and low transcript abundance make sequence analysis difficult. Remarkably, 10 of 20 cell lines with analyzable ARHGEF1 sequence showed mutations in this gene, several of which resulted in premature stop codons (Supplementary Table 3 and Extended Data Fig. 5a). Using retroviral transduction to restore gene expression, we established that loss of S1PR2, Gα13 and ARHGEF1 were each sufficient to disrupt S1P-mediated suppression of pAKT and, in the case of cell lines that were migratory, to disrupt S1P-mediated inhibition of migration (See Supplementary Text and Extended Data Fig. 5).
The mechanisms by which malignant GC B cells can exit the GC niche and lymphoid organ to spread amongst multiple LNs or to systemic sites such as BM have not been defined. Consistent with a lack of migration inhibition by S1P (Fig. 2a), mice lacking Gα13 in B cells showed marked disruption of GC architecture in mLNs (Fig. 2b and Extended Data Fig. 6a). In a mixed transfer system, Gα13-deficient GC B cells were excluded from the interior of otherwise wild-type GCs (Extended Data Fig. 6b). Remarkably, Gα13-deficient GC B cells were readily detected in lymph and to a lesser extent in blood while WT GC B cells were absent from circulation (Fig. 2c). In mixed BM chimeras, Gα13-deficient GC B cells were again detectable in the lymph, indicating that Gα13 was needed intrinsically in GC B cells to inhibit egress (Fig. 2d). Analysis of Arhgef1-deficient mice and chimeras revealed a similar disruption of mLN GC architecture (Fig. 2b and Extended Data Fig. 6c) and GC B cell appearance in lymph and blood (Fig. 2e, f). In contrast, S1PR2-deficient GC B cells were not significantly higher in lymph relative to littermate controls (Fig. 2g). Analysis of mice expressing constitutively active myr-Akt or over-expressing BCL2 in B cells established that increased GC B cell survival was not sufficient to lead to dissemination (Supplementary Text and Extended Data Fig. 7).
Figure 2. Loss of confinement and systemic dissemination of GC B cells in the absence of Gα13 or Arhgef1.
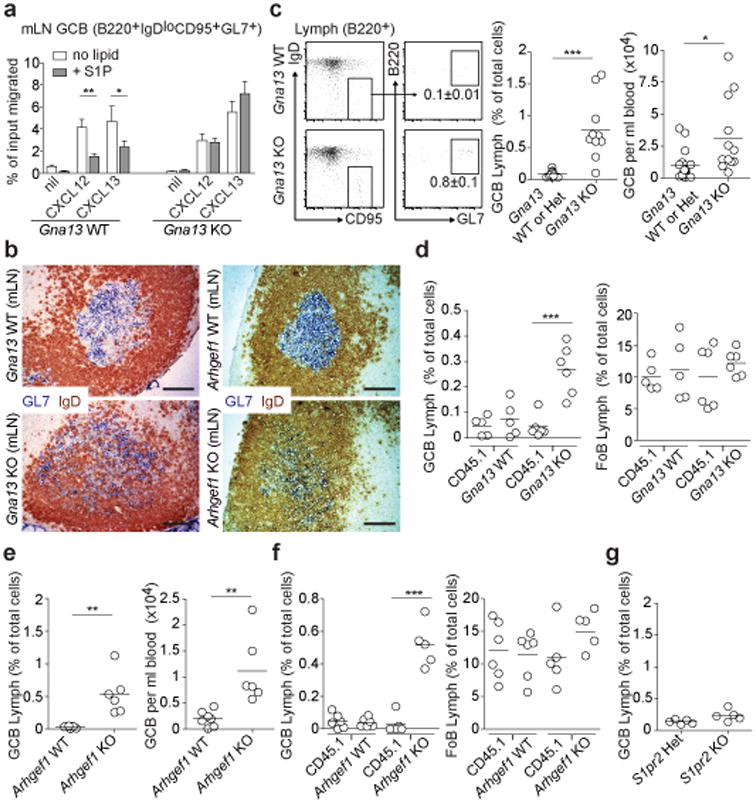
(a) Transwell migration of mLN GC B cells from Gna13 WT (f/+) or Gna13 KO (f/f mb1-cre) mice to CXCL12 (300 ng/ml) or CXCL13 (1 μg/ml) in the presence or absence of S1P (10 nM). Data are shown as mean +/-SEM and are pooled from 5 independent experiments with 2 technical replicates in each experiment. (b) Immunohistochemical analysis of mLNs from Gna13 or Arhgef1 WT or KO mice stained to detect GC B cells (GL7, blue) and naïve follicular B cells (IgD, brown). Scale bar is 100 μm. Data are representative of at least 4 mLNs of each type. (c-g) Lymph and/or blood from Gna13 WT (n=13 for lymph; n=17 for blood) or KO (n=10 for lymph; n=12 for blood) animals (c), Gna13 mixed chimeras (WT, n=5; KO, n=6) (d), Arhgef1 WT (n=7) or KO (n=6) animals (e), Arhgef1 mixed chimeras (WT, n=6; KO, n=5) (f) or S1pr2 heterozygous (n=5) or KO (n=5) animals (g) was analyzed for the presence of GC B cells by FACS. Representative FACS plot for GC B cells in lymph is shown in c with percent of total cells that are GC B cells indicated. Data are shown as GC B cell frequency amongst total cells in lymph and as cells per ml in blood. Data in c-g are pooled from between 3 and 13 independent experiments. *P<0.05, **P<0.01, ***P<0.001, unpaired two-tailed Student's t test.
GNA13 mutations and BCL2 rearrangements and potentially activating mutations frequently occur together in GCB-DLBCL6,12. GC B cells in mice with combined Gα13-deficiency and BCL2 overexpression showed enhanced ex vivo survival (Fig. 3a), increased numbers (Fig. 3b), wider dispersal throughout the follicle and interfollicular regions in mLNs (Extended Data Fig. 7f) and 2-fold increased frequencies in lymph and blood (compare Fig. 3c and 2c), compared to cells in Gα13-deficient mice
Figure 3. Gα13 deficiency promotes hematogenous spread and lymphatic seeding of GC B cells in distant organs.

(a) Intracellular FACS for active caspase-3 in GC B cells from non-BCL2-tg or BCL2-tg Gna13 WT or KO mLN cells incubated at 37°C for 3 hours. (b) GC B cell numbers in mLNs from Gna13 KO or control (Gna13 WT or Het) mice with or without the BCL2-tg, determined by FACS. n=17, 11, 12 and 8, respectively. (c) GC B cells in lymph and blood of BCL2-tg (lymph, n=9; blood, n=13) or BCL2-tg Gna13 KO (lymph, n=9; blood, n=9) mice. (d-f) mLN cells from non-BCL2-tg or BCL2-tg Gna13 WT or KO CD45.2 mice were transferred intravenously (d and e, n=8, 6, 7 and 7 for spleen and n=5, 3, 7, 7 for BM, respectively) or intraperitoneally (f, n=4, 4, 3 and 4, respectively) into CD45.1 recipients. Spleen and BM (d and e) or parathymic LNs (f) of recipients were harvested after 6 hours and analyzed for the presence of donor GC B cells. Percent of donor B cells that were GC B cells are shown in d. Ratios of percent donor GC B cells recovered from spleen and BM (e) or parathymic LNs (f) divided by percent GC B cells in input is shown. (g-i) Bone marrow of Gna13 WT and heterozygous (n=16) or KO (n=14) aged to between 12 and 16 months (g, h) or BCL2-tg Gna13 WT (n=6) or KO (n=5) aged to 10 months (i) was analyzed for GC B cells by FACS. Data a-c, e, f, h and i are pooled from between 3 and 13 independent experiments. *P<0.05, **P<0.01, ***P<0.001, unpaired two-tailed Student's t test.
To examine requirements for GC B cell persistence after arriving at a distant site we bypassed the egress step and intravenously transferred mLN cells to congenically distinct recipients. Transferred WT GC B cells were essentially undetectable in recipient spleen and BM after six hours (Fig. 3d, e) and Gα13-deficiency alone was insufficient to cause a significant increase in their number (Fig. 3e). Bcl2-overexpression alone caused an elevation in GC B cell frequency in recipient spleens but not BM (Fig. 3e). Loss of Gα13 combined with Bcl2-overexpression led to greater accumulation of transferred GC B cells in spleen and now led to an increase in their frequency in BM (Fig. 3e). This combinatorial effect likely reflects an ability of Gα13-deficiency and BCL2-overexpression to cooperate in promoting survival of GC B cells outside the GC niche (Fig. 3a). To determine whether GC B cells could seed distant LNs after entry into lymphatics, we transferred mLN cells intraperitoneally. Small numbers of Gα13-deficient, but not WT, GC B cells were detectable in the draining parathymic LNs after six hours (Fig. 3f). In this case, recovery of Gα13-deficient GC B cells was not enhanced by the BCL2 transgene. BM involvement occurs in a fraction of GCB-DLBCL patients and is a predictor of worse disease13. In some year old Gα13-deficient mice showing mLN tumors, GC B cells could be detected in the BM (Fig. 3g, h). Moreover, in aged BCL2-tg Gna13 KO but not BCL2-tg Gna13 WT mice, GC B cells were frequently found in the BM (Fig. 3i).
The more frequent mutations of GNA13 than of S1PR2 in both GCB-DLBCL and BL despite the similar size of their open reading frames, together with our finding of Gna13-deficient but not S1pr2-deficient mouse GC B cells in circulation (Fig. 2c and g) led us to hypothesize that additional Gα13 coupled GPCRs may be involved in GC B cell regulation. In this regard, P2YR8, a gene situated in the pseudoautosomal region of the X chromosome, was a target of mutations in published whole exome sequencing data of GCB-DLBCL and BL5,7,14 and was frequently mutated in our GCB-DLBCL and BL samples, with several of each lymphoma type carrying biallelic mutations (Fig. 4a, Supplementary Table 2 and Extended Data Fig. 2). P2RY8 is an orphan receptor and has orthologs in many vertebrates, but unexpectedly it lacks an ortholog in mouse (Fig. 4b). Like S1PR2, P2RY8 was abundant in human GC B cells (Fig. 4c). Five out of six tested mutations prevented surface P2RY8 expression (Extended Data Fig. 8a, b).
Figure 4. P2RY8, mutated in GCB-DLBCL and BL, suppresses GC B cell growth and promotes B cell confinement via Gα 13.
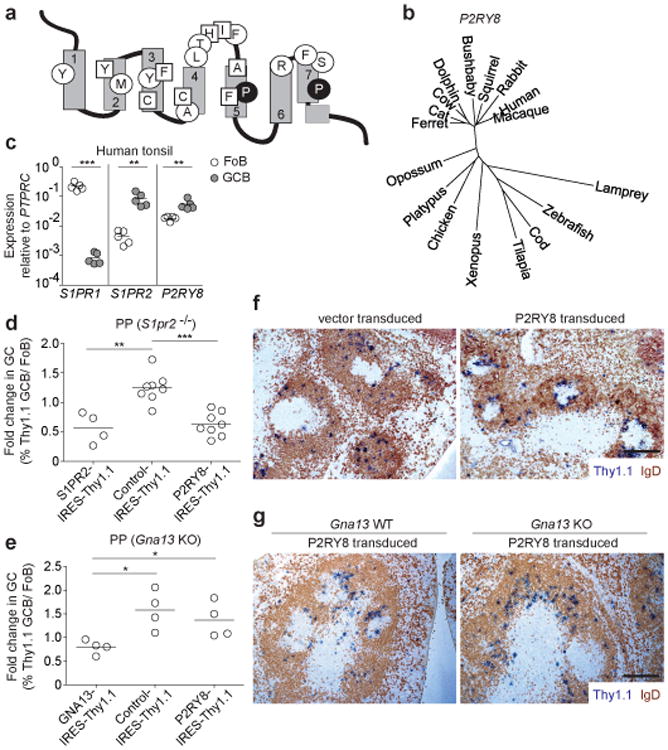
(a) Schematic of P2RY8 with locations of mutated residues in GCB-DLBCL and BL. Residues are marked as for S1PR2 in Figure 1a. (b) Phylogenetic tree of P2RY8 across species. (c) Quantitative PCR of S1PR1, S1PR2 and P2RY8 in FACS-sorted human tonsillar Fo and GC B cells. Data in c are from 5 donors. (d, e) Fold change in frequency of Thy1.1 reporter+ cells in GC relative to Fo B cells of PPs from BM chimeras reconstituted with S1pr2 KO BM (d) or Gna13 KO (f/f mb1-cre) BM (e) transduced with retrovirus expressing P2RY8, or with S1PR2, GNA13 or R147C mutant S1PR2 (control). Data in d are pooled from 2 independent experiments (S1PR2, n=4; Control, n=8; P2RY8, n=8). Data in e are from one experiment (n=4 in each group). (f, g) Immunohistochemical analysis of splenic sections from SRBC-immunized mice given Ig-transgenic (f) or Gna13 WT or KO (g) B cells transduced with retroviral vector encoding Thy1.1 alone (vector) or P2RY8 and Thy1.1, assessed 24 h after cell transfer. Scale bar is 200 μm in f and g. Data in f are representative of 3 and in g of 2 independent experiments. *P<0.05, **P<0.01, ***P<0.001, unpaired two-tailed Student's t test.
Despite the lack of a mouse P2RY8 ortholog, we considered the possibility that if the ligand were a small molecule it may be conserved and we therefore asked whether P2RY8 overexpression influenced GC B cell growth. Remarkably, human P2RY8 led to a suppressive effect on GC B cell growth in mouse PPs and mLNs, similar to the effect of S1PR2 overexpression (Fig. 4d and Extended Data Fig. 8c). This suppression required P2RY8 coupling to Gα13 as it was not seen if the cells lacked Gna13 (Fig. 4e and Extended Data Fig. 8d). In short-term transfers, P2RY8-transduced B cells localized in the center of the follicle immediately around and often within GCs while vector transduced cells were dispersed throughout the follicle (Fig. 4f, Extended Data Fig. 8e, f and Supplementary Text). In the absence of Gα13, P2RY8 was unable to direct B cells to the follicle center (Fig. 4g and Extended Data Fig. 8g). Importantly, a control Gα13 coupled GPCR, Tbxa2r, could not suppress GC B cell growth or confine cells to the GC niche (Extended Data Fig. 9 and Supplementary Text). These observations lead us to suggest that P2RY8 in humans acts to suppress GC B cell growth and promote B cell positioning in a GC location via Gα13-dependent pathways.
GC B cells are normally tightly regulated in their growth and strictly confined to the GC, and they lack the ability to exit into circulation or to survive outside the GC niche. Each of these processes breaks down in the GC B cell-derived malignancies, GCB-DLBCL and BL. We provide evidence that disruption of Gα13 signaling, via mutations in GNA13, ARHGEF1, S1PR2 or P2RY8, contributes to this breakdown. GNA13 is mutated in 15-33% of GCB-DLBCL and ∼15% of BL6,7,9-11 (Supplementary Table 2 and Extended Data Fig. 2). This is similar to the frequency of mutations in the histone methyltransferases EZH2 and MLL2, deletions of PTEN and amplifications of miR17-92, genetic alterations that have been highlighted for their role in oncogenesis in GCB-DLBCL15-21. Our data support a model (Extended Data Fig. 10 and Supplemental text) where deleterious mutations in Gα13 and its effector, ARHGEF1, are sufficient to deregulate AKT signaling and to cause loss of confinement, allowing egress of GC B cells into circulation; survival of the disseminating cells at distant sites such as BM depends on cooperating mutations affecting additional genes, such as BCL212,22. S1PR2 and P2RY8 mutations are also suggested to deregulate AKT signaling and growth but may lead to less dissemination due to overlapping roles in promoting confinement. Potentially inactivating mutations of RHOA, a direct target of ARHGEF123, have been reported in BL24. The mechanism by which RHOA inhibits AKT activation is not yet defined but might involve activation of PTEN or inhibition of RAC25-27. We suggest that small molecules that inhibit AKT may replace the missing repressive effects of RHO on growth or survival in cells that harbor defects in the S1PR2/P2RY8-GNA13-ARHGEF1-RHO pathway. Development of active RHO-mimetics may represent a novel therapeutic approach that addresses both lymphoma cell survival and disease dissemination.
Methods
Human samples and Sequencing
All clinical samples were studied with informed consent according to an IRB protocol approved by the National Cancer Institute. Genomic DNA for the single exon coding region of S1PR2 and cDNA for GNA13 or ARHGEF1 was PCR amplified. PCR products were bidirectionally sequenced using an ABI 3730 Genetic Analyzer (Applied Biosystems). Sequence electropherograms were manually reviewed. ARHGEF1 encodes multiple splice variants with up to 28 coding exons per splice variant. We were unable to sequence the open reading frame of ARHGEF1 from cDNA in some cell lines in our panel likely due to splice variation or insufficient transcript. In some cell lines, regions containing coding exons for ARHGEF1 were amplified from genomic DNA. Primers used for amplification and sequencing are shown in Supplementary Table 4. The following NCBI (RefSeq) accession numbers: ARHGEF1: NM_004706 and NP_004697, GNA13: NM_006572 and NP_006563, S1PR2: NM_004230 and NP_004221 were used to report mutations.
Mice and BM chimeras
Adult C57BL6 Ly5.2 (CD45.1+) mice at least 7 weeks of age were from the National Cancer Institute. S1pr2−/− mice28 were backcrossed for at least six generations to C57BL6/J (B6/J). Arhgef1−/− mice29 were backcrossed to B6/J for at least 6 generations. Gna13 f/f mice were on a mixed background30. Mb1-cre mice (provided by M. Reth) express Cre in all B-lineage cells31. BCL2-tg mice were of the EμBcl2-22 line32 that overexpresses BCL2 selectively in B cells. MD4 Ig-tg mice were from an internal colony. Mice lacking Gna13 in B cells and littermate controls were generated by crossing mb1-cre + Gna13 f/+ mice to Gna13 f/f. In most experiments, bred mice of both sexes were used and were between 7 and 12 weeks of age except in the aging cohort of Gna13 animals as indicated. BM chimeras were made using Ly5.2 (CD45.1+) from NCI as hosts as previously described33 and analyzed at least 8 weeks after reconstitution. For one experiment using S1pr2 heterozygous and WT littermate donors, mice were also heterozygous for beta-2-microglobulin. CD21-cre (Cr2-cre) mice that express Cre in mature B cells were from Jackson Laboratories. The mouse genotype was not blinded from the investigator and mice were not randomized. Mice were housed in a specific pathogen–free environment in the Laboratory Animal Research Center at the University of California, San Francisco, and all animal procedures were approved by the Institutional Animal Care and Use Committee.
Retroviral constructs and transductions
S1PR2, P2RY8, GNA13, ARHGEF1 retroviral constructs were made by inserting the human open reading frame into the MSCV2.2 retroviral vector followed by an internal ribosome entry site (IRES) and Thy1.1 or GFP as an expression marker. The mouse Tbxa2r open reading frame was inserted into the Thy1.1 MSCV2.2 retroviral vector. S1PR2, P2RY8 and Tbxa2r were inserted in frame with a preprolactin leader and FLAG-epitope encoding sequence. Lymphoma-associated mutations were introduced into S1PR2 or P2RY8 by quick-change PCR. WEHI231 or human lymphoma cell lines engineered to express an ecotropic retroviral receptor34 were spin-infected with retrovirus containing vector, WT or mutant S1PR2, P2RY8, Tbxa2r, GNA13 or ARHGEF1. For transduction of BM, S1pr2 heterozygous or deficient, CD21-cre or Gna13 f/f mb1-cre donor mice were injected IV with 3 mg 5-fluorouracil (Sigma). BM was collected after 4 d and was cultured in DMEM containing 15% (vol/vol) FBS, antibiotics (penicillin(50 IU/ml) and streptomycin (50 μg/ml); Cellgro) and 10 mM HEPES, pH 7.2 (Cellgro), supplemented with IL-3, IL-6 and stem cell factor (at concentrations of 20, 50 or 100 ng/ml, respectively; Peprotech). Cells were ‘spin-infected’ twice at days 1 and 2 and were transferred into irradiated recipients on day 3. BM chimeras in which constitutively active myristoylated Akt (myr-Akt) is selectively expressed in B cells were generated by transducing CD21-cre BM with retrovirus in which myr-Akt is downstream of a loxP-stop-loxP cassette3. To generate activated B cells that can be efficiently retrovirally transduced, MD4 Ig-transgenic mice (MGI 2384500) containing lysozyme-specific B cells were injected with 5 mg hen egg lysozyme (HEL), splenocytes were harvested 4 hours later and the B cells further activated by culturing with 20 μg/ml anti-CD40 (FGK4.5; BioXcell) for 24 hours as in past studies35. Alternatively, Gpr183+/- or Gna13 WT or KO spleen cells were harvested in media containing 1 μg/ml LPS or 0.25 μg/ml anti-CD180 (RP-105; clone RP14, BD Biosciences) and cultured for 24 hours. Later experiments were performed using anti-CD180 activation as we found it much more effective in achieving high levels of transduction than LPS. The activated B cells were spin-infected for 2 hours with retroviral supernatant, and cultured overnight before transfer into SRBC-immunized wild-type mice. Transferred cells were analyzed after 24 hours by flow cytometry and immunohistochemistry.
Cell isolation, clonality assessment, adoptive transfer, cell culture, treatments, flow cytometry and qPCR
B cells from spleen, mesenteric lymph nodes (mLNs), Peyer's patches (PPs) and blood were isolated and stained as previously described3. Lymph was collected from the cysterna chyli via fine glass micropipette as previously described36. Assessment of clonality by PCR of J558 heavy chain, and κ and λ light chains from genomic DNA from bulk mLN cells from year old mice was performed as previously described37. For adoptive transfer experiments, mLN were harvested, washed once and transferred IV or IP into CD45.1 recipient mice. Spleen and BM were harvested 6 h after IV transfer, parathymic LNs were harvested 6 h after IP transfer. Harvested organs were analyzed by FACS for the presence of donor GC B cells. For GC B cell positioning experiments in a mixed setting, Gna13 WT or KO CD45.2+ B cells were transferred with WT CD45.1+ B cells into MD4 Ig-tg CD45.1+ recipients. Recipients were then immunized with SRBCs and analyzed after 8 days. For pAkt analysis of mLN GC B cells, mLN were harvested in RPM-I1640 medium containing 0.5% (wt/vol) fatty acid-free BSA (migration media; EMD Biosciences). Cells were RBC lysed twice and resuspended in migration media. Cells were incubated for 10 minutes at 37°C and then stimulated for 10 min with CXCL12 (300 ng/ml) or S1P (10 nM). Cells were fixed at a final concentration of 1.5% PFA for 10 min at room temperature and then permeabilized in ice-cold methanol. Cells were washed twice in staining buffer, blocked with Fc-block (2.4G2; Bio×cell) and 5% normal goat serum for 20 minutes at room temp, stained for 45 min at room temp for Akt phosphorylated at Ser473 (D9E, #4060; Cell Signaling Technology) followed by goat antibody to rabbit IgG conjugated to allophycocyanin (sc-3846; Santa Cruz Biotechnology) as well as antibodies to GC markers. For pAkt analysis by flow cytometry in transduced WEHI231 or human GCB-DLBCL lines, cells were stimulated for five minutes with or without CXCL12 (100 ng/ml) with or without S1P (1 nM for WEHI-231 or 10 nM for human GCB-DLBCL lines) and fixed and stained as above for pAkt as well as anti-Thy1.1 conjugated to phycoerythrin (clone ox-7; Biolegend). Human cell lines used in this manuscript were tested for mycoplasma contamination. Mycoplasma positive lines were treated with MycoZap (Lonza) and Plasmocin (InvivoGen). All human cell lines were tested for a unique profile of polymorphic DNA copy number variants (CNV fingerprint; unpublished protocol from L. Bergsagel). In some experiments, cells were treated with the PI3K inhibitors wortmannin (Sigma) or GS-1101 (Selleck Chemicals) as negative pAkt staining controls. For active caspase-3 staining, total mLN cells were harvested, washed once and incubated in RPMI-I1640 containing 10% FCS for 3h at 37, cells were stained for surface markers, fixed and permeabilized with BD Cytofix/Cytoperm and stained with anti-active Caspase-3 conjugated to biotin (clone: C92-605; BD Biosciences) according to manufacturer's instructions. Chemotaxis assays of GC B cells were performed using total mLN cells that were RBC lysed twice or transduced WEHI231 or human GCB-DLBCL lines as described3. U-46619 was from Cayman Chemicals. Flow cytometry was performed on a FACSCalibur or LSRii (BD Biosciences). For qPCR analysis of gene expression in GC B cells, Ptprc (encoding CD45) was used as a control since its expression was unchanged between Fo and GC B cells by microarray (Immgen.org and unpublished data), RNAseq analysis (unpublished) and by surface staining. In contrast, Gapdh and Hprt were both upregulated in GC B cells (Immgen.org and unpublished data).
Western Blotting
WEHI231 cells transduced with vector, WT or mutant human S1PR2 were washed twice in migration media and incubated at 37°C for 30 minutes, washed once in cold PBS and lysed in 0.5% Brij 35, 0.5% NP40, 150mM NaCl, 10mM Tris-HCl, pH 7.4 with protease inhibitor cocktail (Roche) for 1 hour on ice. Lysate were centrifuged and supernatant were mixed with loading buffer and reducing agent and incubated at room temp for 30 min. Samples were resolved by SDS-PAGE and FLAG expression was detected with rabbit polyclonal anti-FLAG (Sigma). For pAkt western blot experiments Ly7, Ly8 or WEHI cells that were sorted based on Thy1.1 expression and expanded were stimulated as above and lysed in 2× sample buffer and resolved by SDS-PAGE and probed with rabbit anti-pAkt S473 (D9E, #4060; Cell Signaling Technology).
Immunohistochemical analysis
Cryosections 7 μm in thickness from mLN and spleen were cut and prepared as described3. Tumor immunopheotyping was performed using goat polyclonal IRF4 antibody (Santa Cruz, sc-6059) or biotinylated anti-mouse CD138 (clone 281-2; BD Biosciences). For Bcl-6 staining, cryosections were fixed with 4% PFA for 10 minutes and stained with rabbit polyclonal Bcl6 antibody (Santa Cruz, sc-368). Images were captured with a Zeiss AxioOberver Z1 inverted microscope.
Statistical analysis
Prism software (GraphPad) was used for all statistical analysis. Data were analyzed with a two-sample unpaired (or paired, where indicated) Student's t-test. P values were considered significant when ≤ 0.05.
Extended Data
Extended Data Figure 1. Lymphoma-associated mutations result in loss of expression and function of S1PR2.
(a-c) Surface expression of FLAG (a), quantitative PCR of human S1PR2 (b) or Thy1.1 reporter expression (c) in mouse WEHI231 B lymphoma cells transduced as described in Fig. 1b. Shown in a are histograms of transduced cells (Thy1.1+) in blue and untransduced cells (Thy1.1−) in gray. 5 of 8 S1PR2 mutations showed loss of protein expression despite strong transcript and reporter expression. Loss of expression in these 5 mutants was likely a result of degradation of improperly folded proteins in the ER. (d) Representative FACS plots of transwell migration of WEHI231 cells transduced with vector, WT or R147C mutant S1PR2 to the indicated stimuli or the input sample. Numbers indicate % of cells positive for the Thy1.1 reporter. (e) WEHI231 cells stimulated as in Fig. 1d were analyzed for phosphorylation of Akt (pAkt S473) by Western blot or by intracellular FACS. Data in a and c are representative of 4 independent experiments and d and e of 3 independent experiments.
Extended Data Figure 2. Frequency of mutations in GNA13, S1PR2 and P2RY8 in aggressive lymphoma.

(a-b) Summary of overall mutation frequencies (a) and allelic frequencies (b) of non-synonymous coding mutations in S1PR2, GNA13 and P2RY8 in GCB-DLBCL, BL or ABC-DLBCL cases shown in Supplementary Table 2. Unmutated indicates no coding region mutations in the genes shown. Since the sequencing was performed on genomic DNA the data may underestimate the frequency of biallelic cases as some disruptive mutations may occur in non-coding regulatory elements.
Extended Data Figure 3. S1PR2 heterozygosity confers a survival advantage to GC B cells and R147C S1PR2 fails to function.
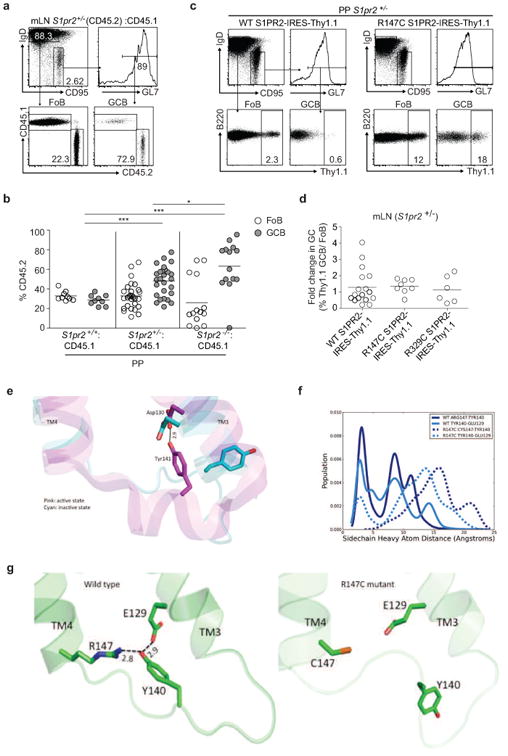
(a, b) Flow cytometry of Fo and GC B cells from mLN and PP of mixed BM chimeras generated as in Fig. 1e. Gating strategy for FoB and GCB in mLN is shown in a and percentages of CD45.2+ cells in Fo and GC B cells from PP are shown in b. Data in b are pooled from 4 independent experiments. (c) Gating strategy of Thy1.1 reporter expression in Fo and GC B cells from PP (c) or fold change in Thy1.1+ cells in GC relative to Fo B cells of mLN (d) of retrovirally transduced BM chimeras as described in Fig. 1f. Data in d are pooled from 3 independent experiments. *P<0.05, ***P<0.001, unpaired two-tailed Student's t test. There was increased variability in mLN relative to PP when WT S1PR2 was transduced into S1PR2+/- BM. Nine of 17 animals reconstituted with S1PR2+/- BM transduced with WT S1PR2 showed a reduction in expression of Thy1.1 in mLN GC relative to follicular B cells, whereas in 6 of 8 animals reconstituted with R147C S1PR2 there was increased reporter expression. (e) The hydrogen bond formed between Y141 in ICL2 and D130 on TM3 has been observed only in the active state of β2-adrenergic receptor (shown in pink) and not in the inactive state (shown in cyan). (f) Population distribution of the conformational states showing the predicted hydrogen bond network between R147 (TM4), Y140 (ICL2) and E129 (TM3) of the wild type (solid lines) and R147C mutant (dashed lines) of S1PR2. (g) The network of predicted hydrogen bonds mediated by Y140 on ICL2. The hydrogen bond network tightens the interactions between transmembrane helices TM3 and TM4. We hypothesize that this network stabilizes the putative active state conformation of S1PR2. Such a network is broken in the R147C mutant and hence this mutant does not activate the G-protein.
Extended Data Figure 4. Aged Gα13-deficient mice develop GC-derived lymphoma.
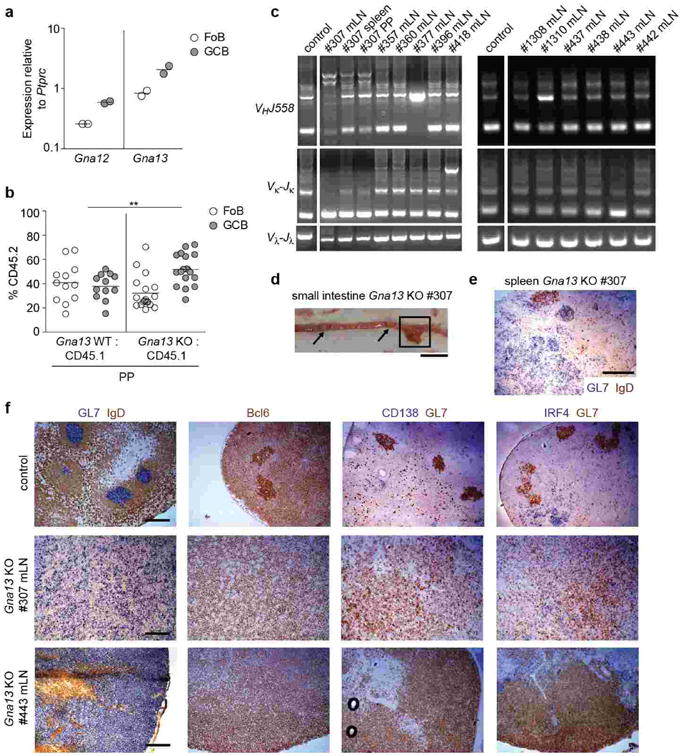
(a) Quantitative PCR analysis of Gna12 and Gna13 transcript abundance in Fo and GC B cells relative to the control gene Ptprc. (b) Flow cytometry of follicular (Fo) and GC B cells from PPs of mixed BM chimeras as described in Fig. 1g. (c) PCR analysis of VHJ558-DJH, Vκ-Jκ and Vλ-Jλ rearrangements from indicated tissues of Gna13 KO animals. The space in the gel image marks the position of lanes that were not relevant to this experiment and were removed for clarity. This PCR analysis was done using bulk rather than sorted GC B cells from tumors and thus likely under-reports the number of animals with clonal outgrowths. Samples scored as having clonal outgrowths (and thus likely harboring tumors) were #307, 377, 418, 1310, 443. In the case of #307, the splenic nodule and enlarged PP showed enrichment of the same VHJ558 clonal bands observed in the mLN. (d) Gross appearance of small intestine of Gna13 KO #307 mouse. Box denotes enlarged PP analyzed by PCR in c, arrows denote two uninvolved PPs. Scale bar is 1 cm. (e) Immunohistochemical analysis of splenic nodule from #307 (see Fig. 1l) for GC marker GL7 (blue) and naïve B cell marker IgD (brown). Scale bar is 500 μm. (f) Control or enlarged Gna13 KO mLNs were stained for the GC B cell markers GL7 and Bcl6, the plasma cell markers CD138 and IRF4, and the follicular B cell marker IgD. Scale bar is 200 μm in all samples in f.
Extended Data Figure 5. Defective regulation of pAkt and cell migration in human GCB DLBCL cell lines harboring mutations in the S1PR2 signaling pathway.

(a) Frequency of non-synonymous coding mutations in S1PR2, GNA13 and ARHGEF1 in GCB-DLBCL lines, and fraction that were mono- or bi-allelic, summarized from Supplementary Table 3. Unmutated indicates no coding region mutations in the genes shown. (b, c) Intracellular FACS (b) or Western blot (c) for pAkt in human GCB DLBCL cell lines that are WT or mutant for S1PR2, GNA13 or ARHGEF1 as indicated and that were stimulated with CXCL12 (100 ng/ml) in the presence or absence of S1P (10 nM) for 5 minutes. pAkt staining of cells treated with wortmannin (200 nM) for 5 minutes are shown in gray as a staining control for each cell line. (d) Transwell migration of GNA13 WT (Ly7, Ly8, NUDUL1) or mutant (DOHH2) cell lines to CXCL12 (100 ng/ml) in the presence or absence of S1P (10 nM). (e, f) Intracellular FACS for pAkt of the GNA13 mutant cell lines Karpas422 (d) or DOHH (e) transduced with retrovirus expressing the reporter alone (vector) or GNA13 in the presence or absence of S1P (10 nM) or wortmannin (200 nM; staining control). (g) Intracellular FACS for pAkt in the ARHGEF1 mutant cell line Ly19 transduced with retrovirus expressing reporter alone (vector) or ARHGEF1 that were treated as in b or with the PI3K inhibitor GS-1101 (2 uM; staining control). (h) Quantitative PCR analysis of S1PR2 transcript abundance in human GCB-DLBCL cell lines relative to GAPDH. (i) Intracellular FACS for pAkt in NUDUL1 cells transduced with retrovirus expressing reporter alone (vector), S1PR2, GNA13 or ARHGEF1, treated as in d. Data in b and d are representative of at least 3 independent experiments. Pooled data from at least 3 independent experiments is shown in b, e, f, g and i. Data in b is one experiment representative of 2. **P<0.01, paired two-tailed Student's t test.
Extended Data Figure 6. Loss of GC B cell confinement in the absence of Gα13 or Arhgef1.
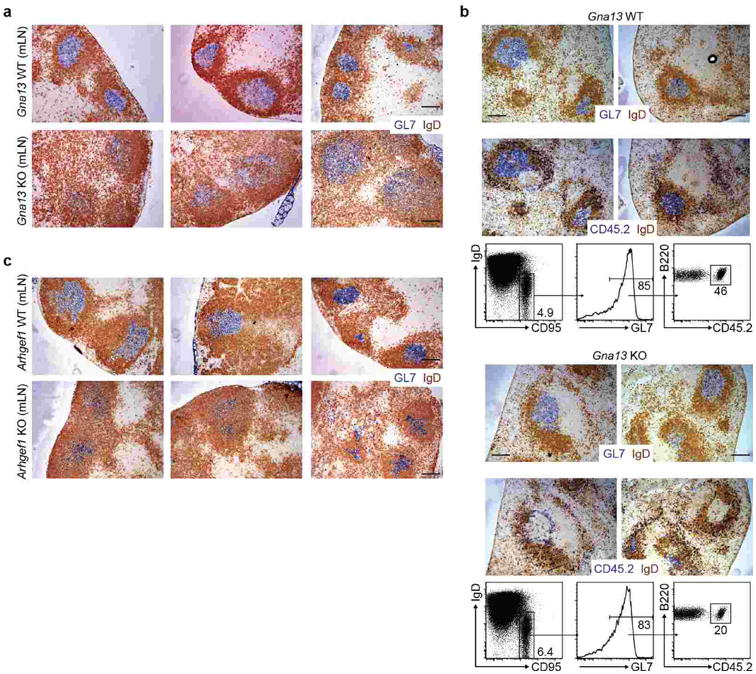
(a) Additional examples of mLN sections from Gna13 WT or KO mice stained for GC B cells (GL7, blue) and naïve B cells (IgD, brown). In the absence of Gα13, the GC border is indistinct and IgD-positive follicular B cells are interspersed with GL7-positive GC B cells throughout the central region of the follicle. The disruption of mLN GC architecture caused by Ga13-deficiency appears more severe than observed in S1pr2-deficient mice3. (b) Mixed B cell transfer showing exclusion of Gna13-deficient GC B cells from the interior of otherwise wild-type GCs. Gna13 WT or KO CD45.2+ B cells were mixed with WT CD45.1+ B cells and transferred into MD4 Ig-transgenic CD45.1+ recipients that were then immunized with SRBCs intraperitoneally and splenic tissue was analyzed by immunohistochemistry and FACS after 8 days for CD45.2+ B cells. This transfer approach allows efficient participation of transferred polyclonal B cells in the GC as the Ig-transgenic recipient B cells are hen-egg lysozyme specific and do not respond to SRBCs. Note that CD45.2+ WT B cells are distributed uniformly through the GL7+ GCs (upper panels) whereas the CD45.2+ Gna13 KO B cells are located at the perimeter of the GC or in the surrounding follicle (lower panels). In each case two example images are shown and the GL7 and CD45.2 stains are of adjacent sections. (c) Additional sections of mLNs from Arhgef1 WT or KO mice, stained for GL7 and IgD. Scale bar is 200 μm in a-c. Data in b is one experiment representative of 2.
Extended Data Figure 7. Augmented GC B cell survival is not sufficient to promote dissemination of GC B cells.
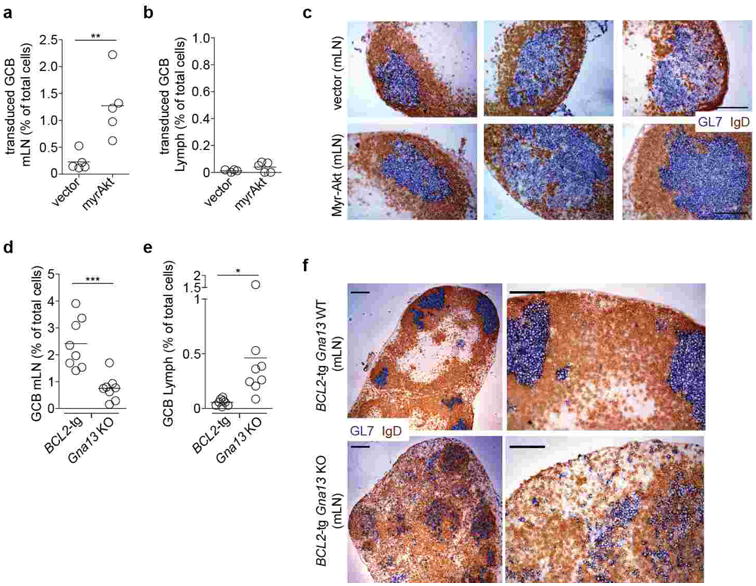
(a-b) Transduced GC B cell frequency amongst total cells in mLN (a) and lymph (b) of mice reconstituted with BM transduced with B cell-restricted control (vector, n=5) or myr-Akt (n=5) expressing retrovirus. (c) Immunohistochemical analysis of mLN sections from mice in a, stained for GL7 and IgD. Scale bar is 100 μm. (d-e) BCL2-tg or Gna13 KO GC B cell frequency amongst total cells in mLN (d) and lymph (e) of BCL2-tg:Gna13 KO mixed chimeras (n=8). (f) Immunohistochemical analysis of mLNs from BCL2-tg Gna13 WT or BCL2-tg Gna13 KO mice. Scale bar in low magnification images (left) is 200 μm and in high magnification images (right) is 100 μm. Data in a, b, d and e are pooled from 2 independent experiments. Data in c and f are representative of at least 3 mice of each type.
Extended Data Figure 8. Human P2RY8 suppresses GC B cell growth and promotes B cell confinement to the GC in mice.

(a, b) P2RY8 mutations arising in GCB-DLBCL and BL disrupt receptor expression. Flag-tagged versions of six point mutant and the wild-type receptor were expressed in WEH231 B cells and surface expression examined by FLAG flow cytometry (a). The transduction efficiency of each construct was confirmed to be similar based on IRES-Thy 1.1 reporter expression (b). (c, d) Fold change in Thy1.1 reporter+ GC relative to Fo B cells from mLN of chimeras described in Fig. 4d-e. (e-g) Immunohistochemical analysis of splenic sections from SRBC-immunized mice given Ig-transgenic (e), Gpr183+/- (f) or Gna13 WT or KO (g) B cells transduced as in Fig. 4f and g and assessed 24 h after cell transfer. Data in e and g are additional examples of the experiments shown in Fig. 4f and g, respectively. Data in f are representative of 4 independent experiments. Scale bar is 200 μm in e-g. *P<0.05, **P<0.01, unpaired two-tailed Student's t test.
Extended Data Figure 9. P2RY8-dependent suppression of GC B cell survival and promotion of B cell confinement to the GC niche is receptor specific.

(a) Transwell migration of WEHI231 cells transduced with retrovirus encoding the control Gα13-coupled receptor, Tbxa2r, toward CXCL12 (100 ng/mL) in the presence or absence of the thromboxane A2 analogue, U-46619. (b, c) Fold change in frequency of Thy1.1 reporter+ GC relative to Fo B cells of PPs (b) or mLN (c) from BM chimeras reconstituted with S1pr2 KO BM transduced with empty vector (control) or Tbxa2r. (d) Immunohistochemical analysis of splenic sections from SRBC-immunized mice given Gpr183+/- B cells transduced with empty vector, Tbxa2r or P2RY8, and assessed 24 h after cell transfer. Scale bar is 200 μm. Data in a and d are one experiment representative of 2. Data in b and c are from one experiment (n=4 in each group). **P<0.01, unpaired two-tailed Student's t test.
Extended Data Figure 10. Model relating disruptions in S1PR2/P2RY8-Ga13-ARHGEF1 migration- and Akt-inhibitory pathway to increases in GC B cell survival, dispersal in the follicle, egress into circulation and dissemination to BM.
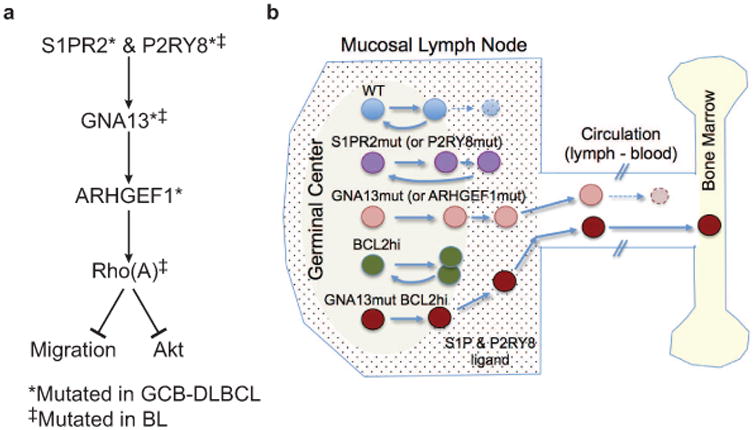
(a) Summary of signaling pathway. (b) Schematic diagram showing GC-containing LN follicle, connection to efferent lymphatic, blood and BM. Suggested distribution of S1P and of putative P2RY8 ligand within LN is shown by dots. Comparative migration and survival behavior of GC B cells with loss (S1PR2, P2RY8, GNA13, ARHGEF1) or gain (BCL2) of function mutations is summarized.
Supplementary Material
Acknowledgments
We thank S. Coughlin for Gna13f/f and Arhgef1-/- mice and R. Proia for S1pr2-/- mice. We thank Xin Geng and Gilad Doitsch for assistance with processing of human tonsil, Andrea Reboldi for helpful discussion and Tal Arnon and Oliver Bannard for critical reading of the manuscript. JRM is supported by a Fellow Award from the Leukemia & Lymphoma Society and NIH institutional training grants (T32 DK007636 and T32 CA1285835) and R.S. is supported by the Dr Mildred Scheel Stiftung für Krebsforschung (Deutsche Krebshilfe). N.V. was supported by NIH grant GM097261 for the modeling work. J.G.C. is an Investigator of the Howard Hughes Medical Institute. The human lymphoma samples were studied under the auspices of the Lymphoma/Leukemia Molecular Profiling Project (LLMPP). The work was supported in part by the Intramural Research Program of the NIH, National Cancer Institute, Center for Cancer Research, and NIH grant AI45073.
Footnotes
The authors declare they have no financial conflicts of interest.
Supplementary Information is linked to the online version of the paper at www.nature.com/nature.
Author Contributions: J.R.M. designed and performed experiments, interpreted the results, and wrote the manuscript. R.S. performed sequencing of cell lines and primary samples and analyzed data. J.A.G. designed experimental procedures used in the manuscript. W.X. analyzed sequence data. A.B.L and N.V. performed computer modeling of S1PR2. S.E.B. performed S1PR2 Western blots. J.A. performed mouse genotyping and cared for the mouse colony. Y.X. performed quantitative PCR. A.R., G.O., R.D.G., L.M.R., E.C., E.S.J., J.D., E.B.S., R.M.B., R.R.T., J.R.C., D.D.W., W.C.C., supplied lymphoma patient samples or lines, and reviewed pathological and clinical data. L.M.S. coordinated human sequence analysis, analyzed data and supervised research. J.G.C. designed experiments, supervised research and wrote the manuscript.
References
- 1.Shaffer AL, 3rd, Young RM, Staudt LM. Pathogenesis of human B cell lymphomas. Annu Rev Immunol. 2012;30:565–610. doi: 10.1146/annurev-immunol-020711-075027. [DOI] [PMC free article] [PubMed] [Google Scholar]
- 2.Klein U, Dalla-Favera R. Germinal centres: role in B-cell physiology and malignancy. Nat Rev Immunol. 2008;8:22–33. doi: 10.1038/nri2217. [DOI] [PubMed] [Google Scholar]
- 3.Green JA, et al. The sphingosine 1-phosphate receptor S1P(2) maintains the homeostasis of germinal center B cells and promotes niche confinement. Nat Immunol. 2011;12 doi: 10.1038/ni.2047. [DOI] [PMC free article] [PubMed] [Google Scholar]
- 4.Cattoretti G, et al. Targeted disruption of the S1P2 sphingosine 1-phosphate receptor gene leads to diffuse large B-cell lymphoma formation. Cancer Res. 2009;69:8686–8692. doi: 10.1158/0008-5472.CAN-09-1110. [DOI] [PMC free article] [PubMed] [Google Scholar]
- 5.Lohr JG, et al. Discovery and prioritization of somatic mutations in diffuse large B-cell lymphoma (DLBCL) by whole-exome sequencing. Proc Natl Acad Sci U S A. 2012;109:3879–3884. doi: 10.1073/pnas.1121343109. [DOI] [PMC free article] [PubMed] [Google Scholar]
- 6.Morin RD, et al. Frequent mutation of histone-modifying genes in non-Hodgkin lymphoma. Nature. 2011;476:298–303. doi: 10.1038/nature10351. [DOI] [PMC free article] [PubMed] [Google Scholar]
- 7.Morin RD, et al. Mutational and structural analysis of diffuse large B-cell lymphoma using whole-genome sequencing. Blood. 2013;122:1256–1265. doi: 10.1182/blood-2013-02-483727. [DOI] [PMC free article] [PubMed] [Google Scholar]
- 8.Worzfeld T, Wettschureck N, Offermanns S. G(12)/G(13)-mediated signalling in mammalian physiology and disease. Trends Pharmacol Sci. 2008;29:582–589. doi: 10.1016/j.tips.2008.08.002. [DOI] [PubMed] [Google Scholar]
- 9.Love C, et al. The genetic landscape of mutations in Burkitt lymphoma. Nat Genet. 2012;44:1321–1325. doi: 10.1038/ng.2468. [DOI] [PMC free article] [PubMed] [Google Scholar]
- 10.Schmitz R, et al. Burkitt lymphoma pathogenesis and therapeutic targets from structural and functional genomics. Nature. 2012;490:116–120. doi: 10.1038/nature11378. [DOI] [PMC free article] [PubMed] [Google Scholar]
- 11.Zhang J, et al. Genetic heterogeneity of diffuse large B-cell lymphoma. Proc Natl Acad Sci U S A. 2013;110:1398–1403. doi: 10.1073/pnas.1205299110. [DOI] [PMC free article] [PubMed] [Google Scholar]
- 12.Schuetz JM, et al. BCL2 mutations in diffuse large B-cell lymphoma. Leukemia. 2012;26:1383–1390. doi: 10.1038/leu.2011.378. [DOI] [PubMed] [Google Scholar]
- 13.Sehn LH, et al. Impact of concordant and discordant bone marrow involvement on outcome in diffuse large B-cell lymphoma treated with R-CHOP. J Clin Oncol. 2011;29:1452–1457. doi: 10.1200/JCO.2010.33.3419. [DOI] [PubMed] [Google Scholar]
- 14.Forbes SA, et al. COSMIC: mining complete cancer genomes in the Catalogue of Somatic Mutations in Cancer. Nucleic Acids Res. 2011;39:D945–950. doi: 10.1093/nar/gkq929. [DOI] [PMC free article] [PubMed] [Google Scholar]
- 15.Nogai H, Dorken B, Lenz G. Pathogenesis of non-Hodgkin's lymphoma. J Clin Oncol. 2011;29:1803–1811. doi: 10.1200/JCO.2010.33.3252. [DOI] [PubMed] [Google Scholar]
- 16.Morin RD, et al. Somatic mutations altering EZH2 (Tyr641) in follicular and diffuse large B-cell lymphomas of germinal-center origin. Nat Genet. 2010;42:181–185. doi: 10.1038/ng.518. [DOI] [PMC free article] [PubMed] [Google Scholar]
- 17.Pfeifer M, et al. PTEN loss defines a PI3K/AKT pathway-dependent germinal center subtype of diffuse large B-cell lymphoma. Proc Natl Acad Sci U S A. 2013;110:12420–12425. doi: 10.1073/pnas.1305656110. [DOI] [PMC free article] [PubMed] [Google Scholar]
- 18.Xiao C, et al. Lymphoproliferative disease and autoimmunity in mice with increased miR-17-92 expression in lymphocytes. Nat Immunol. 2008;9:405–414. doi: 10.1038/ni1575. [DOI] [PMC free article] [PubMed] [Google Scholar]
- 19.Beguelin W, et al. EZH2 is required for germinal center formation and somatic EZH2 mutations promote lymphoid transformation. Cancer Cell. 2013;23:677–692. doi: 10.1016/j.ccr.2013.04.011. [DOI] [PMC free article] [PubMed] [Google Scholar]
- 20.Caganova M, et al. Germinal center dysregulation by histone methyltransferase EZH2 promotes lymphomagenesis. J Clin Invest. 2013;123:5009–5022. doi: 10.1172/JCI70626. [DOI] [PMC free article] [PubMed] [Google Scholar]
- 21.Pasqualucci L, et al. Analysis of the coding genome of diffuse large B-cell lymphoma. Nat Genet. 2011;43:830–837. doi: 10.1038/ng.892. [DOI] [PMC free article] [PubMed] [Google Scholar]
- 22.Iqbal J, et al. BCL2 translocation defines a unique tumor subset within the germinal center B-cell-like diffuse large B-cell lymphoma. Am J Pathol. 2004;165:159–166. doi: 10.1016/s0002-9440(10)63284-1. [DOI] [PMC free article] [PubMed] [Google Scholar]
- 23.Kozasa T, Hajicek N, Chow CR, Suzuki N. Signalling mechanisms of RhoGTPase regulation by the heterotrimeric G proteins G12 and G13. J Biochem. 2011;150:357–369. doi: 10.1093/jb/mvr105. [DOI] [PMC free article] [PubMed] [Google Scholar]
- 24.Rohde M, et al. Recurrent RHOA mutations in Pediatric Burkitt Lymphoma Treated According to the NHL-BFM Protocols. Genes Chromosomes Cancer. 2014 doi: 10.1002/gcc.22202. online. [DOI] [PubMed] [Google Scholar]
- 25.Li Z, et al. Regulation of PTEN by Rho small GTPases. Nat Cell Biol. 2005;7:399–404. doi: 10.1038/ncb1236. [DOI] [PubMed] [Google Scholar]
- 26.Michaud J, Im DS, Hla T. Inhibitory role of sphingosine 1-phosphate receptor 2 in macrophage recruitment during inflammation. J Immunol. 2010;184:1475–1483. doi: 10.4049/jimmunol.0901586. [DOI] [PMC free article] [PubMed] [Google Scholar]
- 27.Guilluy C, Garcia-Mata R, Burridge K. Rho protein crosstalk: another social network? Trends Cell Biol. 2011;21:718–726. doi: 10.1016/j.tcb.2011.08.002. [DOI] [PMC free article] [PubMed] [Google Scholar]
- 28.Kono M, et al. The sphingosine-1-phosphate receptors S1P1, S1P2, and S1P3 function coordinately during embryonic angiogenesis. J Biol Chem. 2004;279:29367–29373. doi: 10.1074/jbc.M403937200. [DOI] [PubMed] [Google Scholar]
- 29.Francis SA, Shen X, Young JB, Kaul P, Lerner DJ. Rho GEF Lsc is required for normal polarization, migration, and adhesion of formyl-peptide-stimulated neutrophils. Blood. 2006;107:1627–1635. doi: 10.1182/blood-2005-03-1164. [DOI] [PMC free article] [PubMed] [Google Scholar]
- 30.Ruppel KM, et al. Essential role for Galpha13 in endothelial cells during embryonic development. Proc Natl Acad Sci U S A. 2005;102:8281–8286. doi: 10.1073/pnas.0503326102. [DOI] [PMC free article] [PubMed] [Google Scholar]
- 31.Hobeika E, et al. Testing gene function early in the B cell lineage in mb1-cre mice. Proc Natl Acad Sci U S A. 2006;103:13789–13794. doi: 10.1073/pnas.0605944103. [DOI] [PMC free article] [PubMed] [Google Scholar]
- 32.Strasser A, et al. Enforced bcl2 expression in B-lymphoid cells prolongs antibody responses and elicits autoimmune disease. Proc Natl Acad Sci USA. 1991;88:8661–8665. doi: 10.1073/pnas.88.19.8661. [DOI] [PMC free article] [PubMed] [Google Scholar]
- 33.Pereira JP, Kelly LM, Xu Y, Cyster JG. EBI2 mediates B cell segregation between the outer and centre follicle. Nature. 2009;460:1122–1126. doi: 10.1038/nature08226. [DOI] [PMC free article] [PubMed] [Google Scholar]
- 34.Ngo VN, et al. A loss-of-function RNA interference screen for molecular targets in cancer. Nature. 2006;441:106–110. doi: 10.1038/nature04687. [DOI] [PubMed] [Google Scholar]
- 35.Reif K, et al. Balanced responsiveness to chemoattractants from adjacent zones determines B-cell position. Nature. 2002;416:94–99. doi: 10.1038/416094a. [DOI] [PubMed] [Google Scholar]
- 36.Matloubian M, et al. Lymphocyte egress from thymus and peripheral lymphoid organs is dependent on S1P receptor 1. Nature. 2004;427:355–360. doi: 10.1038/nature02284. [DOI] [PubMed] [Google Scholar]
- 37.Cobaleda C, Jochum W, Busslinger M. Conversion of mature B cells into T cells by dedifferentiation to uncommitted progenitors. Nature. 2007;449:473–477. doi: 10.1038/nature06159. [DOI] [PubMed] [Google Scholar]
Associated Data
This section collects any data citations, data availability statements, or supplementary materials included in this article.