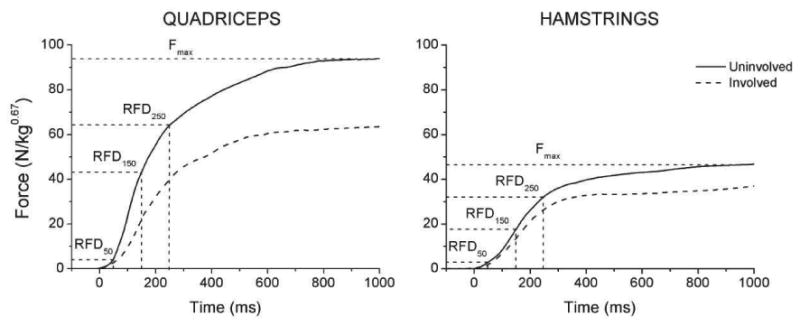
Figure 1.

Quadriceps and hamstrings force–time profiles recorded from the involved (dashed line) and uninvolved (solid line) leg of a representative subject. The maximum strength (Fmax) and instants of obtaining the data for RFD50, RFD150 and RFD250 are indicated. RFDmax (not indicated) was calculated as the maximum of the first derivatives of the depicted force-time curves.
