Abstract
Ziram is a dimethyldithiocarbamate fungicide which can cause intraneuronal calcium (Ca2+) dysregulation and subsequently neuronal death. The signaling mechanisms underlying ziram-induced Ca2+ dyshomeostasis and neurotoxicity are not fully understood. NCX3 is the third isoform of the sodium-calcium exchanger (NCX) family and plays an important role in regulating Ca2+ homeostasis in excitable cells. We previously generated a mouse model deficient for the sodium-calcium exchanger 3 and showed that NCX3 is protective against ischemic damage. In the present study, we aim to examine whether NCX3 exerts a similar role against toxicological injury caused by the pesticide ziram. Our data show baby hamster kidney (BHK) cells stably transfected with NCX3 (BHK-NCX3) are more susceptible to ziram toxicity than cells transfected with the empty vector (BHK-WT). Increased toxicity in BHK-NCX3 was associated with a rapid rise in cytosolic Ca2+ concentration [Ca2+i] induced by ziram. Profound mitochondrial dysfunction and ATP depletion were also observed in BHK-NCX3 cells following treatment with ziram. Lastly, primary dopaminergic neurons lacking NCX3 (NCX3−/−) were less sensitive to ziram neurotoxicity than wildtype control dopaminergic neurons. These results demonstrate that NCX3 genetic deletion protects against ziram-induced neurotoxicity and suggest NCX3 and its downstream molecular pathways as key factors involved in ziram toxicity. Our study identifies new molecular events through which pesticides (e.g. ziram) can lead to pathological features of degenerative diseases such as Parkinson’s disease and indicates new targets to slow down neuronal degeneration.
Keywords: sodium-calcium exchanger, neurotoxicity, calcium, ziram, pesticide, Parkinson’s disease
Introduction
Ziram is a dimethyldithiocarbamates (DMC) fungicide used in agriculture to control fungal diseases on stone fruits, pome fruits, nut crops, vegetables and commercially grown ornamentals. Ziram is also formulated as a rabbit repellent and as an additive in industrial adhesives, caulking, and latex paints. The total annual domestic use of ziram is estimated at ~ 1.9 million pounds of active ingredient. Besides the useful properties as a fungicide, ziram also proves toxic to mammals and epidemiological studies revealed a strong association between residential exposure to ziram and increased incidence of Parkinson’s disease (PD) (Wang et al., 2011). The mechanism of toxicity for ziram has not been thoroughly examined. Its primary target organs seem to be the nervous system, liver, and thyroid. Chronic exposure to ziram can induce neuronal death and it was shown that cultured dopaminergic (DA) neurons are more sensitive to the neurotoxic effects of ziram compared to other neuronal population in the same cultures (Chou et al., 2008). Following systemic administration of sodium dimethyl dithiocarbamate (Na-DMC), a compound similar to ziram, mice developed motor dysfunction and a decreased number of DA striatal terminals reminiscent of PD (Chou, 2008). In cultured hippocampal neurons, acute ziram application induced a rapid, several fold increase in spontaneous neurotransmitter release from both excitatory and inhibitory neurons (Rinetti and Schweizer, 2010), suggesting a dysregulation of neuronal microcircuits. In PC12 rat pheochromocytoma cells exposed to ziram, an increase in intracellular Ca2+ concentration ([Ca2+i]) following stimulation of non-selective cation channels has been reported (Sook Han et al., 2003). These findings are consistent with a role of Ca2+-dysregulation in ziram induced neurotoxicity.
The Sodium-Calcium exchanger (NCX) is a plasma membrane protein regulating Ca2+ homeostasis of most cells. NCX play a relevant role in neurons, where a change in cytoplasmic Ca2+ concentration represents a pivotal event in several physiological (e.g. synaptic transmission) and pathological processes (e.g. ischemia) (Bano et al., 2005, Fontana et al., 1995, Sanchez-Armass and Blaustein, 1987). NCX can operate in two modes which are referred to “Ca2+ exit mode” and “Ca2+ entry mode” exchange (Blaustein and Lederer, 1999, Hilge, 2012). The operating mode, effectively the direction of exchange, relies on the Na+ and Ca2+ gradients across the plasma membrane and on the membrane potential. The Ca2+ exit mode of exchange (forward mode) is defined operationally as an external Na+-dependent Ca2+ efflux and an internal Ca2+-dependent Na+-influx. The Ca2+ entry mode of exchange (reverse mode) is usually defined as an internal Na+-dependent Ca2+ influx and external Ca2+-dependent Na+-efflux. Because of the lack of selective inhibitors, it is not clear whether NCX contributes to both net Ca2+ entry and net Ca2+ exit under normal physiological conditions. Nevertheless, there is general consensus that the exchanger plays an important role in extruding Ca2+ in many cell types (Blaustein and Lederer, 1999). Three isoforms of the exchanger have been cloned (NCX1, NCX2, and NCX3) and they are encoded by distinct genes (Linck et al., 1998, Quednau et al., 1997). NCX1 is most abundant in the heart and is widely distributed in excitable cells (Minelli et al., 2007, Thurneysen et al., 2002). NCX2 expression is restricted to the brain and spinal cord (Jeon et al., 2003, Minelli, 2007), while NCX3 expression is limited to the central nervous system and skeletal muscle (Minelli, 2007, Sokolow et al., 2004). In situ hybridization experiments in rodent brain showed that NCX1, NCX2 and NCX3 mRNA are distributed in all brain regions including the substantia nigra (SNc), a region primarily affected in PD (Canitano et al., 2002). The functional roles of each isoform in neurons still need to be elucidated.
NCX1 knockout mice are not viable (Nguidjoe et al., 2011, Wakimoto et al., 2003) but functional analysis can be conducted in heterozygous NCX1+/− mice (Morimoto et al., 2012, Nguidjoe, 2011). Recently, Morimoto et al. showed the protective role of NCX1 against brain ischemia in mice (Morimoto, 2012). Their study suggests that selective NCX1 inhibitors need to be further investigated as therapeutic agents against ischemic damages. Others examined NCX1 and NCX3 signaling pathways occurring in ischemic pre- and post-conditioning induced neuroprotection in rats (Pignataro et al., 2012, Pignataro et al., 2013, Sisalli et al., 2014). They found that the neuroprotective role in pre- and post-conditioning may result from NCX1 and NCX3 up-regulation and subsequent Ca2+-associated downstream pathways (e.g. AKT, nitric oxide) in the endoplasmic reticulum and mitochondria. Studies in NCX2 deficient mice implied that NCX2 is important for cognitive function (Jeon, 2003). We produced NCX3 knockout mice and showed that NCX3 plays a significant role in cognition (Molinaro et al., 2011), in oligodendrocyte differentiation (Boscia et al., 2013), in amyloid-beta pathology (Pannaccione et al., 2012, Sokolow et al., 2011) and is protective against ischemic damage (Cross et al., 2009, Jeffs et al., 2008, Molinaro et al., 2013, Molinaro et al., 2008).
ATP depletion inhibits NCX1 and NCX2 activity possibly through PIP2 pathways (Fang et al., 1998, Linck, 1998); however, NCX3 does not rely on ATP for its regulation (Molinaro, 2013, Molinaro, 2008).
Ago et al. recently suggested that NCX inhibitor, SEA0400, ameliorated 1-methyl-4-phenyl-1,2,3,6-tetrahydropyridine (MPTP)-induced motor deficits and reduced the decline in DA levels and tyrosine hydroxylase (TH) immunoreactivity in the midbrain and striatum of MPTP treated mice (Ago et al., 2011). This study implied that NCX is a novel molecular target for PD therapy (Ago, 2011).
In the present study, we aimed to determine the role of NCX3 in the toxicology of ziram. We examined NCX3 function in ziram-induced Ca2+ dysregulation and toxicity using baby hamster kidney (BHK) cells expressing solely NCX3 (BHK-NCX3) and primary ventral mesencephalic neurons isolated from NCX3-deficient mice. We found that BHK-NCX3 are more susceptible to ziram toxicity compared to wild-type (WT) cells which do not constitutively express NCX3. This increase in ziram-induced toxicity in BHK-NCX3 cells correlated with a significant increase in intracellular Ca2+ concentration ([Ca2+i]), mitochondrial dysfunction and ATP depletion. We also observed a neuroprotective effect of NCX3 genetic deletion as DA neurons lacking NCX3 (NCX3−/−) were less vulnerable to ziram toxicity than control neurons. In conclusion, our findings propose a new mechanism of ziram-induced calcium dysregulation and toxicity and suggest that NCX3 might offer a molecular target for intervention in degenerative diseases.
Material and methods
Materials
Hams’ F12, DMEM medium, trypsin, penicillin, streptomycin, heat-inactivated fetal bovine serum, fluorescent dyes (i.e. fluo-3AM, Oregon Green® 488 BAPTA-1 AM, Tetramethylrhodamine, ethyl ester [TMRE], propidium iodide [PI], calcein-AM and pluronic acid were obtained from Life Technologies (Grand Island, NY, USA). Poly-L-lysine, Zinc dimethyldithiocarbamate (ziram) were from Sigma-Aldrich (St. Louis, MO). 2-[2-[4-(4-Nitrobenzyloxy)phenyl-]ethyl]isothiourea mesylate (KBR-7943) was from Tocris Bioscience (Ellisville, MO, USA).
Cell culture
Wild-type BHK (BHK-WT) cells and BHK cells stably transfected with rat brain NCX3 (BHK-NCX3) were donated by K. Philipson (Linck, 1998, Nicoll et al., 1996) and grown in a mix of DMEM and Ham’s F12 media (1:1) supplemented with 5% fetal bovine serum, 100 U/ml penicillin, and 100 μg/ml streptomycin (Life Technologies, Carlsbad, CA, USA) (Linck, 1998, Nicoll, 1996, Pannaccione, 2012). Cells were cultured in a humidified 5% CO2 atmosphere. Treatments with ziram were performed at 24 h after plating. A stock solution of 10 mM ziram was prepared by solubilizing ziram in 100% DMSO and used by diluting in culture medium, normal Krebs or Na+-free Krebs for treatment of cells. Upon treatments, DMSO (vehicle control) was ultimately diluted ≤ 0.1 vol. % that alone did not induce any cell death.
Living and dead cells ratio
Cell toxicity after ziram treatment was evaluated by measuring the ratio between dead and living cells. BHK-WT or BHK-NCX3 cells were grown on 12 mm diameter coverslips overnight and then treated with ziram or DMSO (as control). After treatment, the cells were washed with PBS and double labeled with 50 nM Calcein-AM (an indicator of living cells) and 3 μM PI (an indicator of non-viable cells) for 15 min at room temperature. Stained cells were examined immediately with a Zeiss Imager M2 fluorescence microscope (Carl Zeiss, Germany) equipped with Zeiss filter sets 038 (excitation BP 470/40 nm, beam splitter FT 495 nm and emission BP 525/50 nm) and 043 (excitation BP 545/25 nm, beam splitter FT 570 nm and emission BP 605/70 nm) (Carl Zeiss, Germany) allowing the specific detection of Calcein-AM (excitation peak 493/emission peak 514 nm) and PI (excitation peak 538/emission peak 617 nm), respectively. Calcein-AM and PI positive cells were counted in four representative high power fields for each coverslip. Cell toxicity was determined from three coverslips by the ratio of the number of [PI positive cells]/[PI + Calcein AM-stained positive cells].
Flow cytometry
Ziram-treated cells were harvested and washed twice with cold PBS/5 mM EDTA (pH 7.4) by centrifugation. Resuspended cells were either incubated with 50 nM Calcein-AM in PBS for 30 min at RT or 3 μM solution of PI in PBS and incubated at RT for 15 min, then washed by centrifugation and resuspended in 0.5 ml PBS. Data on 2,500 cells were collected using a FACScan (Becton Dickinson, San Jose, CA, USA). Analysis was performed using FCS Express software (DeNovo Software, Los Angeles, CA, USA).
Mitochondrial membrane potential imaging and Ca2+ measurement
Mitochondrial health was assessed using the fluorescent dye tertramethyl rhodamine ethyl ester (TMRE): brighter fluorescence indicates healthier mitochondria. Intracellular Ca2+ levels were assessed using Oregon Green® 488 BAPTA-1 AM. First, cells were incubated with different concentrations of ziram in DMEM medium. After ziram treatment, BHK cells were loaded with 20 nM TMRE and 5 μM Oregon Green BAPTA-1 for 30 min in a buffer containing (in mM): 156 NaCl, 3 KCl, 2, MgSO4, 1.25 KH2PO4, 2 CaCl2, 10 glucose, and 10 Hepes, pH adjusted to 7.35 with NaOH. At the end of the incubation, cells were washed in the buffer and examined immediately with an Imager M2 fluorescence microscope (Carl Zeiss, Germany). Stained cells were examined immediately with a Zeiss Imager M2 fluorescence microscope (Carl Zeiss, Germany) microscope equipped with Zeiss filter sets 038 (excitation BP 470/40 nm, beam splitter FT 495 nm and emission BP 525/50 nm) and 043 (excitation BP 545/25 nm, beam splitter FT 570 nm and emission BP 605/70 nm) (Carl Zeiss, Germany) allowing the specific detection of Oregon Green BAPTA (excitation peak 490/emission peak 517 nm) and TMRE (excitation peak 552/emission peak 578 nm), respectively. Fluorescence intensity was quantified using ImageJ software (Schneider et al., 2012).
Measurement of intracellular ATP concentration
Intracellular ATP concentration was measured with a commercial bioluminescent assay (ATP bioluminescent assay kit, Sigma, St. Louis, Missouri, USA) according to manufacturer’s instruction. Briefly, ATP was extracted by boiling the samples in a solution containing (in mM) 100 TRIS, 4 EDTA, pH 7.75. After centrifugation at 10,000×g for 60 sec. supernatants were diluted 1:25 in dilution buffer (Sigma, St. Louis, Missouri, USA) and mixed with ATP Mix solution. Light intensity was measured with Perkin Elmer Victor X2 microplate reader (Waltham, MA, USA). The standard curve of ATP was obtained by serial dilution of 2 μM ATP solution.
Measurement of [Ca2+i] changes over time
BHK-WT and BHK-NCX3 cells, grown on poly-D-lysine covered glass coverslips, were loaded with 5 μM Fluo-3 AM (Life Technologies, Carlsbad, CA, USA) for 30 min at 37 °C in normal Krebs solution containing the following (in mM): 5.5 KCl, 160 NaCl, 1.2 MgCl2, 1.5 CaCl2, 10 glucose, and 10 Hepes–NaOH, pH 7.4. Coverslips were then placed into a perfusion chamber mounted onto a Zeiss LSM5 PASCAL confocal laser scanning microscope (Carl Zeiss, Germany). Fluo-3 fluorescence (excitation peak 488/emission peak 526 nm) was observed using the 488 nm Argon Laser for illumination, a HFT488 dichroic mirror and a 505 nm long-pass emission filter. Images were collected every 3 or 5 seconds using a 20× objective (Plan-Apochromat 20×/0.8, Carl Zeiss, Germany). Sixty to eighty individual cells were selected from each coverslip and fluorescence intensity over time was quantified using ImageJ (Schneider, 2012). NCX3 activity was evaluated as Ca2+ uptake through the reverse mode by switching the normal Krebs medium to Na+-deficient NMDG-medium (Na+-free) (in mM): 5.5 KCl, 147 N-methyl glucamine (NMDG), 1.2 MgCl2, 1.5 CaCl2, 10 glucose, and 10 Hepes–HCl (pH 7.4).
Western blotting analysis
Samples were boiled in Laemmli loading buffer (Invitrogen, Carlsbad, CA) and electrophoresed on 8% SDS-Polyacrylamide gels (Expedeon, San Diego, CA). Proteins were transferred to polyvinylidene difluoride (PVDF) membranes (0.45 μm) in Tris-glycine buffer containing 20% methanol, then blocked for 1 h at room temperature in 5% BSA, followed by incubation overnight at 4°C with rabbit polyclonal NCX3 antibody (1:1000) (Thurneysen, 2002) in PBS containing 0.01% Tween 20 (PBS-T) and 1.5% (W/V) BSA and 0.05% sodium azide:. Membranes were then incubated for 1 h with horseradish peroxidase (HRP)-conjugated anti-rabbit IgG (1:30,000) (Jackson ImmunoResearch, West Grove, PA), washed and developed with SuperSignal West Dura substrate (Thermo Scientific, Waltham, MA) and exposed to an OptiChemi HR Camera 600 (UVP Imaging, Upland, CA).
Mouse colonies
C57/Bl6 (wild-type controls) and NCX3 deficient (NCX3−/−) pregnant females were used for the preparation of primary neuron culture. NCX3−/− mice were generated by inserting a neomycin resistance cassette (neo) into the exon 2 of NCX3 gene (Sokolow, 2004). NCX3−/− mice were backcrossed against C57/Bl6 background for a minimum of 6 generations (Molinaro, 2008). Experiments were performed in accordance to the international guidelines for animal research, the Guide for the Care and Use of Laboratory Animals (National Academy Press, 1996) and approved by the Animal Research Committee of the UCLA Office for the Protection of Research.
Mouse Primary Ventral Mesencephalic Cultures (PVMC) and immunocytochemistry
PVMC were prepared by using a protocol adapted from (Choi et al., 2011). Briefly, VM cells dissociated from embryonic day 14 (E14) mouse fetuses were plated on 24-well culture plates with glass coverslips that were coated with poly-D-lysine (50 μg/mL, Sigma, St. Louis, MO) and laminin (5 μg/mL, Sigma) at a density of 1.0× 10⁵ cells/well in DMEM supplemented 10% FBS, 100 U/mL penicillin and 100 μg/mL streptomycin, 25 mM HEPES, and 30 mM glucose. One half of the medium was changed at DIV3 (DIV; days in vitro). At DIV5, one half of the medium was replaced with DMEM-F12 supplemented with 1% N2 supplement and 10 mg/mL BSA. PVMC were treated with ziram (0.5 – 1 μM) or DMSO (control) at DIV7 for 24 hours. At the end of the treatment, the cultures were immediately washed and fixed in 4% paraformaldehyde for 15 min. The cultures were then incubated with anti-tyrosine hydroxylase (TH) antibodies (1:1000; EMD Millipore, Billerica, MA, USA) and anti-Neuronal Nuclei (NeuN) antibodies (1:100; Chemicon, Temecula CA) overnight at 4 °C. Cells were stained for 1 h with Alexa Fluor 488 Goat Anti-Mouse (1:1000, Life Technologies, Carlsbad, CA, USA) or Alexa Fluor 568 Goat Anti-Rabbit (1:1000, Life Technologies, Carlsbad, CA, USA) secondary antibody. After staining and prior to counting, the coverslips were randomly assigned an identification number. TH+ and NeuN+ immunoreactive neuron counts were then determined manually by blind raters to the experimental conditions (Chou, 2008).
Statistical analysis
Statistical analysis was performed using Prism software (GraphPad software, San Diego, CA). All experiments were performed at least three times on separate days. On individual days, experiments were performed in duplicate or triplicate and averaged to form a single experiment unit. Data are presented as means ± SEM. Analyses were performed using analysis of variance. Statistical analysis was conducted on actual cell counts and Bonferroni’s or Tukey’s post hoc multiple comparison tests were performed when appropriate.
Results
Increased ziram-induced cytotoxicity in BHK-NCX3 cells
We used multiple assay endpoints to measure the toxic effects of ziram in wild-type BHK cells (BHK-WT) which do not constitutively express NCX3, and in BHK cells stably transfected with NCX3 (BHK-NCX3)(Linck, 1998, Minelli, 2007, Nicoll, 1996). In both cell lines, we compared the toxicological damages caused by a 24 h-exposure of 1 μM ziram to an acute exposure of 2 h with a dose of ziram 10 times higher (Sook Han, 2003).
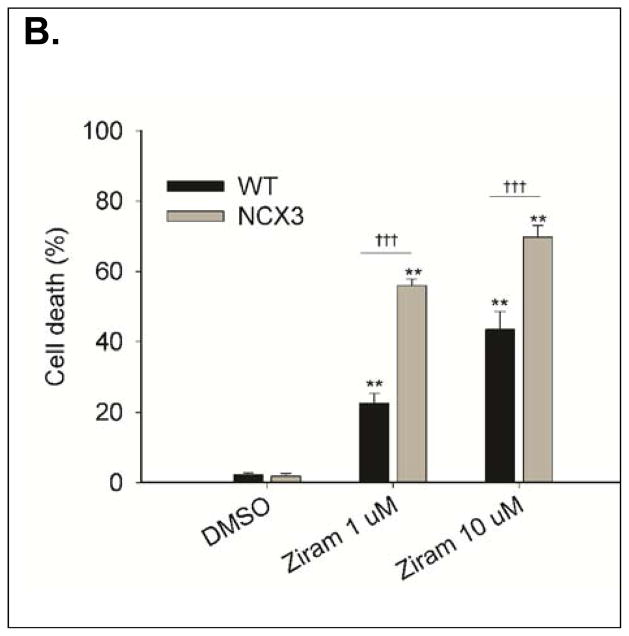
We first assessed the ratio of viable (i.e. calcein-AM positive) and non-viable cells (i.e. PI positive) by fluorescence microscopy (Fig. 1A). Two-way ANOVA revealed a significant treatment × genotype interaction [F2, 55 = 23.90, P < 0.0001]. BHK-NCX3 cells were more susceptible to ziram cytotoxicity than BHK-WT exposed to 1 μM ziram for 24h (56.0 ± 1.8 % of cell death in BHK-NCX3 vs. 22.7 ± 2.7 % of cell death in BHK-WT; P < 0.001) or 10 μM ziram for 2 h (68.7 ± 3.3 % of cell death in BHK-NCX3 vs. 43.5 ± 5.1 % of cell death in BHK-WT; P < 0.001) (Fig. 1B).
Figure 1.
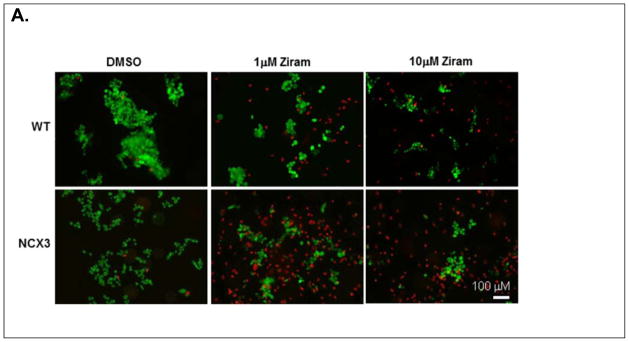
Effect of ziram treatment on cell viability in BHK-WT and BHK-NCX3 cells. (A). Representative fluorescent images of BHK-WT and BHK-NCX3 cells double stained with calcein-AM and propidium iodide in control conditions (left panels), following 24 h treatment with ziram 1 μM (middle panels) and following 2 h treatment with 10 μM ziram (right panels).
(B). Bar graph illustrating cell death in BHK-WT and BHK-NCX3 cells following ziram exposure and in control condition (DMSO-24h). **P < 0.001 vs. DMSO control condition; ††† P < 0.001 vs. BHK-WT cells. Each bar represents the mean (± S.E.M.) of 10–20 different experimental values studied in at least three independent experimental sessions.
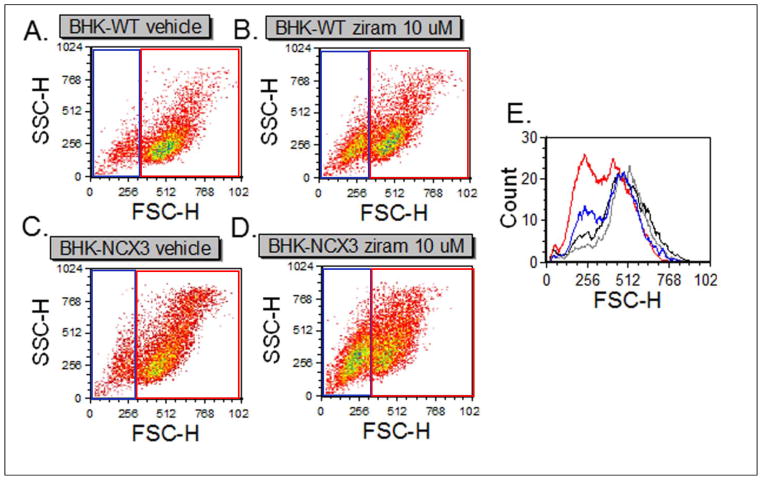
We then used fluorescence activated cell sorting (FACS) methods to assess the acute effects (i.e. 2 h exposure) of 10 μM ziram on cell morphology, cell viability and cell death. We analyzed 2,500 cells within each sample using the forward scatter parameter (FSC), which is proportional to the cell volume and the side scatter parameter (SSC) which measures the internal complexity of the cell (Fig. 2). FSC and SSC analysis revealed that a larger population of BHK-NCX3 cells were dying (Fig 2D, left gate) following ziram exposure compared to vehicle control (Fig. 2C) and to ziram-treated BHK-WT cells (Fig. 2B). Histograms in Figure 2E showed a higher distribution of dying BHK-NCX3 cells (red line) compared to BHK-WT cells (blue line) following ziram treatment.
Figure 2.
Effect of ziram on cell morphology following treatment with 10 μM ziram. (A–B) Representative dot plots of BHK-WT cells following 2 h treatment with DMSO (vehicle control) or 10 μM ziram. (C–D) Representative dot plots of BHK-NCX3 cells following 2 h treatment with DMSO (vehicle control) or 10 μM ziram. (E) Representative histogram of BHK-WT and BHK-NCX3 cells treated with DMSO (black and gray respectively) or 10 μM ziram (blue and red respectively).
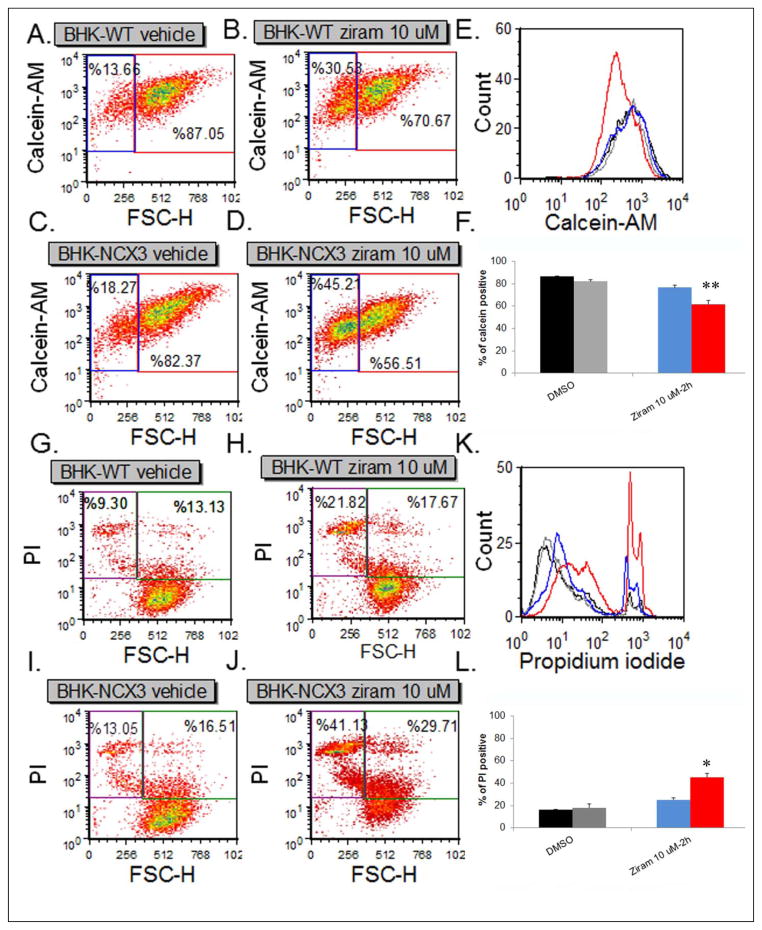
Lastly, we acquired calcein-AM and PI fluorescence intensity on 2,500 cells within each sample. Representative density plots of calcein-AM fluorescence in BHK-WT cells and BHK-NCX3 cells treated with vehicle only or ziram 10 μM are shown in Fig. 3A–D. The percentage of fluorescent particles included in the upper right quadrant represents viable BHK cells. Two-way ANOVA revealed a significant treatment × genotype interaction [F1, 8 = 5.40, P < 0.05]. A significant decrease in cell viability (i.e. calcein-AM positive cells) was observed in ziram-treated BHK-NCX3 cells (61.7 ± 2.9 % of calcein-AM positive cells) compared to vehicle control and to ziram-treated BHK-WT (76.7 ± 3.1 % of calcein-AM positive cells; P < 0.01). Representative density plots of PI fluorescence in BHK-WT and BHK-NCX3 cells treated with vehicle only or 10 μM ziram are shown in Fig. 3G–L. The percentage of fluorescent particles included in the upper left quadrant represents non-viable BHK cells. Two-way ANOVA revealed a significant treatment × genotype interaction [F1, 8 = 6.18, P < 0.05]. As illustrated in Fig. 3L, a significant increase was observed in PI positive BHK-NCX3 treated cells (45.3 ± 5.0 % of PI positive cells) compared to vehicle control and to ziram-treated BHK-WT (25.2 ± 3.2 of PI positive cells; P < 0.05).
Figure 3.
Flow cytometry analysis of BHK-WT and BHK-NCX3 cell viability and cell death following 2 h treatment with 10 μM ziram. (A–D) Representative density plots of BHK-WT (A and B) and BHK-NCX3 (C and D) cells labeled with calcein-AM. The forward scatter parameter (FCS) on the X-axis is proportional to size. (E) Representative flow cytometric histograms showing functional incorporation of calcein-AM in BHK-WT and BHK-NCX3 cells treated with DMSO (black and gray histograms respectively) or 10 μM ziram (blue and red histograms respectively). (F) Bar graph illustrating the % of calcein-AM positive cells in the upper right quadrant for BHK-WT cells treated with DMSO (black bars) or ziram (blue bars) and BHK-NCX3 cells treated with DMSO (grey bars) or ziram (red bars). (G–J) Representative density plots of BHK-WT (G and H) and BHK-NCX3 (I and J) cells labeled with PI. (K) Representative flow cytometric histograms showing incorporation of PI in nonviable BHK-WT and BHK-NCX3 cells treated with DMSO (black and gray histograms respectively) or 10 μM ziram (blue and red histograms respectively). (F) Bar graph illustrating the % of PI positive cells in the upper left quadrant for BHK-WT cells treated with DMSO (black bars) or ziram (blue bars) and BHK-NCX3 cells treated with DMSO (grey bars) or ziram (red bars). Each bar represents the mean (±S.E.M.) of 2,500 cells studied in three independent experimental sessions. *P < 0.05, **P < 0.01compared to treated BHK-WT.
Ziram-produced Ca2+ influx in BHK-NCX3 cells
To determine the effect of ziram on NCX3 activity in its forward and reverse modes (Blaustein and Lederer, 1999, Hilge, 2012), we examined ziram-induced alteration of intracellular Ca2+ in Fluo-3AM loaded BHK cells.
We first examined the effect of ziram when NCX3 operates in its forward mode. In the presence of extracellular Na+, ziram induced a rapid and sustained Ca2+ increase in BHK-NCX3 but not in BHK-WT (Fig. 4A). These data indicate that under these experimental conditions ziram inhibits NCX3 activity in its Ca2+ exit exchange mode (forward mode). Ca2+-induced elevation by ziram was not occluded when cells were incubated with KBR-7943, a relatively specific inhibitor for the reverse mode of NCX3, but it was rather potentiated (Fig. 4A). This effect may be caused by the ability of KB-R7943 to inhibit complex I in the mitochondrial respiratory chain (Brustovetsky et al., 2011).
Figure 4.
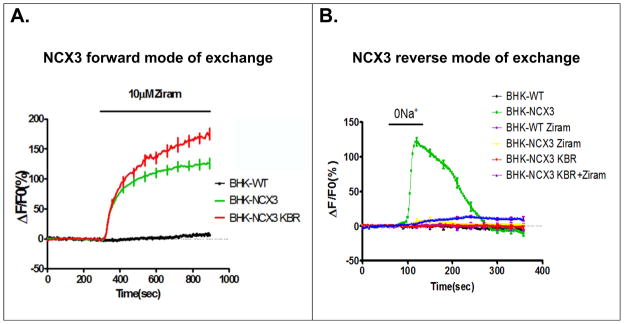
Ziram-induced increase of intracellular Ca2+ in BHK-NCX3 cells. (A) Effects of ziram on [Ca2+i] when BHK-WT and BHK-NCX3 cells were perfused in normal Krebs (NCX3 forward mode of exchange). Superimposed traces of the effects of ziram on [Ca2+i] when BHK cells were incubated in normal Krebs or in the presence of 10 μM KBR-7943 (KBR) (B) Effect of Na+-free solution on NCX3 reverse activity in BHK-WT and in BHK-NCX3 cells. Superimposed traces of the effect of Na+-free on [Ca2+i] when BHK cells were perfused in Na+-free solution alone, or pre-incubated with 10μM ziram, 10 μM KB-R7943 (KBR) or 10 μM KB-R7943 + 10 μM ziram (KBR+ziram).
Then, we studied the effect of ziram when NCX3 operates in its “Ca2+ entry mode” of exchange (reverse mode). Our results showed that Ca2+-influx was abolished when BHK-NCX3 cells were pre-incubated with 10 μM ziram and then exposed to a Na+-free solution (Fig. 4B). Induced inhibition of NCX3 by ziram-alone or in combination with the ‘reverse mode’ inhibitor KBR-7943 is similar to the effect produced by KBR-7943 alone (Fig. 4B). Thus, ziram can inhibit NCX3 activity in its Ca2+ entry mode of exchange (reverse mode). No Ca2+ influx was observed in BHK-WT cells that do not express any sodium-calcium exchanger.
Increased mitochondrial dysfunction, intracellular Ca2+ level and ATP depletion in ziram-treated BHK-NCX3 cells
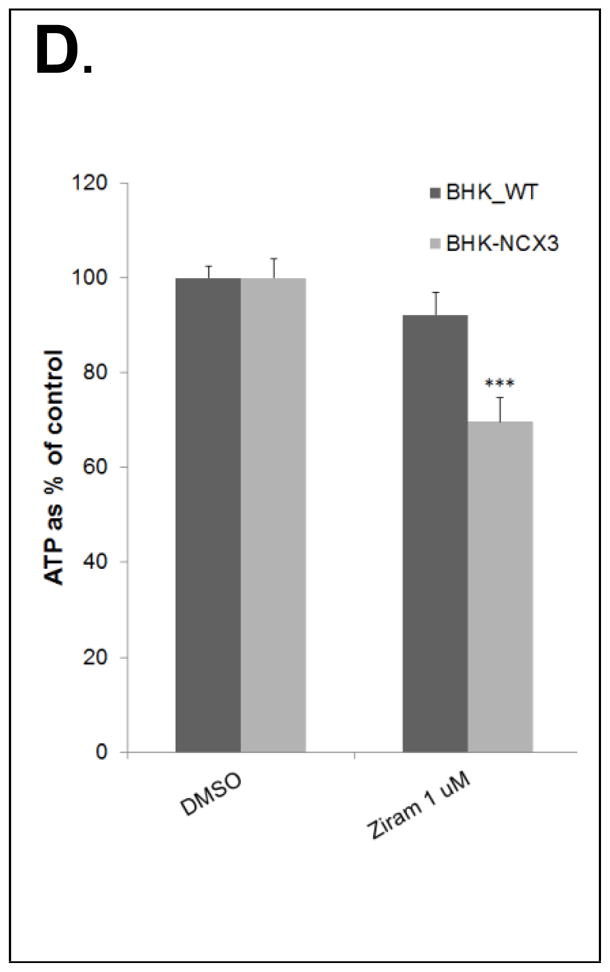
Since mitochondria contribute to Ca2+ homeostasis, we examined mitochondrial function, [Ca2+i] and ATP content in BHK-WT and BHK-NCX3 following ziram treatment (Fig. 5A–D).
Figure 5.
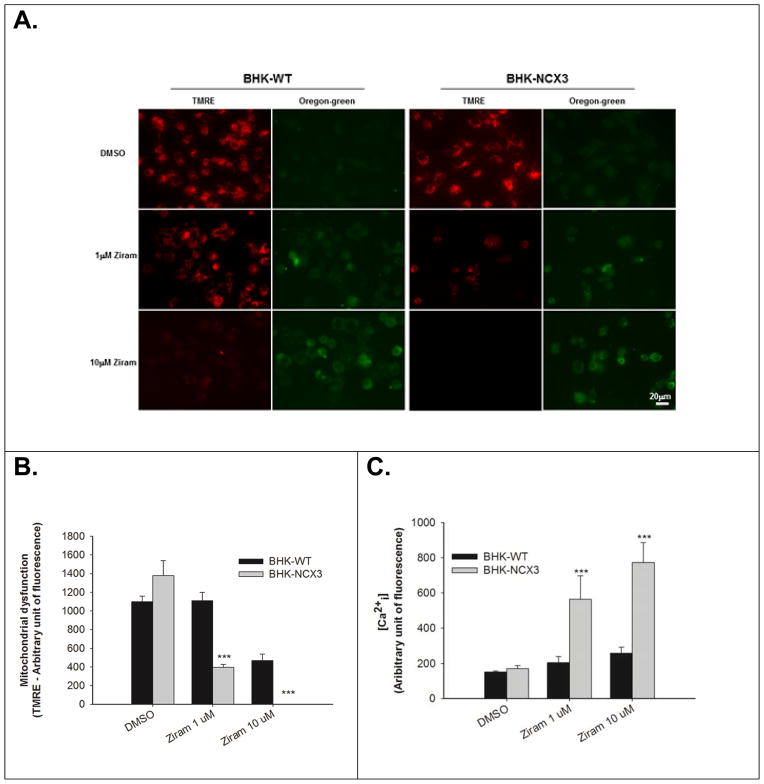
Effect of ziram treatment on mitochondrial membrane potential and intracellular Ca2+ levels in BHK-WT and in BHK-NCX3 cells. (A) Representative confocal images of BHK-WT and BHK-NCX3 cells double stained with 20 nM TMRE and 5 μM Oregon Green BAPTA-1 after 24 h treatment with 0.1 μM DMSO (top panels of each experimental group) or 1 μM ziram (middle panels of each experimental group) and after 2 h treatment with 10 μM ziram (bottom panels of each experimental group).
(B) Quantification of mitochondrial dysfunction expressed as TMRE arbitrary units in control conditions (DMSO-24 h), after 24 h with 1μM ziram or 2 h with 10 μM ziram in BHK-WT (black bars) and BHK-NCX3 (gray bars) cells. **P < 0.001 vs. untreated BHK-WT. Each bar represents the mean (± S.E.M.) of at least 60 different experimental values studied in three independent experimental sessions. (C) Quantification of Ca2+ levels measured with Oregon Green BAPTA-1 and expressed as arbitrary units in control conditions, after 24 h of 1 μM ziram and 2 h of μM or 10 μM ziram in BHK-WT (black bars) and BHK-NCX3 (gray bars) cells. ***P < 0.001 vs. untreated BHK-WT. Each bar represents the mean (±S.E.M.) of at least 60 different experimental values studied in three independent experimental sessions. (D) Effect of ziram treatment on ATP content in BHK-WT and in BHK-NCX3 cells. The bar graph represents the ATP content measured after 24 h with 1 μM ziram in BHK-WT and BHK-NCX3 cells. *P < 0.05, **P < 0.01 vs. untreated BHK-WT. Each bar represents the mean (±S.E.M.) of three independent experimental sessions.
At 1 and 10 μM, ziram has a greater effect on mitochondrial dysfunction in BHK-NCX3 cells compared to BHK-WT cells (F2, 117 = 26.16, P < 0.001). As illustrated in Fig. 5A–B, there was a threefold reduction of the TMRE signal in BHK-NCX3 cells (395 ± 31) following treatment for 24 h with 1 μM ziram compared to BHK-WT (1111 ± 90; P < 0.001). The TMRE signal was totally abolished in BHK-NCX3 cells treated for 2 h with 10 μM ziram.
Ziram also induced a more profound Ca2+ dysregulation in BHK-NCX3 cells compared to BHK-WT cells (F2, 58 = 12.76, P < 0.001). As illustrated in Fig. 5A&C, Oregon-green signal was about three times higher than in BHK-WT following 24 h exposure with 1 μM (563 ± 134 vs. 204 ± 34 in BHK-NCX3 and BHK-WT cells respectively; P < 0.001) and following 2 h exposure 10 μM ziram (773 ± 114 vs. 256 ± 34 in BHK-NCX3 and BHK-WT cells respectively; P < 0.001).
Ziram furthermore generated a greater ATP depletion in BHK-NCX3 cells compared to BHK-WT cells (F1, 8 = 24.12, P < 0.001). As illustrated in Fig. 5D, following 24 h exposure with 1 μM ziram treatment, ATP content was significantly reduced in BHK-NCX3 cells (68 ± 3% ATP relative to DMSO control) compared to BHK-WT cells (92 ± 5% ATP content relative to DMSO control; P < 0.001]. No difference in ATP content was observed following 2 h exposure with 10 μM ziram treatment (data not shown). The discrepancies between the ATP and TMRE results after 2 h treatment with 10 μM ziram can be expected by the cells bioenergetics and their ability to produce the necessary ATP for their survival following mitochondrial stress (Dott et al., 2014).
Protective effect of NCX3 genetic deletion against ziram induced dopaminergic toxicity in Primary VMC
Because ziram was previously reported to induce selective DA neuron loss in vitro and is an environmental toxicant linked to PD (Chou, 2008), we next examined the role of NCX3 in ziram neurotoxicity using PVMC neurons. This cellular model is complementary to the BHK-cellular approach. Indeed, BHK-WT cells do not constitutively expressed any NCX isoform, BHK-NCX3 cells are genetic engineered cells to solely expressed NCX3-specific brain isoform whereas wild-type VMC neurons express NCX1, NCX2 and NCX3 isoforms (Canitano, 2002, Linck, 1998, Minelli, 2007, Nicoll, 1996, Sokolow, 2011). Due to the lack of selective NCX3 inhibitor, we opted to investigate the role of ziram induced DA toxicity in VMC neurons isolated from NCX3 knock-out mice (Molinaro, 2008, Molinaro, 2011, Pannaccione, 2012, Sokolow, 2004).
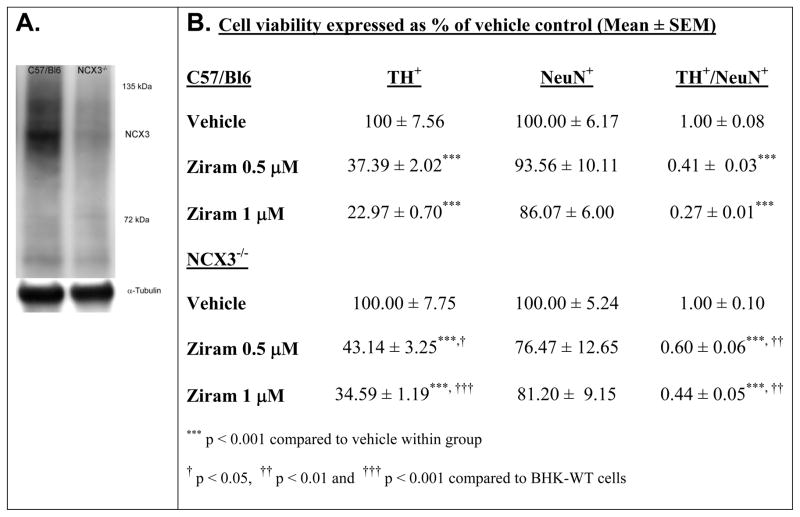
First, NCX3 expression in wild-type mice (i.e. C57/Bl6) was assessed by immunoblotting in brainstem homogenate of C57/Bl6 and NCX3−/− mice (Fig. 6A).
Figure 6.
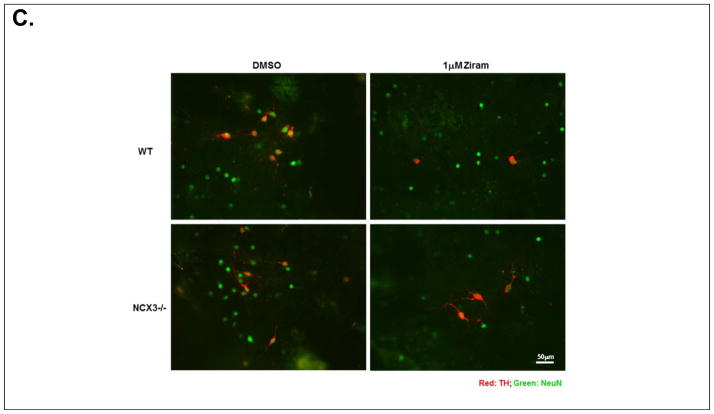
Ziram-induced neurotoxicity in primary mesencephalic cultures. (A) Immunoblots showing that NCX3 is expressed in wild-type brainstem (C57/Bl6) and absent in NCX3−/− homogenate. Loading control detected with α-tubulin is shown. (B) TH and NeuN cell viability was normalized to the condition in DMSO (i.e. vehicle control) for each independent cell culture and expressed as % of vehicle control. TH+/NeuN+ was calculated as the ratio of TH+ to NeuN+ cell viability normalized to vehicle control. (C) Representative photomicrographs of TH- (red) and NeuN-stained (green) mesencephalic cultures isolated from C57/Bl6 (top panels) and NCX3−/− (bottom panels) mice. Left panels: control treatment. Right panels: ziram 1 μM. Ziram-induced TH cell damage was quantified by TH+/NeuN+ immunohistochemistry. A minimum of 4 coverslips were analyzed for each treatment in three independent experiments.
Next, PVMC isolated from C57/Bl6 and NCX3−/− mice were then treated for 24 h with 0.5 – 1 μM ziram at 7 DIV (Chou, 2008). Surviving TH immuno-positive (TH+) neurons and NeuN immuno-positive (NeuN+) neurons were counted following ziram exposure for 24 h. Cell viability was normalized to the treatment with DMSO (i.e. vehicle control). Two-way ANOVA revealed a significant treatment × genotype interaction on TH+ cell viability following ziram treatment [F2, 12 = 6.12, P = 0.015] (Fig. 6B). A neuroprotective effect against ziram-induced toxicity was detected in TH+ NCX3−/− neurons (43.1 ± 3.3 % of normalized cell viability) compared to TH+ C57/Bl6 neurons treated with 0.5 μM ziram (37.4 ± 2.0 % of normalized cell viability; P < 0.05). The neuroprotective effect was dose dependent in that it was less pronounced at 0.5 μM than at 1 μM: 34.6 ± 1.2 % of normalized TH+ NCX3−/− cell viability compared to 23.0 ± 0.7 % of normalized TH+ C57/Bl6 cell viability (P < 0.001) (Fig. 6B–C). The only partial neuroprotection observed in TH+ NCX3−/− neurons may be due to the fact that ziram damages are not solely due to an effect of ziram on NCX3 but instead they are associated with different pathways (e.g. E1 and aldehyde dehydrogenase inhibition, and nonselective cation channel stimulation) (Chou, 2008, Fitzmaurice et al., 2014, Sook Han, 2003).
A trend towards decreased NeuN+ cell viability (P > 0.05) was observed in C57/Bl6 and NCX3−/− neurons following treatment with 0.5 – 1 μM ziram. (Fig. 6B–C). The selective loss of TH+ neurons that we observed confirmed the results of Chou et al. who also determined that the loss of TH+ neurons reflects neuronal death and not just the loss of expression (Chou, 2008).
Discussion
Using BHK cells expressing brain specific NCX3 isoform and neurons isolated from NCX3-null mutant mice, we demonstrate that NCX3 plays an important role in ziram-induced toxicity. Our findings reveal that NCX3 expression aggravated ziram induced toxicity in BHK cells and genetic deletion was neuroprotective against ziram-induced DA neuron loss. BHK-NCX3 cells treated with ziram showed significant Ca2+ dysregulation, mitochondrial dysfunction, ATP depletion and cell death compared to BHK-WT. We also report that fewer TH+ neurons were lost in NCX3−/− primary brainstem cultures exposed to ziram compared to neurons obtained from wild-type mice. Furthermore, more TH+ than TH− neurons were lost, underscoring the particular vulnerability of TH+ neurons to ziram insults.
In the current study, we made four important discoveries. First, we established that ziram can inhibit NCX3 activity in its Ca2+ exit mode (forward mode) and in its Ca2+ entry mode (reverse mode). Since ziram is a zinc (Zn) salt of dimethylthiocarbamate, it is possible that Zn2+ ions contribute to ziram-induced inhibitory effect of NCX3. Indeed, Colvin et al. previously reported that Zn2+ is a competitive inhibitor of the sodium-calcium exchanger in plasma membrane vesicle and cortical neurons (Colvin, 1998). However, they showed that the constant of inhibition (Ki) of the sodium-calcium exchanger was ~ 14 μM of Zn2+ in their experimental conditions. Since, ziram was able to cause Ca2+ imbalances in BHK-NCX3 cells at a concentration of 1 μM, it is unlikely that Zn2+ ions are primarily responsible for the direct inhibition of NCX3.
Second, we showed that following ziram treatment, the inhibition of NCX3 in its forward mode led to an increase of [Ca2+i] and ultimately cell death. In normal Krebs solution (Ca2+ exit mode of exchange), the concomitant use of ziram and the NCX3 inhibitor, KBR-7943, did not revert ziram-induced [Ca2+i] elevation but further increased it in our experimental model (Fig. 4A). We can speculate that the observed potentiation with KBBR-7943 was caused by its fair specificity for the NCX3 reverse mode of action (Ca2+ entry mode of exchange) and its ability to inhibit the complex I in the mitochondrial respiratory chain (Brustovetsky et al., 2011). This speculation is supported by our observation in Na+-free buffer, where NCX3 activity in its reverse mode of action is totally abolished by the addition of ziram and/or the inhibitor KB-7943.
Third, we found that impairment of Ca2+ buffering in BHK-NCX3 cells is initiated by ziram treatment. Mitochondrial dysfunction and limited ATP production were also observed and likely contributed to the compromised BHK-NCX3 cell survival following ziram exposure. It is unclear at this point to what extent the mitochondrial dysfunction and the decreased ATP production are a consequence of NCX3 inhibition by ziram and to what extent they indicate additional targets. Because mitochondria play a major role in sequestration of Ca2+ and since Ca2+ is a positive effector of mitochondrial function, any perturbation in mitochondrial and/or cytosolic Ca2+ homeostasis have major consequences to cell function. It is plausible that ziram induces a positive-feedback loop between mitochondrial dysfunction and cytoplasmic Ca2+ dysregulation. Further studies are needed to elucidate the exact sequence of events between mitochondrial and Ca2+ pathways of ziram cytotoxicity.
Lastly, our study using NCX3−/− primary brain stem cultures treated with ziram revealed that NCX3 genetic deletion was protective against ziram-induced DA neuron death. Chou et al. previously reported that selective DA neuron loss in ventral mesencephalic cultures (VMC) occurs through the inhibition of E1 ubiquitin-activating enzyme of the ubiquitin-proteasome system (UPS) (Chou, 2008). Based on the fact that E1 inhibition by ziram occurs within seconds, it is possible that ziram-induced inhibition of E1 precedes the inhibition of NCX3. In addition, ziram is also a potent inhibitor of aldehyde dehydrogenase (ALDH), an enzyme involved the detoxification of DA metabolite, 3,4-dihydroxyphenylacetaldehyde (DOPAL) (Fitzmaurice, 2014, Fitzmaurice et al., 2013). Of a note, ambient exposure to neuronal ALDH-inhibiting pesticides (e.g. ziram, zineb) is associated with 2- to 6-fold increases in PD risk (Fitzmaurice, 2014). Further examinations are needed to determine whether the cascade of events involving E1, ALDH and NCX3 is sequential, synergistic or independent and to explain why neurons lacking NCX3 are not completely protected from ziram-induced damage.
Mechanisms by which pesticides cause intracellular Ca2+ dysregulation, dopaminergic dysfunction and increased PD occurrence are not understood (Hornykiewicz, 1966, Riederer and Wuketich, 1976, Surmeier, 2007, Surmeier et al., 2010, Surmeier et al., 2011). More work is needed to determine the precise sequence of events linking ziram-induced inhibition of E1 ligase and ALDH, Ca2+ dyshomeostasis and DA neuron loss in cellular and animal models of PD. However, our study now provides a new possible pathway by which DA neurodegeneration may occur following ziram exposure.
Another question that arises from our work is whether the role of NCX3 depends on the context. For example, NCX3 is neuroprotective against ischemia-induced injuries (Jeffs et al., 2008, Molinaro et al., 2008). The protective role of NCX3 in ischemic lesions depends on the overload of intracellular [Na+] which forces NCX3 to work on reverse mode. On the other hand, NCX3 is toxic in xenobiotic induced injuries (e.g. ziram and MPTP), particularly in DA neurons. The accumulation and removal of intracellular Ca2+ is particularly important in DA neurons as they continuously fire action potentials which is believed to be important in maintaining DA levels in the striatum, but also leads to a chronic calcium load larger than in more silent neurons. Inhibition of NCX3 by ziram and potentially other xenobiotics binding sites thus leads to Ca2+ dyshomeostasis and DA neurotoxicity. In conclusion, our findings provide evidence that NCX3 contributes to ziram toxicity and point to NCX3 inhibition as a new target to slow down ziram-induced DA neurodegeneration and potentially DA neuron loss in PD pathogenesis.
Acknowledgments
This work was supported by grants from the NIH (NIEHS P01ES016732 pilot grant to S.S. and NIH/NINDS R21 NS075506 to F.E.S.), UCLA school of Nursing intramural funding to S.S and National Natural Science Foundation of China (81171199) to J.J. Flow cytometry was performed in the UCLA Jonsson Comprehensive Cancer Center (JCCC) and Center for AIDS Research Flow Cytometry Core Facility that is supported by National Institutes of Health awards CA-16042 and AI-28697, and by the JCCC, the UCLA AIDS Institute, and the David Geffen School of Medicine at UCLA. Optic microscopy was performed at the UCLA Intellectual and Developmental Disabilities Research Center (IDDRC) Cellular Imaging Core.
Footnotes
Conflict of Interest Statement
The authors have nothing to disclose.
Publisher's Disclaimer: This is a PDF file of an unedited manuscript that has been accepted for publication. As a service to our customers we are providing this early version of the manuscript. The manuscript will undergo copyediting, typesetting, and review of the resulting proof before it is published in its final citable form. Please note that during the production process errors may be discovered which could affect the content, and all legal disclaimers that apply to the journal pertain.
References
- Ago Y, Kawasaki T, Nashida T, Ota Y, Cong Y, Kitamoto M, et al. SEA0400, a specific Na+/Ca2+ exchange inhibitor, prevents dopaminergic neurotoxicity in an MPTP mouse model of Parkinson’s disease. Neuropharmacology. 2011;61:1441–51. doi: 10.1016/j.neuropharm.2011.08.041. [DOI] [PubMed] [Google Scholar]
- Bano D, Young KW, Guerin CJ, Lefeuvre R, Rothwell NJ, Naldini L, et al. Cleavage of the plasma membrane Na+/Ca2+ exchanger in excitotoxicity. Cell. 2005;120:275–85. doi: 10.1016/j.cell.2004.11.049. [DOI] [PubMed] [Google Scholar]
- Blaustein MP, Lederer WJ. Sodium/calcium exchange: its physiological implications. Physiol Rev. 1999;79:763–854. doi: 10.1152/physrev.1999.79.3.763. [DOI] [PubMed] [Google Scholar]
- Boscia F, D’Avanzo C, Pannaccione A, Secondo A, Casamassa A, Formisano L, et al. Silencing or knocking out the Na+/Ca2+ exchanger-3 (NCX3) impairs oligodendrocyte differentiation. Cell Death Differ. 2013;20:184. doi: 10.1038/cdd.2011.125. [DOI] [PMC free article] [PubMed] [Google Scholar]
- Brustovetsky T, Brittain MK, Sheets PL, Cummins TR, Pinelis V, Brustovetsky N. KB-R7943, an inhibitor of the reverse Na+ /Ca2+ exchanger, blocks N-methyl-D-aspartate receptor and inhibits mitochondrial complex I. Br J Pharmacol. 2011;162:255–70. doi: 10.1111/j.1476-5381.2010.01054.x. [DOI] [PMC free article] [PubMed] [Google Scholar]
- Canitano A, Papa M, Boscia F, Castaldo P, Sellitti S, Taglialatela M, et al. Brain distribution of the Na+/Ca2+ exchanger-encoding genes NCX1, NCX2, and NCX3 and their related proteins in the central nervous system. Ann N Y Acad Sci. 2002;976:394–404. doi: 10.1111/j.1749-6632.2002.tb04766.x. [DOI] [PubMed] [Google Scholar]
- Choi W-S, Klintworth H, Xia Z. JNK3-Mediated Apoptotic Cell Death in Primary Dopaminergic Neurons. In: Costa LG, Giordano G, Guizzetti M, editors. In Vitro Neurotoxicology. Humana Press; 2011. pp. 279–92. [DOI] [PMC free article] [PubMed] [Google Scholar]
- Chou AP, Maidment N, Klintenberg R, Casida JE, Li S, Fitzmaurice AG, et al. Ziram causes dopaminergic cell damage by inhibiting E1 ligase of the proteasome. J Biol Chem. 2008;283:34696–703. doi: 10.1074/jbc.M802210200. [DOI] [PMC free article] [PubMed] [Google Scholar]
- Colvin RA. Zinc inhibits Ca2+ transport by rat brain NA+/Ca2+ exchanger. Neuroreport. 1998;9:3091–6. doi: 10.1097/00001756-199809140-00032. [DOI] [PubMed] [Google Scholar]
- Cross JL, Meloni BP, Bakker A, Sokolow S, Herchuelz A, Schurmans S, et al. Neuronal injury in NCX3 knockout mice following permanent focal cerebral ischemia and in NCX3 knockout cortical neuronal cultures following oxygen-glucose deprivation and glutamate exposure. J Exp Stroke & Transl Med. 2009:2. http://www.aestm.com/neuronal-injury-in-ncx3-knockout-mice-following-permanent-focal-cerebral-ischemia-and-in-ncx3-knockout-cortical-neuronal-cultures-following-oxygen-glucose-deprivation-and-glutamate-exposure-abstra/
- Dott W, Mistry P, Wright J, Cain K, Herbert KE. Modulation of mitochondrial bioenergetics in a skeletal muscle cell line model of mitochondrial toxicity. Redox Biology. 2014;2:224–33. doi: 10.1016/j.redox.2013.12.028. http://dx.doi.org/10.1016/j.redox.2013.12.028. [DOI] [PMC free article] [PubMed] [Google Scholar]
- Fang Y, Condrescu M, Reeves JP. Regulation of Na+/Ca2+ exchange activity by cytosolic Ca2+ in transfected Chinese hamster ovary cells. Am J Physiol. 1998;275:C50–5. doi: 10.1152/ajpcell.1998.275.1.C50. [DOI] [PubMed] [Google Scholar]
- Fitzmaurice AG, Rhodes SL, Cockburn M, Ritz B, Bronstein JM. Aldehyde dehydrogenase variation enhances effect of pesticides associated with Parkinson disease. Neurology. 2014;82:419–26. doi: 10.1212/WNL.0000000000000083. [DOI] [PMC free article] [PubMed] [Google Scholar]
- Fitzmaurice AG, Rhodes SL, Lulla A, Murphy NP, Lam HA, O’Donnell KC, et al. Aldehyde dehydrogenase inhibition as a pathogenic mechanism in Parkinson disease. Proc Natl Acad Sci U S A. 2013;110:636–41. doi: 10.1073/pnas.1220399110. [DOI] [PMC free article] [PubMed] [Google Scholar]
- Fontana G, Rogowski RS, Blaustein MP. Kinetic properties of the sodium-calcium exchanger in rat brain synaptosomes. J Physiol. 1995;485 ( Pt 2):349–64. doi: 10.1113/jphysiol.1995.sp020734. [DOI] [PMC free article] [PubMed] [Google Scholar]
- Hilge M. Ca2+ regulation of ion transport in the Na+/Ca2+ exchanger. J Biol Chem. 2012;287:31641–9. doi: 10.1074/jbc.R112.353573. [DOI] [PMC free article] [PubMed] [Google Scholar]
- Hornykiewicz O. Dopamine (3-hydroxytyramine) and brain function. Pharmacol Rev. 1966;18:925–64. [PubMed] [Google Scholar]
- Jeffs GJ, Meloni BP, Sokolow S, Herchuelz A, Schurmans S, Knuckey NW. NCX3 knockout mice exhibit increased hippocampal CA1 and CA2 neuronal damage compared to wild-type mice following global cerebral ischemia. Exp Neurol. 2008;210:268–73. doi: 10.1016/j.expneurol.2007.10.013. [DOI] [PubMed] [Google Scholar]
- Jeon D, Yang YM, Jeong MJ, Philipson KD, Rhim H, Shin HS. Enhanced learning and memory in mice lacking Na+/Ca2+ exchanger 2. Neuron. 2003;38:965–76. doi: 10.1016/s0896-6273(03)00334-9. [DOI] [PubMed] [Google Scholar]
- Linck B, Qiu Z, He Z, Tong Q, Hilgemann DW, Philipson KD. Functional comparison of the three isoforms of the Na+/Ca2+ exchanger (NCX1, NCX2, NCX3) Am J Physiol. 1998;274:C415–23. doi: 10.1152/ajpcell.1998.274.2.C415. [DOI] [PubMed] [Google Scholar]
- Minelli A, Castaldo P, Gobbi P, Salucci S, Magi S, Amoroso S. Cellular and subcellular localization of Na+-Ca2+ exchanger protein isoforms, NCX1, NCX2, and NCX3 in cerebral cortex and hippocampus of adult rat. Cell Calcium. 2007;41:221–34. doi: 10.1016/j.ceca.2006.06.004. [DOI] [PubMed] [Google Scholar]
- Molinaro P, Cataldi M, Cuomo O, Viggiano D, Pignataro G, Sirabella R, et al. Genetically Modified Mice as a Strategy to Unravel the Role Played by the Na+/Ca2+ Exchanger in Brain Ischemia and in Spatial Learning and Memory Deficits. In: Annunziato L, editor. Sodium Calcium Exchange: A Growing Spectrum of Pathophysiological Implications. Springer US; 2013. pp. 213–22. [DOI] [PubMed] [Google Scholar]
- Molinaro P, Cuomo O, Pignataro G, Boscia F, Sirabella R, Pannaccione A, et al. Targeted disruption of Na+/Ca2+ exchanger 3 (NCX3) gene leads to a worsening of ischemic brain damage. J Neurosci. 2008;28:1179–84. doi: 10.1523/JNEUROSCI.4671-07.2008. [DOI] [PMC free article] [PubMed] [Google Scholar]
- Molinaro P, Viggiano D, Nistico R, Sirabella R, Secondo A, Boscia F, et al. Na+-Ca2+ exchanger (NCX3) knock-out mice display an impairment in hippocampal long-term potentiation and spatial learning and memory. J Neurosci. 2011;31:7312–21. doi: 10.1523/JNEUROSCI.6296-10.2011. [DOI] [PMC free article] [PubMed] [Google Scholar]
- Morimoto N, Kita S, Shimazawa M, Namimatsu H, Tsuruma K, Hayakawa K, et al. Preferential involvement of Na+/Ca2+ exchanger type-1 in the brain damage caused by transient focal cerebral ischemia in mice. Biochemical and Biophysical Research Communications. 2012;429:186–90. doi: 10.1016/j.bbrc.2012.10.114. http://dx.doi.org/10.1016/j.bbrc.2012.10.114. [DOI] [PubMed] [Google Scholar]
- Nguidjoe E, Sokolow S, Bigabwa S, Pachera N, D’Amico E, Allagnat F, et al. Heterozygous inactivation of the Na/Ca exchanger increases glucose-induced insulin release, beta-cell proliferation, and mass. Diabetes. 2011;60:2076–85. doi: 10.2337/db10-0924. [DOI] [PMC free article] [PubMed] [Google Scholar]
- Nicoll DA, Quednau BD, Qui Z, Xia YR, Lusis AJ, Philipson KD. Cloning of a third mammalian Na+-Ca2+ exchanger, NCX3. J Biol Chem. 1996;271:24914–21. doi: 10.1074/jbc.271.40.24914. [DOI] [PubMed] [Google Scholar]
- Pannaccione A, Secondo A, Molinaro P, D’Avanzo C, Cantile M, Esposito A, et al. A new concept: Abeta1-42 generates a hyperfunctional proteolytic NCX3 fragment that delays caspase-12 activation and neuronal death. J Neurosci. 2012;32:10609–17. doi: 10.1523/JNEUROSCI.6429-11.2012. [DOI] [PMC free article] [PubMed] [Google Scholar]
- Pignataro G, Boscia F, Esposito E, Sirabella R, Cuomo O, Vinciguerra A, et al. NCX1 and NCX3: Two new effectors of delayed preconditioning in brain ischemia. Neurobiology of Disease. 2012;45:616–23. doi: 10.1016/j.nbd.2011.10.007. http://dx.doi.org/10.1016/j.nbd.2011.10.007. [DOI] [PubMed] [Google Scholar]
- Pignataro G, Cuomo O, Vinciguerra A, Sirabella R, Esposito E, Boscia F, et al. NCX as a Key Player in the Neuroprotection Exerted by Ischemic Preconditioning and Postconditioning. In: Annunziato L, editor. Sodium Calcium Exchange: A Growing Spectrum of Pathophysiological Implications. Springer US; 2013. pp. 223–40. [DOI] [PubMed] [Google Scholar]
- Quednau BD, Nicoll DA, Philipson KD. Tissue specificity and alternative splicing of the Na+/Ca2+ exchanger isoforms NCX1, NCX2, and NCX3 in rat. Am J Physiol. 1997;272:C1250–61. doi: 10.1152/ajpcell.1997.272.4.C1250. [DOI] [PubMed] [Google Scholar]
- Riederer P, Wuketich S. Time course of nigrostriatal degeneration in parkinson’s disease. A detailed study of influential factors in human brain amine analysis. J Neural Transm. 1976;38:277–301. doi: 10.1007/BF01249445. [DOI] [PubMed] [Google Scholar]
- Rinetti GV, Schweizer FE. Ubiquitination acutely regulates presynaptic neurotransmitter release in mammalian neurons. J Neurosci. 2010;30:3157–66. doi: 10.1523/jneurosci.3712-09.2010. [DOI] [PMC free article] [PubMed] [Google Scholar]
- Sanchez-Armass S, Blaustein MP. Role of sodium-calcium exchange in regulation of intracellular calcium in nerve terminals. Am J Physiol. 1987;252:C595–603. doi: 10.1152/ajpcell.1987.252.6.C595. [DOI] [PubMed] [Google Scholar]
- Schneider CA, Rasband WS, Eliceiri KW. NIH Image to ImageJ: 25 years of image analysis. Nat Methods. 2012;9:671–5. doi: 10.1038/nmeth.2089. [DOI] [PMC free article] [PubMed] [Google Scholar]
- Sisalli MJ, Secondo A, Esposito A, Valsecchi V, Savoia C, Di Renzo GF, et al. Endoplasmic reticulum refilling and mitochondrial calcium extrusion promoted in neurons by NCX1 and NCX3 in ischemic preconditioning are determinant for neuroprotection. Cell Death Differ. 2014;21:1142–9. doi: 10.1038/cdd.2014.32. [DOI] [PMC free article] [PubMed] [Google Scholar]
- Sokolow S, Luu SH, Headley AJ, Hanson AY, Kim T, Miller CA, et al. High levels of synaptosomal Na(+)-Ca(2+) exchangers (NCX1, NCX2, NCX3) co-localized with amyloid-beta in human cerebral cortex affected by Alzheimer’s disease. Cell Calcium. 2011;49:208–16. doi: 10.1016/j.ceca.2010.12.008. [DOI] [PMC free article] [PubMed] [Google Scholar]
- Sokolow S, Manto M, Gailly P, Molgo J, Vandebrouck C, Vanderwinden JM, et al. Impaired neuromuscular transmission and skeletal muscle fiber necrosis in mice lacking Na/Ca exchanger 3. J Clin Invest. 2004;113:265–73. doi: 10.1172/JCI18688. [DOI] [PMC free article] [PubMed] [Google Scholar]
- Sook Han M, Shin KJ, Kim YH, Kim SH, Lee T, Kim E, et al. Thiram and ziram stimulate non-selective cation channel and induce apoptosis in PC12 cells. Neurotoxicology. 2003;24:425–34. doi: 10.1016/S0161-813X(03)00013-5. [DOI] [PubMed] [Google Scholar]
- Surmeier DJ. Calcium, ageing, and neuronal vulnerability in Parkinson’s disease. Lancet Neurol. 2007;6:933–8. doi: 10.1016/S1474-4422(07)70246-6. [DOI] [PubMed] [Google Scholar]
- Surmeier DJ, Guzman JN, Sanchez-Padilla J. Calcium, cellular aging, and selective neuronal vulnerability in Parkinson’s disease. Cell Calcium. 2010;47:175–82. doi: 10.1016/j.ceca.2009.12.003. [DOI] [PMC free article] [PubMed] [Google Scholar]
- Surmeier DJ, Guzman JN, Sanchez-Padilla J, Schumacker PT. The role of calcium and mitochondrial oxidant stress in the loss of substantia nigra pars compacta dopaminergic neurons in Parkinson’s disease. Neuroscience. 2011;198:221–31. doi: 10.1016/j.neuroscience.2011.08.045. http://dx.doi.org/10.1016/j.neuroscience.2011.08.045. [DOI] [PMC free article] [PubMed] [Google Scholar]
- Thurneysen T, Nicoll DA, Philipson KD, Porzig H. Sodium/calcium exchanger subtypes NCX1, NCX2 and NCX3 show cell-specific expression in rat hippocampus cultures. Brain Res Mol Brain Res. 2002;107:145–56. doi: 10.1016/s0169-328x(02)00461-8. S0169328X02004618 [pii] [DOI] [PubMed] [Google Scholar]
- Wakimoto K, Fujimura H, Iwamoto T, Oka T, Kobayashi K, Kita S, et al. Na+/Ca2+ exchanger-deficient mice have disorganized myofibrils and swollen mitochondria in cardiomyocytes. Comparative Biochemistry and Physiology B-Biochemistry & Molecular Biology. 2003;135:9–15. doi: 10.1016/S1096-4959(03)00057-5. [DOI] [PubMed] [Google Scholar]
- Wang A, Costello S, Cockburn M, Zhang X, Bronstein J, Ritz B. Parkinson’s disease risk from ambient exposure to pesticides. Eur J Epidemiol. 2011;26:547–55. doi: 10.1007/s10654-011-9574-5. [DOI] [PMC free article] [PubMed] [Google Scholar]


