

Abstract
Objective
Prognosis in pulmonary hypertension is largely determined by right ventricular (RV) function. However, uncertainty remains about what metrics of RV function might be most clinically relevant. The purpose of this study was to assess the clinical relevance of metrics of RV functional adaptation to increased afterload.
Methods
Patients referred for pulmonary hypertension (PH) underwent right heart catheterization and RV volumetric assessment within 48 hours. A RV maximum pressure (Pmax) was calculated from the RV pressure curve. The adequacy of RV systolic functional adaptation to increased afterload was estimated either by a stroke volume (SV)/end-systolic volume (ESV) ratio, a Pmax/ mean pulmonary artery pressure (mPAP) ratio, or by ejection fraction (RVEF). Diastolic function of the RV was estimated by a diastolic elastance coefficient β. Survival analysis was via Cox proportional hazard ratio and Kaplan-Meier with the primary outcome of time to death or lung transplant.
Results
Patients (n=50; age 58±13) covered a range of mPAP (13–79 mmHg) with an average RVEF of 39±17% and ESV of 143±89 ml. Average estimates of the ratio of end-systolic ventricular to arterial elastance were 0.79±0.67 (SV/ESV) and 2.3±0.65 (Pmax/mPAP-1). Transplantation-free survival was predicted by right atrial pressure, mPAP, pulmonary vascular resistance, β, SV, ESV, SV/ESV, and RVEF but after controlling for right atrial pressure, mPAP, and SV, SV/ESV was the only independent predictor.
Conclusions
The adequacy of RV functional adaptation to afterload predicts survival in patients referred for pulmonary hypertension. Whether this can simply be evaluated using RV volumetric imaging will require additional confirmation.
Keywords: pulmonary hypertension, heart failure, right ventricle, pressure-volume loops, CT imaging
BACKGROUND
It has been better appreciated in recent years that right ventricular (RV) function is a major determinant of functional state, exercise capacity and survival in patients with severe pulmonary hypertension (PH) [1,2]. However, how to measure RV function and what parameters might be most clinically relevant remains debated [2].
The normal RV is a thin-walled crescent shape flow generator unable to cope with brisk increases in pulmonary artery pressures (PAP). However, in the presence of chronically increased PAP, the RV adapts by a progressive increase in contractility allowing for maintained output. When eventually this “homeometric adaptation” fails, filling pressures and dimensions of the RV increase, resulting in maintenance of flow output through a “heterometric adaptation” as described by Starling’s law of the heart. Therefore, gold standard measurements of RV function in patients with PH necessarily include estimations of contractility and afterload.
RV contractility is quantified by maximum elastance, or the maximum value of RV pressure-volume relationships, usually estimated by an end-systolic elastance (Ees) or ratio of end-systolic pressure (ESP) to end-systolic volume (ESV). An acceptable reference measure for RV afterload is arterial elastance (Ea), or ESP divided by stroke volume (SV). Importantly, the optimal RV-arterial coupling, which allows for flow output at minimal energy cost, corresponds to an Ees/Ea ratio of approximately 1.5–2 [3].
A limited number of studies in patients with severe PH have reported an increase in Ees in proportion to increased pulmonary vascular resistance (PVR) with preserved [4] or decreased [4–7] Ees/Ea. These studies used either single beat or multiple beat measurements of Ees [4–6], or attempted a simplified approach by exclusive volume measurements [7]. Different methods result in variable values for the Ees/Ea ratio. Furthermore, the prognostic relevance of any representation of Ees/Ea as a measure of RV-arterial coupling in patients with or the suspicion of PH has never been studied.
In the present study we evaluated the prognostic impact of different methods to estimate Ees/Ea from right heart catheterization and imaging in patients with a spectrum of severities of PH. Because systolic function impacts on diastolic function [1–3], we also calculated an index of diastolic stiffness β recently shown to be significantly increased in patients with pulmonary arterial hypertension (PAH) [8].
METHODS
Study Setting
Patients referred to the University of Pittsburgh Comprehensive Pulmonary Hypertension Program and undergoing right heart catheterization (RHC) for evaluation of PH gave an informed consent to the study which was approved by the University of Pittsburgh Institutional Review Board. The study was prospective. Inclusion criteria were: 1) age ≥ 18 years; 2) clinically indicated RHC and cardiac imaging (either multislice computed tomography (MSCT) of the chest or cardiac magnetic resonance (CMR) imaging). Exclusion criteria were: 1) INR > 1.6; 2) platelet count < 50,000; 3) unable to lay flat for procedures; 4) known allergy to intravenous contrast; 5) serum creatinine greater than 2.0; 6) known arrhythmia precluding adequate gating for cardiac imaging.
Right ventricular volumetric assessment
RV volume was measured by either CMR (n=6) or gated cardiac MSCT (n = 44). The cardiac MSCT scanning protocol was developed specifically for this study as previously reported [9]. Patients were scanned on a GE Lightspeed 16-slice scanner (n = 13) or GE VCT 64-slice scanner (n=31) (General Electric Healthcare; Milwaukee, WI). Multiplanar reformatted images and 3D and 4D whole heart volume renderings were performed on a free standing workstation (GE ADW version 4.3, GE Healthcare, Milwaukee, Wisconsin). RV function was measured utilizing standard summation of slab volume technique as has been used in evaluating left ventricular volumes. The endoluminal borders of the RV in each slice were manually traced from apex to the tricuspid valve plane in both end-systole and end-diastole. CMR was performed by dedicated CMR technologists with a 1.5T Siemens Magnetom Espree (Siemens Medical Solutions, Erlangen, Germany) and a 32 channel phased array cardiovascular coil. The CMR scans included standard breath held segmented cine imaging with steady state free precession (SSFP) and prospective ECG gating [10]. RV volumes were measured using Simpson’s rule without geometric assumptions from short axis stacks of end diastolic and end systolic cine frames (slices 6 mm thick, 4 mm gap, 30 frames per cardiac cycle) by physicians experienced in CMR [10].
Doppler echocardiography
In a subset of patients, Doppler RV outflow tract flow velocity measurements obtained simultaneously with RHC were sampled for RV-arterial coupling measurements using the single beat approach, as indicated below.
Right Heart Catheterization
RHC was performed within 48 hours of MSCT or CMR using a balloon-tipped thermodilution 7F Swan-Ganz catheter for the measurements of right atrial pressure (RAP), PAP, occluded PAP, RV pressure and cardiac output (CO). Screen captures of the RV pressure tracings stored in the WITT system were later analyzed and semi-automatically re-digitized using a custom program in Matlab [11].
Pressure-volume analysis
To calculate Ees, the single beat method was employed [12]. Briefly, a maximum pressure, RV maximum pressure (Pmax), was calculated from the nonlinear extrapolation of the early systolic and diastolic portions of the RV pressure curve. ESP was approximated by mean PAP (mPAP) [13]. Ees was then calculated as the slope of end-systolic pressure-volume (P-V) relationship: (Pmax − mPAP) divided by SV [14]. Arterial elastance, Ea, was estimated by the ratio of mPAP to SV, assuming RV pressure at end-diastolic volume (EDV) equal to zero [12]. Since the Ees/Ea ratio can be simplified by omitting either mPAP or SV as common terms, Ees/Ea was also estimated by either the ratio of SV/ESV, defined as the “volume method” or (Pmax/mPAP − 1) defined as the “pressure method” (Figure 1). Because the shape of RV pressure-volume loops may suggest that ESP is closer to systolic RV pressure (sRVP) than to mPAP [4], Ees/Ea was also calculated by the pressure method with sRVP instead of mPAP.
Figure 1.
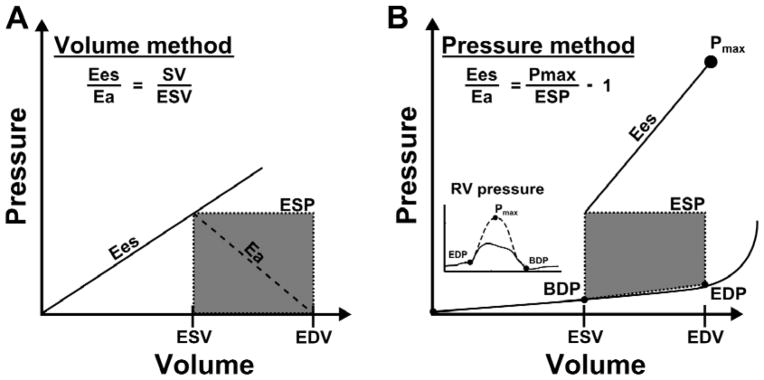
Methods used to estimate right ventriculo (RV)-arterial coupling (Ees/Ea) and diastolic stiffness (β). In both the volume method (Panel A) and the pressure method (Panel B), arterial elastance (Ea) was calculated from the ratio of end-systolic pressure (ESP) to stroke volume (SV). End-systolic elastance (Ees) in the volume method was estimated by the ratio of ESP to end systolic volume (ESV), which results in a simplified Ees/Ea of SV/ESV. In the pressure method, Pmax was estimated from the non-linear extrapolation of the early systolic and diastolic portions of the RV pressure curve. End-systolic elastance was then ratio of (Pmax-mPAP) divided by SV, which results in a simplified Ees/Ea of (Pmax/ESP − 1). Diastolic stiffness, β, was calculated by fitting the non-linear exponential, P = α(eVβ − 1), to pressure and volume measured at the beginning of diastole (BDP: beginning diastolic pressure, ESV) and the end of diastole (EDP: end-diastolic pressure, EDV).
Diastolic stiffness was calculated by fitting a non-linear exponential curve to the diastolic portion of the single-beat pressure-volume loops as recently published [8]. Specifically, the diastolic stiffness β and a curve-fitting parameter α were determined by fitting the non-linear exponential, P = α (eVβ − 1) using three points from the pressure-volume loop (Figure 1). The first point is the pressure at the beginning of diastole following the isovolumetric relaxation when the RV is at the ESV. The second point is at the pressure and volume before the isovolumetric contraction. The third point is assumed to go through the origin (0,0).
All single beat pressure-volume loop analyses of RV systolic and diastolic function were performed in Matlab (Matlab 2013a program The MathWorks, Natick, MA).
Study protocol
All patients had a RHC and either MSCT or CMR imaging within 48 hours. Additionally, the single beat method with Doppler echocardiographic measurement of pulmonary flow was applied in a subset of 3 patients. Instantaneous changes in right ventricular volume were estimated by integration of the volumetric flow rate calculated from the product of the Doppler velocities and the mean cross sectional area of the pulmonary artery determined from thermodilution (where mean cross sectional area = CO/mean velocity). The single beat method allows for the definition of ESP a line drawn from Pmax tangent to the RV pressure-volume loop with relative change in volume calculated from the integration of pulmonary flow [12].
Statistics
Data are expressed as mean ± standard deviation (SD). Statistical significance was defined as two-sided p value <0.05. Primary outcome of survival was defined as freedom from lung transplantation or death. Difference between estimation methods were calculated using a paired Student’s t-test. In order to determine factors prognostic of survival, Cox regression analyses were conducted on the whole population. Univariate (significance set at p < 0.05 cutoff) and multivariate (backward selection set at p < 0.1 cut-off, including all variables having a p-value < 0.1 in the univariate analysis) Cox analyses were employed. Receiver operator characteristic curves (ROC) were plotted for variables significant in the multivariate Cox models to determine area under the curve, specificity and sensitivity of the optimal cut-offs. Optimal cut-offs were defined as the point on the ROC curve nearest the upper left corner of the ROC graph. Kaplan-Meier survival curves were constructed and the log-rank test was used to compare survival in patients stratified by cut-off determined by ROC. Statistical calculations were made using SPSS for Windows (version 20, SPSS, Inc., Chicago, Illinois) or R (R Project for Statistical Computing, http://www.r-project.org/) for the survival analysis.
RESULTS
A total of 50 patients (34 women) were enrolled, aged 58 ± 13 years, with a NYHA functional class of 2.5 ± 0.8 and a distance walked in 6 minutes of 295 ± 125 m. Nine of them had no PH as defined by a mPAP < 25 mmHg. Their mPAP was 17±4 (range: 10–21) mmHg. They had been referred for a suspicion of PH because of unexplained dyspnea and a question of increased maximum velocity of tricuspid regurgitation at Doppler echocardiography. The diagnoses in the remaining 41 patients were idiopathic PAH in 11, connective disease associated PAH in 12, chronic thromboembolic PH in 3, sarcoidosis associated PH in 3, portal hypertension-associated PAH in one, PH secondary to idiopathic lung fibrosis in 7, and left ventricular diastolic dysfunction in 4. Left ventricular ejection fraction was 62 ± 6 %. Treatments of PH consisted in phosphodiesterase-5 inhibitor in 12 patients, endothelin receptor antagonists in 5, Prostacyclins in 5, calcium channel blockers in 11, warfarin in 11, diuretics in 29 and digitalis in 3.
The hemodynamic measurements are summarized in Table 1. There was a wide range of pulmonary hemodynamics and RV adaptation to afterload as assessed by RV ejection fraction (RVEF) and NT-pro-BNP levels.
Table 1.
Right heart catheterization and right ventricular (RV) volumetric measurements.
| Mean ± SD | Range | |
|---|---|---|
| Heart rate (bpm) | 75 ± 13 | 45 – 98 |
| Right atrial pressure (mm Hg) | 9 ± 5 | 0 – 20 |
| Mean pulmonary artery pressure (mmHg) | 40 ± 16 | 10 – 79 |
| Occluded pulmonary artery pressure (mmHg) | 13 ± 5 | 3 – 28 |
| Pulmonary vascular resistance (Wood units) | 6.7 ± 6.3 | 0.6 – 24.9 |
| Cardiac Output (L/min) | 5.2 ± 1.8 | 2.4–9.3 |
| RV End-diastolic volume (mL) | 219 ± 91 | 93 – 630 |
| RV end-systolic volume (mL) | 143 ± 89 | 25 – 540 |
| RV Ejection fraction (%) | 39 ± 17 | 7 – 78 |
| NT pro-BNP | 1030 ± 1870 | 4 – 9863 |
The measurements of Ees and Ea, and Ees/Ea ratio by the volume and the pressure methods are shown in Table 2. Ees was increased but Ees/Ea by either the volume or the pressure method was decreased in proportion to increased PAP (Figure 2). Ees and Ees/Ea were the highest with the mPAP pressure method and lowest with the volume method, with the sRVP pressure method in between (Table 2). The diastolic stiffness coefficient β was increased in proportion to increased Ees (pressure method) and decreased Ees/Ea (SV/ESV) (Figure 3). β was not significantly associated with Ees by volume method (mPAP/ESV; R=0.016; P = 0.91) and Ees/Ea by pressure method (Pmax/mPAP-1; R=0.34; P=0.34).
Table 2.
End-systolic elastance (Ees), arterial elastance (Ea) and Ees/Ea in 50 patients referred for pulmonary hypertension
| Pressure method (ESP = mPAP) | Pressure method (ESP = sRVP) | Volume method | |
|---|---|---|---|
| Ees | 1.38 ± 0.88 | 1.1 ± 0.7* | 0.37 ± 0.33* |
| Ea | 0.64 ± 0.46 | 1.0 ± 0.7* | 0.64 ± 0.46 |
| Ees/Ea | 2.30 ± 0.65 | 1.4 ± 0.88* | 0.79 ± 0.67* |
P < 0.05 compared to Pressure method with ESP = mPAP
Mean ± SD values of Ees calculated as mPAP/ESV, (Pmax-mPAP)/SV, or (Pmax-sRVP)/SV, of Ea calculated as mPAP/SV or sRVP/SV. The right ventriculo (RV)-arterial coupling ratio was reduced to SV/ESV in the volume method and (Pmax/mPAP-1) or (Pmax/sRVP-1) in the pressure methods. The lowest Ees/Ea was calculated with the volume method and the highest with the pressure method (with sRVP to estimate ESP). Abbreviations: ESP: end-systolic pressure; mPAP: mean pulmonary artery pressure; sRVP: peak systolic right ventricular pressure; SV: stroke volume
Figure 2.
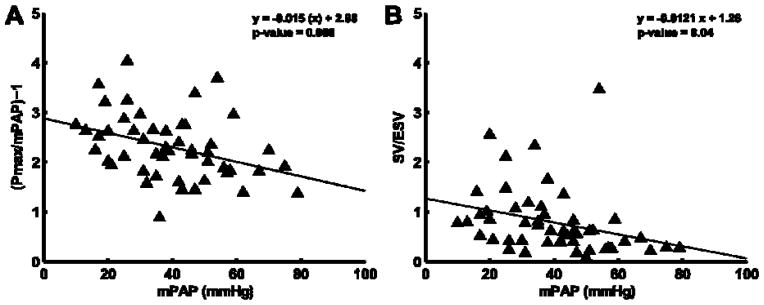
Ratio of Ees/Ea calculated by pressure method (Panel A) or volume method (Panel B) plotted versus mean pulmonary arterial pressure (mPAP). Ees/Ea is greater when calculated by the pressure method than when calculated by the volume measurement, however inverse relationship to mPAP is consistent between methods.
Figure 3.
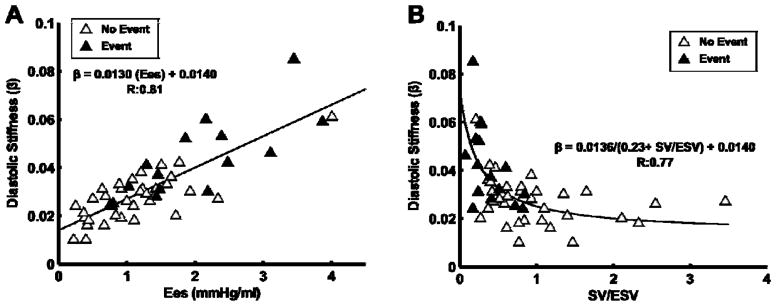
Diastolic stiffness increased linearly with right ventricular (RV) contractility (Panel A). However, there is an inverse relationship between diastolic stiffness and the RV-arterial coupling ratio, stroke volume (SV)/end-systolic volume (ESV).
The average follow-up time was 2.1± 1.9 years with a maximum follow-up of 5.9 years with 16 events (11 deaths and 5 lung transplants). Unadjusted univariate Cox proportional hazards ratio to predict the primary outcome of time to death or lung transplant was performed on the following variables: RAP, mPAP, PVR, SV, ESV, EF, SV/ESV, β and Pmax/mPAP-1. Higher mPAP, PVR, ESV and β, and lower SV, RVEF and Ees/Ea by the volume method (SV/ESV) were all predictive of outcome by univariate Cox proportional hazards ratio (Figure 4) in the entire cohort. Ees/Ea estimated by the pressure method with either mPAP or sRVP to estimate ESP did not predict outcome in the entire cohort. In the multivariate cox model of the entire cohort controlling for RAP, mPAP, and SV, SV/ESV emerged as the only independent predictor of transplant-free survival (OR 0.030, 95%CI 0.003–0.324, P=0.004, overall model P=0.003). This remained the case after controlling for diastolic stiffness (β), RAP, and stroke volume in another model (OR 0.066, 95%CI 0.005–0.873, P=0.039, overall model P=0.002). But in a model controlling for sex, age and WHO functional class, SV/ESV was the only significant predictor (OR 0.024, 95%CI 0.002–0.391, P=0.009, overall model P<0.001). When the cohort was limited to those with PH (mPAP ≥ 25 mmHg), SV, ESV, RVEF, β and SV/ESV were the only univariate predictors of outcomes. In this cohort limited to mPAP ≥ 25 mmHg, SV/ESV remained an independent predictor of transplant-free survival by multivariate analysis controlling for RAP, mPAP, and SV (OR 0.035, 95%CI 0.003 − 0.379, P=0.006, overall model P=0.015), and this was a much stronger predictor than RVEF in a similar model (OR 0.928, 95%CI 0.883 − 0.974, P=0.003, overall model P=0.002). Patients stratified by a ROC derived cut-off value of ≤ 0.515 for Ees/Ea showed highly significant differences in transplant-free survival in the associated KM curve (Figure 5).
Figure 4.

Forrest plot showing the independent hazard ratio and 95% confidence interval of each parameter to predict a primary outcome of death or lung transplant. A hazard ratio > 1.0 is associated with greater risk of death or lung transplant; a ratio < 1.0 was protective. * P < 0.05 – significant.
Figure 5.

Kaplan-Meier survival curve stratifying patients by stroke volume (SV)/end-systolic volume (ESV) of 0.515 in the whole cohort (Panel A) and when the cohort was limited to those with PH (mPAP ≥ 25 mmHg; Panel B).
Because assumptions about the shape of the pressure-volume loop significantly impact the measured Ees calculated from non-simultaneous measures of pressure and volume, we utilized simultaneous RV pressure and Doppler pulmonary flow velocity in 3 patients to construct representative instantaneous pressure-volume loops. Relative changes in RV volume during a cardiac cycle were calculated from the Doppler flow velocities (Figure 6). The patients respectively had a normal mPAP (17 mmHg) and CO (5.0 L/min), or elevated mPAP (62 and 47 mmHg) and reduced or normal CO (B: 2.4 L/min and C: 8.3 L/min). Ees calculated from the line drawn from Pmax and tangent to the P-V curve was close to Ees calculated by the sRVP pressure method. Ees slopes calculated with mPAP were slightly higher.
Figure 6.

Pressure-volume loops from instantaneous right ventricular (RV) pressure and pulmonary artery Doppler flow (Panel A) compared to the simplified pressure-volume loops with peak systolic RV pressure (sRVP) to estimate ESP (Panel B) for three subjects. The corresponding RV pressure curves are also displayed (left, inset). Slopes of Ees in panel A were 0.91 mmHg/ml (subject A), 1.02 mmHg/ml (subject B), and 1.21 mmHg/ml (subject C). Slopes of Ees in panel B were respectively of 0.83 mmHg/ml, 1.19 mmHg/ml, and C: 1.53 mmHg/ml. Slopes of Ees with mPAP instead of sRVP (not shown) were respectively of 1.03 mmHg/ml, 1.46 mmHg/ml and 1.93 mmHg/ml
DISCUSSION
The present results show that the coupling of RV systolic function to afterload is an independent predictor of transplantation-free survival in patients with PH of variable severities and origins. In this population of patients referred for PH, the simplest metric of RV-arterial coupling based on imaging of end-systolic and end-diastolic volumes was prognostically superior to invasive measurements provided by a right heart catheterization.
The adequacy of RV functional adaptation to afterload in patients with PH is usually evaluated in clinical practice by a variety of invasive and noninvasive measurements. Of those, RAP and CO (RHC), tricuspid annular plane excursion (TAPSE), RV performance index, atrial size, strain and pericardial effusion (echocardiography), SV, ESV, EDV and RVEF (CMR) and brain natriuretic peptides have been demonstrated to be of prognostic relevance [2]. However, available data do not offer a hierarchy allowing clinicians to select pertinent and practical ones depending on patients and available resources. This is why in the present study we explored the predictive value of measurements more closely pertaining to gold standards of systolic and diastolic function of the RV [1–3,15].
Systolic ventricular function or contractility is defined by a maximum ventricular elastance, or end-systolic elastance (Ees). Similarly, ventricular afterload is best defined as arterial elastance (Ea). Both can be measured on the same P-V loop. An Ees/Ea higher than one, normally in the range of 1.5–2, allows for RV flow output at minimal energy cost, and thus reflects optimal ventriculo-arterial coupling [1–3]. Accordingly, several recent studies have reported on Ees/Ea in patients with severe forms of pulmonary hypertension such as PAH or chronic thromboembolic PH, showing adaptative increase in Ees with more or less preserved Ees/Ea ratios [4–7]. However, the predictive value of RV-arterial coupling measured by Ees/Ea has not been yet determined.
In the present study, we looked for the best combination of physiologically sound and clinically feasible prognostic methods. The volume method is an Ees/Ea ratio simplified for pressure [7]. In doing so, there is an inherent assumption that V0, or the RV volume at zero filling pressure, would be equal to zero, which is unrealistic [14]. The end-systolic P-V ratio measured experimentally on a non-ejecting ventricle, or on a family of P-V loops from an ejecting ventricle, is actually slightly curvilinear but with a positive V0 [16]. Therefore, SV/ESV under-estimates Ees/Ea as compared to measurements taking ESP into account [14]. The pressure method calculates Ees/Ea from Pmax, mPAP and SV, resulting in a pressure ratio [Pmax/mPAP − 1]. This method assumes preload-independency of ESV and mPAP as a valid estimate of ESP. Both assumptions suffer from several limitations [4,13–16]. However, the pressure method may provide more accurate measurements of Ees/Ea than the volume method, as relative preload-independency is more likely over the range of reported measurements than a zero value for V0. This was confirmed by Ees/Ea measurements calculated via the single beat methodology in 3 patients. It is therefore surprising that the volume measurement of RV-arterial coupling outperformed other measurements of the adequacy of the coupling of RV systolic function to afterload in predicting outcomes. The reasons for this are not entirely clear. The practical relevance of the finding is that prognostically relevant RV-arterial coupling can be measured using an entirely noninvasive approach. This will require confirmation on a larger patient population.
The P-V loop of a normal RV is of triangular shape, with ejection continuing after maximum elastance, in relation to the low pulmonary vascular impedance [17]. The normal left ventricular P-V loop is of square shape with maximum elastance at end-systole, and thus Ees and Emax coinciding at the upper left corner of the P-V loop [18]. In severe PH as PVR progresses, the P-V loop of the RV transitions to a square shape such that the difference between Ees and Emax becomes insignificant [19] or may take a triangular shape with early peaking and ESP getting close to peak systolic pressure of the RV [4] as also illustrated in Figure 6. Therefore, at a low PVR, ESV measured by any imaging technique under-estimates RV volume at Emax, but this error is minimized at high PVR. On the other hand, the pressure method assuming mPAP close to RV pressure at Emax over-estimates Ees/Ea, so that sRVP to estimate ESP may be preferable. However, in the present study, while the pressure method with sRVP instead of mPAP led to slightly lower Ees and Ees/Ea, as expected (Fig 6) this was not associated with an improved prognostic capability.
Recent studies focusing on RVEF as a measure of RV adaptation to afterload in patients with PAH disclosed the importance of changes over time along with the natural evolution of the disease and pharmacological interventions [20]. However, RVEF is a markedly load-dependent measure of Ees/Ea [3]. Whereas, SV/ESV should be more load-independent than RVEF because ESV changes proportionally less than EDV at any given change in venous return. Due to this, SV/ESV is a surrogate of the RV-arterial coupling ratio and why the optimal measurement of maximal systolic elastance relies on a family of pressure-volume loops at variable venous return [3,4]. How changes over time of more robust measurements of RV-arterial coupling improve outcome prediction in severe PH remains to be explored.
Diastolic function is defined by a diastolic elastance curve determined by a family of pressure-volume loops at variable loading. Several formulas have been proposed [15]. Most recently Rain et al reported on 21 patients with PAH in whom RV diastolic stiffness was estimated by fitting a non-linear exponential curve through the diastolic pressure-volume relationships, with the formula P = α (eVβ − 1) [8]. In that study, the diastolic stiffness constant β was closely associated to disease severity. The pathogenesis of RV diastolic dysfunction was related to increased RV collagen content (ie fibrosis) and stiffness of the RV sarcomeres, in turn due to reduced phosphorylation of titin, a key protein regulating myocyte stiffness [8]. Accordingly, we calculated β via this method and found it to be predictive of transplant-free survival, though not independently.
In the present study, the Ees/Ea ratio and β were highly correlated. This is not surprising as cardiomyocyte relaxation is dependent on afterload, calcium handling and contractile protein function, all affected by systolic functional adaptation to loading conditions, so that ventricular relaxation can be considered as an integral part of a continuous contraction-relaxation cycle of the heart [21].
There are several limitations to the present findings. The first is the small size of the patient population and inhomogeneity of severity and type of PH which precluded valid subgroup analyses. Therefore, it is not known if the present study’s conclusions are generally applicable. The second is that only prediction for initial measurements was investigated, not changes with progression of the disease which will hopefully be addressed in future studies. The third is that SV was measured as the difference between EDV and ESV, which could have caused under-estimation its true value in case of tricuspid regurgitation. However, SV calculated from CO and HR was 72 ± 29 ml, and the difference between EDV and ESV 76 ± 28 ml, P=0.50, indicating absence of significant tricuspid regurgitation in the present study population. Additionally, prospective ECG gating during CMR could have missed true end-diastolic volume and underestimate EDV. The fourth is in the absence of a true gold standard for RV-arterial coupling, based on the measurements of Emax, Ea and β on families of pressure volume loops generated at variable venous return. While the Valsalva manoeuvre has been reported for this purpose [4], this has only been in one study and not found to be generally feasible [6]. On the other hand, inserting an inferior vena cava balloon to manipulate venous return was felt to be excessively invasive and therefore ethically problematic.
In conclusion, this study shows prognostic relevance of RV-arterial coupling evaluated by the imaging of ESV and EDV in patients referred for PH. This will require confirmation in larger PH patient populations.
KEY QUESTIONS.
What is already known about this subject?
Right ventricular (RV) function correlates with prognosis in severe pulmonary hypertension but which metric of it is most clinically relevant is still uncertain. Clinical methods to estimate RV function from simplified pressure volume loops correlate with disease severity but the clinical relevance has not been assessed.
What does this study add?
This study investigated the ability of the RV-pulmonary arterial coupling parameters stroke volume / end-systolic volume ratio (SV/ESV), a RV maximum isovolumetric pressure / mean pulmonary artery pressure ratio, ejection fraction, and by diastolic function of the RV to predict clinical outcomes. The adequacy of RV functional adaptation to afterload in patients referred for pulmonary hypertension predicts survival, and can be evaluated using imaging with the ratio of SV/ESV.
How might this impact on clinical practice?
The ability to relate quantitative metrics of RV function in pulmonary hypertension to clinical outcomes can provide a powerful tool for management. Such metrics could also be utilized in the future as surrogate endpoints for outcomes and evaluation of response to therapies.
Acknowledgments
We thank Mary Pollera, Tim Bachman for technical support and Anthony Longhini for assistance in gathering of data.
The Corresponding Author has the right to grant on behalf of all authors and does grant on behalf of all authors, an exclusive licence (or non exclusive for government employees) on a worldwide basis to the BMJ Publishing Group Ltd and its Licensees to permit this article (if accepted) to be published in HEART editions and any other BMJPGL products to exploit all subsidiary rights
FUNDING
This work supported in part by the NIH Roadmap Multidisciplinary Clinical Research Career Development Award (KL2 RR024154), NIH grants (HL067181, HL07820).
Footnotes
COMPETING INTERESTS
Dr. Simon reports receiving research funding from Pfizer. Dr. Vanderpool reports receiving consulting fees from United Therapeutics. Dr. Mathier reports receiving research funding from Actelion, consulting fees or serving on paid advisory boards for Gilead and Actelion and receiving lecture fees from Actelion, Encysive, and GlaxoSmithKline. Drs. Lacomis and Deible report receiving research funding from MEDRAD Inc. Dr. Champion reports receiving consulting fees or serving on paid advisory boards for Gilead, United Therapeutics, Bayer, Merck and Pfizer. Dr. Pinsky, Mr. Kosaraju, and Ms. Bunner have no competing interests.
References
- 1.Champion HC, Michelakis ED, Hassoun PM. Comprehensive invasive and noninvasive approach to the right ventricle-pulmonary circulation unit: state of the art and clinical and research implications. Circulation. 2009;120:992–1007. doi: 10.1161/CIRCULATIONAHA.106.674028. [DOI] [PubMed] [Google Scholar]
- 2.Vonk-Noordegraaf A, Haddad F, Chin KM, et al. Right heart adaptation to pulmonary arterial hypertension: physiology and pathobiology. J Am Coll Cardiol. 2013;62:D22–33. doi: 10.1016/j.jacc.2013.10.027. [DOI] [PubMed] [Google Scholar]
- 3.Sagawa K, Maughan L, Suga H, et al. Cardiac contraction and the pressure-volume relationship. New York: Oxford University Press; 1988. [Google Scholar]
- 4.Tedford RJ, Mudd JO, Girgis RE, et al. Right Ventricular Dysfunction in Systemic Sclerosis Associated Pulmonary Arterial Hypertension. Circ Heart Fail. 2013;11 doi: 10.1161/CIRCHEARTFAILURE.112.000008. [DOI] [PMC free article] [PubMed] [Google Scholar]
- 5.Kuehne T, Yilmaz S, Steendijk P, et al. Magnetic resonance imaging analysis of right ventricular pressure-volume loops: in vivo validation and clinical application in patients with pulmonary hypertension. Circulation. 2004;110:2010–6. doi: 10.1161/01.CIR.0000143138.02493.DD. [DOI] [PubMed] [Google Scholar]
- 6.McCabe C, White PA, Hoole SP, et al. Right Ventricular Dysfunction in Chronic Thromboembolic Obstruction of the Pulmonary Artery. J Appl Physiol. 2013 doi: 10.1152/japplphysiol.01123.2013. E–pub ahead of print. [DOI] [PMC free article] [PubMed] [Google Scholar]
- 7.Sanz J, García-Alvarez A, Fernández-Friera L, et al. Right ventriculo-arterial coupling in pulmonary hypertension: a magnetic resonance study. Heart. 2012;98:238–43. doi: 10.1136/heartjnl-2011-300462. [DOI] [PubMed] [Google Scholar]
- 8.Rain S, Handoko ML, Trip P, et al. Right ventricular diastolic impairment in patients with pulmonary arterial hypertension. Circulation. 2013;128:2016–25. doi: 10.1161/CIRCULATIONAHA.113.001873. [DOI] [PubMed] [Google Scholar]
- 9.Simon MA, Deible C, Mathier MA, et al. Phenotyping the right ventricle in patients with pulmonary hypertension. Clin Transl Sci. 2009;2:294–9. doi: 10.1111/j.1752-8062.2009.00134.x. [DOI] [PMC free article] [PubMed] [Google Scholar]
- 10.Kramer CM, Barkhausen J, Flamm SD, et al. Standardized cardiovascular magnetic resonance imaging (CMR) protocols, society for cardiovascular magnetic resonance: board of trustees task force on standardized protocols. J Cardiovasc Magn Reson. 2008;10:35. doi: 10.1186/1532-429X-10-35. [DOI] [PMC free article] [PubMed] [Google Scholar]
- 11.Bachman TN, Bursic JJ, Simon MA, et al. A Novel Acquisition Technique to Utilize Swan-Ganz Catheter data as a Surrogate for High-fidelity Micromanometry within the Right Ventricle and Pulmonary Circuit. Cardiovasc Eng Technol. 2013;4:183–91. doi: 10.1007/s13239-013-0124-z. [DOI] [PMC free article] [PubMed] [Google Scholar]
- 12.Brimioulle S, Wauthy P, Ewalenko P, et al. Single-beat estimation of right ventricular end-systolic pressure-volume relationship. Am J Physiol Heart Circ Physiol. 2003;284:H1625–30. doi: 10.1152/ajpheart.01023.2002. [DOI] [PubMed] [Google Scholar]
- 13.Chemla D, Hebert JL, Coirault C, et al. Matching dicrotic notch and mean pulmonary artery pressures: implications for effective arterial elastance. Am J Physiol Hear Circ Physiol. 1996;271:H1287–1295. doi: 10.1152/ajpheart.1996.271.4.H1287. [DOI] [PubMed] [Google Scholar]
- 14.Trip P, Kind T, van de Veerdonk MC, et al. Accurate assessment of load-independent right ventricular systolic function in patients with pulmonary hypertension. J Hear Lung Transplant. 2013;32:50–5. doi: 10.1016/j.healun.2012.09.022. [DOI] [PubMed] [Google Scholar]
- 15.Vonk-Noordegraaf A, Westerhof N. Describing right ventricular function. Eur Respir J. 2013;41:1419–23. doi: 10.1183/09031936.00160712. [DOI] [PubMed] [Google Scholar]
- 16.Kass DA, Beyar R, Lankford E, et al. Influence of contractile state on curvilinearity of in situ end-systolic pressure-volume relations. Circulation. 1989;79:167–78. doi: 10.1161/01.cir.79.1.167. [DOI] [PubMed] [Google Scholar]
- 17.Maughan W, Shoukas A, Sagawa K, et al. Instantaneous pressure-volume relationship of the canine right ventricle. Circ Res. 1979;44:309–15. doi: 10.1161/01.RES.44.3.309. [DOI] [PubMed] [Google Scholar]
- 18.Suga H, Sagawa K, Shoukas AA. Load independence of the instantaneous pressure-volume ratio of the canine left ventricle and effects of epinephrine and heart rate on the ratio. Circ Res. 1973;32:314–22. doi: 10.1161/01.res.32.3.314. [DOI] [PubMed] [Google Scholar]
- 19.Redington AN, Rigby ML, Shinebourne EA, et al. Changes in the pressure-volume relation of the right ventricle when its loading conditions are modified. Heart. 1990;63:45–9. doi: 10.1136/hrt.63.1.45. [DOI] [PMC free article] [PubMed] [Google Scholar]
- 20.Van de Veerdonk MC, Kind T, Marcus JT, et al. Progressive right ventricular dysfunction in patients with pulmonary arterial hypertension responding to therapy. J Am Coll Cardiol. 2011;58:2511–9. doi: 10.1016/j.jacc.2011.06.068. [DOI] [PubMed] [Google Scholar]
- 21.Brutsaert DL, Sys SU. Relaxation and diastole of the heart. Physiol Rev. 1989;69:1228–315. doi: 10.1152/physrev.1989.69.4.1228. [DOI] [PubMed] [Google Scholar]