Abstract
SMPs have been shown to actuate below their dry glass transition temperatures in the presence of moisture due to plasticization. This behavior has been proposed as a self-actuating mechanism of SMPs in water/physiological media. However, control over the SMP actuation rate, a critical factor for in vivo transcatheter device delivery applications, has not been previously reported. Here, a series of polyurethane SMPs with systematically varied hydrophobicity is described that permits control of the time for their complete shape recovery in water from under 2 min to more than 24 h. This control over the SMP actuation rate can potentially provide significant improvement in their delivery under conditions, which may expose them to high-moisture environments prior to actuation.
Keywords: actuation rate, biomaterials, hydrophobicity, polyurethanes, shape-memory foams
1. Introduction
Shape-memory polymers (SMPs) are an emerging class of materials that can remember two or more shapes, and can be actuated to go from one shape to another via an external stimulus such as heat or light. Several comprehensive reviews discussing the properties and behavior of these “smart” materials have been published.[1–5] Processing these SMPs into low- density foams is an active area of research. Hayashi and Fujimura[6] proposed a series of polyurethane SMP foams, which has subsequently been studied extensively.[7–10] Other polyurethane and epoxy-based SMP foam compositions have been reported and characterized in the literature more recently.[11–13] These SMP foams exhibit unique properties such as low density, high-volume expansion on actuation, and high thermal/electrical insulation, which allow for a myriad of potential applications in the aerospace, clothing, sporting gear, and biomedical industries.[14] Among a multitude of potential biomedical applications (e.g., tissue regeneration scaffolds and embolic foams),[15–19] our group is particularly interested in using SMP foams for embolic devices for the treatment of aneurysms.
The ability of low-density SMP foams to stay in a miniaturized compressed form, until actuated to their primary large volume shape, is especially desirable for minimally invasive endovascular applications.[18,19] However, despite their unique properties, the practical use of SMP foams in such applications is quite in its infancy. One of the key issues seen with these materials is the loss of their ability to “actuate on demand”. This may happen by: (a) loss of the material’s tendency to actuate following storage in a secondary shape over long periods of time or at relatively high temperatures (referred to as secondary-shape forming[9] and addressed in an earlier publication[11]) and/or (b) premature actuation, such as on exposure to moisture, a plasticizing agent, which depresses the actuation temperature of the foams.[20,21] The phenomenon of actuation of SMP foams in the presence of moisture, and thereby the loss of their “on demand” actuation, is investigated here.
The effect of moisture on the actuation of SMPs has been reported previously as an alternate actuation mechanism.[22–24] Huang et al.[22,23] described several “water-actuated” neat/nonporous and porous SMP devices based on the MM 3520, MM 3550, and MM 5510 materials from Mitsubishi Heavy Industries. Jung et al.[24] reported polyurethane SMP films based on poly(ethylene glycol) (PEG), polyhedral oligomeric silsesquioxane (POSS), and 1,4-phenyldiisocyanate. These films had a hydrophilic soft segment comprising PEG and a hydrophobic hard segment containing POSS. They demonstrated water-responsive shape recovery of more than 70% for all samples at 30 °C, depending on the POSS content of the films.[24] Also, water-responsive hybrid shape memory materials were recently reported in literature.[25,26] In these materials, a second inorganic phase was used to restrain the recovery of the polymer in the dry state, as opposed to using a polymer phase transition. Yang et al.[27] investigated the mechanism of actuation of SMPs with water on MM 3520 films, and found that it is a combined effect of the weakening of the hydrogen bonding between N–H and C=O groups and plasticization caused by the small water molecules. SMP foams from our group[11] were tested for the effect of moisture by Yu et al.,[21] and again the above mechanisms were found to be at work in quickly depressing the glass transition temperature (Tg) of the foam and causing its rapid actuation on exposure to water.
The passive self-actuation of a thermally responsive SMP device in water or physiological media at body temperature may be a useful feature for a simpler device deployment mechanism without a heating capability. However, if the passive actuation occurs too quickly or in an uncontrollable manner, it can cause problems. For example, the usage of SMP foams for minimally invasive treatment of aneurysms requires transcatheter delivery of the device in its compressed cylindrical shape. Once it reaches the target site, it would be actuated to its primary spherical shape to fill the aneurysm and eventually to resist any blood flow inside it. Since the compressed device may be exposed to moisture/physiological fluid while inside the catheter, premature expansion of a moisture-sensitive device may occur during the delivery itself. This can drastically increase the friction within the catheter and potentially inhibit delivery of the device. With low-density foams, this issue becomes even more important due to the increased surface area available for the uptake of water/moisture. Hence, it is desirable to be able to control the rate of actuation of the foam-based SMP devices in the presence of moisture.
One possible solution to this problem would be to vary the hydrophobicity of the SMP, thereby controlling the extent of the depression in actuation temperature due to exposure to water. To test this hypothesis, we synthesized and characterized a novel series of low-density SMP foams with increasing diisocyanate monomer hydrophobicity. Such materials should exhibit a controlled reduction in the rate of their self-actuation in water, facilitating transcatheter delivery of the device. Here, we report the process of synthesis of these materials, their key physical properties, and their actuation behavior. Also, an analysis of the actuation mechanism is presented, and various challenges and potential solutions to the transcatheter delivery of SMP foam devices are discussed.
2. Materials and Methods
2.1. Synthesis
N,N,N′,N′-Tetrakis(2-hydroxypropyl)ethylenediamine (HPED, 99%; Sigma-Aldrich Inc.), 2,2′,2″-nitrilotriethanol (TEA, 98%; Alfa Aesar Inc.), 1,6-diisocyanatohexane (HDI; TCI America Inc.), 1,6-diisocyanatotrimethylhexane, 2,2,4- and 2,4,4- mixture (TMHDI, TCI America Inc.), and deionized (DI) water (>17 MΩ cm purity; Millipore water purifier system; Millipore Inc.,) were used as received. Foams were synthesized in a three-step method reported previously,[11] using the amounts indicated in Table 1, and were allowed to cure for at least a week before testing. The notations 100TM, 80TM, 60TM, 40TM, 20TM, and 0TM denote TMHDI constituting 100, 80, 60, 40, 20, and 0 mol% of isocyanate, respectively, with the remaining mol% of isocyanate coming from HDI, as indicated in Table 1.
Table 1.
Composition of foams synthesized using hexamethylene diisocyanate (HDI) and trimethylhexamethylene diisocyanate (TMHDI) for the isocyanate component of the urethane.
| Sample | HDI [wt%] |
TMHDI [wt%] |
HPED [wt%] |
TEA [wt%] |
Water [wt%] |
DC5179 [wt%] |
DCI990 [wt%] |
T-131 [wt%] |
BL-22 [wt%] |
Enovate [pph] |
|---|---|---|---|---|---|---|---|---|---|---|
| 100TM | 0.00 | 66.79 | 17.11 | 5.73 | 2.35 | 3.81 | 3.30 | 0.26 | 0.64 | 7.62 |
| 80TM | 11.00 | 55 | 17.63 | 5.92 | 2.42 | 3.8 | 3.29 | 0.25 | 0.64 | 7.6 |
| 60TM | 22.70 | 42.58 | 18.18 | 6.09 | 2.49 | 3.78 | 3.28 | 0.25 | 0.64 | 7.57 |
| 40TM | 35.15 | 29.30 | 18.77 | 6.29 | 2.57 | 3.77 | 3.27 | 0.25 | 0.64 | 7.54 |
| 20TM | 48.43 | 15.14 | 19.39 | 6.50 | 2.66 | 3.75 | 3.25 | 0.25 | 0.63 | 7.50 |
| 0TM | 62.62 | 0.00 | 20.06 | 6.72 | 2.75 | 3.73 | 3.24 | 0.25 | 0.63 | 7.47 |
Neat polymers of corresponding compositions, excluding the physical and chemical blowing agents and other foaming additives (surfactants and catalysts), were synthesized according to Table 2 for contact angle measurements. Calculated amounts of monomers were mixed together and cast in polystyrene dishes. The curing profile involved an initial cure at room temperature for 2 h followed by ramping up to 120 °C at 20 °C h−1. Thereafter, the temperature was maintained at 120 °C for 2 h, and finally the heat was turned off and samples were allowed to cool down to room temperature. An inert nitrogen atmosphere was maintained throughout the curing process.
Table 2.
Composition of neat/nonporous polymers synthesized following the same synthesis scheme as that of the foams (Table 1). Amount of TMHDI was gradually increased from 0TM (all HDI) to 100TM (all TMHDI) composition. No foaming additives such as surfactants, catalysts and physical and chemical blowing agents were added.
| Sample | HDI [wt%] |
TMHDI [wt%] |
HPED [wt%] |
TEA [wt%] |
|---|---|---|---|---|
| 100TM | 0.00 | 61.65 | 28.72 | 9.62 |
| 80TM | 10.11 | 50.57 | 29.45 | 9.87 |
| 60TM | 20.75 | 38.91 | 30.21 | 10.12 |
| 40TM | 31.95 | 26.63 | 31.02 | 10.39 |
| 20TM | 43.77 | 13.68 | 31.87 | 10.68 |
| 0TM | 56.26 | 0.00 | 32.77 | 10.98 |
2.2. Post-Processing of Foams
Post-processing of foams is often required since the as-blown foams typically retain residual membranes post-synthesis. In order to make foams completely open cell or reticulated, as desired for the proposed application, secondary physical processes such as hydrolysis, oxidation, heat, or mechanical treatment are normally employed.[28] Caustic hydrolysis of polyurethanes, also referred to as “quenching,” is a standard process of reticulation of traditional polyurethane foams in industry.[29] Another well-accepted method of reticulating polyurethane foams is “zapping,” which involves controlled burning of the membranes via saturation with flammable gases.[29] Several patents have been filed in this area of study.[30–35]
In this work, an acid-based etching was performed on the foams prior to testing of their actuation and actuation related properties. Although this etching process was not optimized for complete membrane removal in the foams, it was included to account for the possibility that more hydrophilic surfaces may be created from these post-processing etching methods.[36] Since increased surface hydrophilicity may alter the moisture sensitivity of the material relative to un-etched foams, the device actuation results with inclusion of the etching process are potentially more relevant to an actual device. For performing the cleaning and etching processes, blocks of foams were etched in hydrochloric acid (0.1 N; BDH Chemicals) for 2 h. Thereafter they were cleaned with two 15 min treatments each of 80–20 vol% DI water/contrad solution and DI water, respectively. All steps were performed under sonication. The foams were finally dried overnight under vacuum at 50 °C before testing.
2.3. Physical Properties
2.3.1. Density and Cell Structure
Core densities of three foam samples of each composition were measured from the representative top and middle sections as per the ASTM standard D-3574. For cell structure characterization, thin slices of foam were cut from a representative top section of the blown foam, and images were captured in the brightfield mode on a Leica MZ8 microscope (Leica Microsystems Inc.) using RSImage Software (Roper Scientific Inc.).
2.3.2. Differential Scanning Calorimetry
Glass transition temperature (Tg) was measured using a Q-200 DSC (TA Instruments Inc.). A 3–5 mg sample was compressed to near bulk density and loaded in a vented aluminum pan at room temperature, cooled to −40 °C and then run through a heat/cool/heat cycle from −40 to +120 °C at 10 °C min−1. The half height of the transition during second heat was taken as an estimate of the Tg.
2.3.3. Dynamic Mechanical Analysis (DMA)
For characterizing the mechanical properties of the foams as a function of temperature, a dynamic temperature ramp test was performed on an ARES-LS2 Rheometer (TA Instruments Inc.) according to a previously described method.[11] A torsion rectangle test fixture was used on samples cut to approximately 45 mm long, 12 mm wide, and 6 mm thick with a gap distance of 25 mm. The samples were prepared by embedding both ends in a polyurethane neat polymer to prevent damage and slippage of the foam sample in the metal grips. Dynamic temperature ramp tests were then run for each formulation in triplicate, at a frequency of 1 Hz and constant heating rate of 1 °C min−1 from 25 to 150 °C. An initial shear strain of 0.2% was used. However, as the temperature increased, the strain was adjusted by the control software to maintain a torque range of 0.5 to 5 g cm, allowing a maximum strain of 10% (still within the linear viscoelastic region) at high temperatures. Data points were collected every 5 s. Dynamic shear storage modulus (G′), dynamic shear loss modulus (G″), and their ratio tan δ (=G″/G′) were recorded using the Orchestrator™ software (TA Instruments Inc.). Tonset was recorded as the temperature at which the baseline and the leading edge of the peak in tan δ intersect, Tδs (another measure of Tg) was recorded as the temperature at which the tan δ curve was at its peak value, and ΔT (breadth of transition) was recorded as twice the difference between Tδs and Tonset, according to Yakacki et al.[37]
2.3.4. Fourier-Transform Infrared (FTIR) Spectroscopy
FTIR spectra of the foam were collected using a Spectrum 2000 FTIR (Perkin Elmer Inc.). The sample chamber was purged with nitrogen gas for 5 min and a background spectrum was captured. Thereafter, thin slices cut from foam blocks (≈2–4 mm in thickness) were placed on a 2 cm−1 JStop holder (0.88 cm aperture). The chamber was again purged for 5 min after placing the sample, and an FTIR spectrum was collected in the transmission mode at a resolution of 4 cm−1. The test was performed in duplicate to ascertain reproducibility of the spectra. A total of 50 scans were taken for each sample and the background spectrum was subtracted using the Spectrum software (Perkin Elmer Inc.).
2.4. Characterization of Foam Actuation and Actuation-Related Properties
2.4.1. Contact Angle
Contact angle measurements were made on neat/unfoamed polymers corresponding to the foam compositions (Table 2) using a DSA100 (Kruss Inc.). DI water drops of 4–5 mL volume were placed on the sample surface. The drop was allowed to come to an equilibrium shape for 30 s and the resulting contact angle was measured using the drop shape analysis software (Kruss Inc). An average value over 10 measurements was calculated for an estimate of the contact angle of the polymer surface.
2.4.2. Equilibrium Water Uptake
Cylindrical foam samples were cut from a 2.5 cm thick foam block using an 8 mm diameter biopsy punch and dried under vacuum at 50 °C overnight. The dry sample weight (Wdry) was measured on an Ohaus Analytical Plus scale (Central Carolina Scale Inc.). The samples were then soaked in ≈1000 times weight excess of water for 24 h. To measure the equilibrium water absorption, the samples were first taken out from water media and the excess (adsorbed) water on the samples was removed in two steps: (a) repeated pressing (by hand) between sheets of laboratory grade kimwipes (Kimberly-Clark Inc.), until no wet spots could be seen, and then (b) pressing between kimwipes to 1 metric ton pressure for 2 min in a #3925 Hydraulic press (Carver Laboratory Equipments). The samples were placed on the weighing balance immediately thereafter and their equilibrium weight (Wwet) was recorded. The absorbed water (wt%) in the foam samples was calculated as (Wwet − Wdry) × 100/Wdry. Five samples were tested for each foam composition.
2.4.3. Depression in Tg With Exposure to Water
Cylindrical samples of foam were cut from a 2.5 cm thick block using an 8 mm diameter biopsy punch and submerged in a water bath at 37 °C for 5, 15, 30, 60, or 120 min. After the specified time of submersion, the samples were taken out and excess water was removed in two steps using kimwipes and a hydraulic press as described above. A DSC scan was then run from −40 to +80 °C at 10 °C min−1 on a 4–8 mg foam sample in a vented aluminum pan, using a Q-200 DSC (TA Instruments Inc.). The Tg of the sample was estimated from the half height of the thermal transition during the first heating scan. Five samples of each composition were tested at each time point.
2.4.4. Rate of Expansion of Foam in Water at 37 °C
Cylindrical foam samples approximately 1 cm in length were cut using a 6 mm diameter biopsy punch and threaded over straight 0.09 mm diameter Nitinol wires (Nitinol Devices & Components, Inc.). An initial measurement of the diameter of the punched samples was taken using a digital micrometer. Each sample was then radially compressed as small as possible, at 97 °C at a radial compression rate of approximately 6.2 mm s−1, using an SC150-42 Stent Crimper (Machine Solutions Inc.). The compressed shape was fixed by allowing the sample to passively cool down to room temperature in the compressed state over a period of 2 h. The samples were allowed to rest in this secondary compressed shape for 24 h in a nitrogen purged environment before testing. After the resting period, the compressed diameter was measured using a digital micrometer. The nitinol wires holding the compressed foam samples were then strung across a heavy fixture such that the foam never touched the fixture, and the assembly was submerged in a water bath heated to 37.0 ± 0.5 °C. A scale was submerged alongside the samples. Images of the foam samples were taken at 1 to 5 min intervals over a period of 1 h, as the foams expanded in the water bath. For the measurement of the diameter of the foam at any given time, the maximum diameter along the length of the sample was measured from the captured images using ImageJ software. Five samples of each composition were tested. Results were normalized by the measured initial (uncompressed) diameter.
2.4.5. Theoretical Solubility Parameter Analysis
Hoy’s solubility parameters were calculated to estimate the relative swelling of the foams in the water media.[38] The calculations were done on the basis of the four types of network units generated from the reaction of isocyanate with HPED, TEA, water, and the excess isocyanate. Although the excess isocyanate groups can undergo several secondary reactions such as allophanate or biuret formation, for simplicity they were assumed to be converted to primary amines from reaction with ambient moisture. Group contributions of each of these network units, HPED, TEA, water, and excess isocyanate (Figure 1) were calculated as per Van Krevelen et al.[38] The net solubility parameter components δt, δp, and δh representing total, polar, and hydrogen bonding components of the polymer cohesive energy density, were then determined by adding the respective contributions of the network units on a volume fraction (ϑ) basis (Equation 1). The dispersion force component of the total solubility parameter was calculated using Equation 2.
Figure 1.
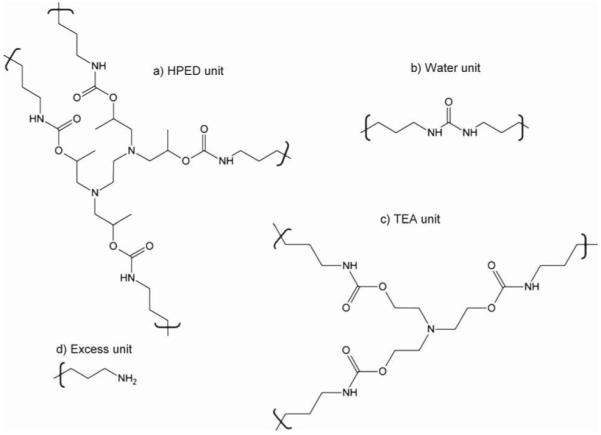
Structures of the (a) HPED, (b) TEA, (c) water, and (d) excess network units used to calculate the contributions of Hoy’s solubility parameter components.
| (1) |
where
| (2) |
3. Results
3.1. Physical Properties
3.1.1. Density and Cell Structure
Density results of all foam compositions are reported in Table 3. Sufficiently low-density foams were seen for all foams with values ranging from 0.013 to 0.027gcm−3. These values suggest an average porosity [(ρneat − ρporous)/ρneat] of ≈98% and a high average theoretical volume expansibility (= ρneat/ρporous) of ≈60 times; here the average ρneat ≈1.1 g cm−3 is the neat polymer density and ρporous is the foam density. The small standard deviation of 0.001–0.006 g cm−3 (Table 3) in the density measurements indicates a fairly uniform structure of the foams.
Table 3.
Summary of the key physical properties of the different foam compositions.
| Sample ID | Density [g cm − 3] |
Tg
[°C] |
G′giassy at Tδs−20 °C [kPa] |
G′rubbery at Tδs+ 20°C [kPa] |
Tonset
[°C] |
Tδs
[°C] |
ΔT
[°C] |
tan δ (Peak value) |
|---|---|---|---|---|---|---|---|---|
| 100 TM | 0.014 ± .001 | 75 | 108 ± 7 | 2 ± 1 | 58 ± 1 | 80 ± 1 | 40 ± 0 | 1.04 ± .02 |
| 80 TM | 0.013 ± .002 | 71 | 103 ± 6 | 3 ± 1 | 57 ± 2 | 77 ± 1 | 42 ± 1 | 1.05 ± .06 |
| 60 TM | 0.025 ± .001 | 69 | 311 ± 28 | 13 ± 2 | 53 ± 1 | 70 ± 3 | 37 ± 1 | 0.91 ± .01 |
| 40 TM | 0.017 ± .001 | 68 | 90 ± 3 | 3 ± 2 | 57 ± 3 | 77 ± 1 | 35 ± 3 | 1.02 ± .02 |
| 20 TM | 0.027 ± .006 | 65 | 158 ± 24 | 6 ± 2 | 53 ± 3 | 66 ± 3 | 27 ± 4 | 0.89 ± .04 |
| 0 TM | 0.018 ± .004 | 63 | 155 ± 46 | 6 ± 1 | 51 ± 2 | 64 ± 1 | 30 ± 4 | 0.71 ± .04 |
Optical microscopy was used to determine cell structure, with typical structures shown in Figure 2. Observations include uniform closed or mixed closed to open cell structure for a given composition, with thin residual membranes between struts as previously reported for similar materials.[11] At the same time cell sizes varied for the different compositions. A significant factor contributing to the size variation is believed to be the variation in the foaming solution viscosity (≈2–60 Pa s), which was not a controlled variable across different compositions. It has been observed that the cell sizes of the foams can be controlled by controlling the viscosity of the foaming solution; the sizes are generally seen to decrease with increase in the foaming solution viscosity.
Figure 2.
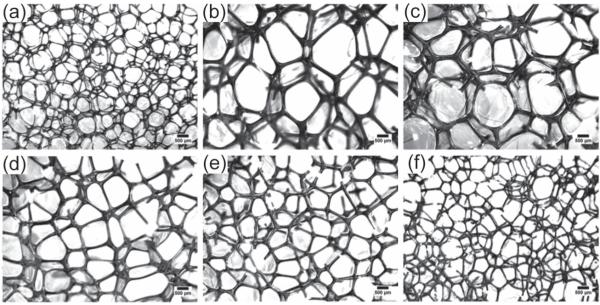
Cell structure of the foams as obtained from optical microscopy. Images (a), (b), (c), (d), (e) and (f) represent 0TM, 20 TM, 40 TM, 60 TM, 80 TM, and 100 TM compositions, respectively (scale bar is 500 μm).
It is important to note here that the primary design objectives for the proposed application (low-density and uniform cell structure) as described in Singhal et al.[11] were successfully met for all compositions. Hence, properties specific to the embolic biomedical applications of these materials, such as high crimping efficiency of the device and a large volume expansion on actuation, may be realized. Also, they have a highly crosslinked network architecture, which is expected to provide optimal shape memory properties as described by Singhal et al.[11]
3.1.2. Differential Scanning Calorimetry (DSC)
DSC results of the foams are shown in Table 3 and Figure 3. The foams show a single Tg with values varying within a narrow range of 63–75 °C. Lack of any crystallization or melting region in the DSC thermogram confirms the amorphous nature of the polymer network. An increase in the TMHDI content was seen to increase the effective Tg of the foams. This is expected as the methyl groups of TMHDI can increase the energy required by the molecule to rotate about the backbone bonds.
Figure 3.
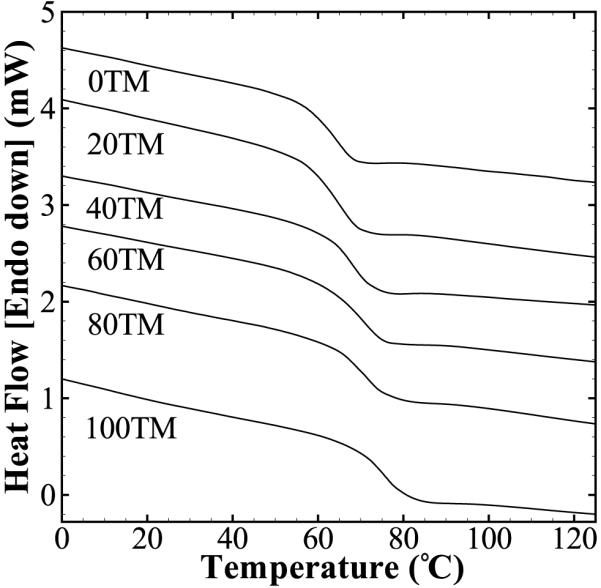
DSC curves of the different foam compositions. Single sharp glass transitions were seen for all compositions within a small range of 63–75 °C.
3.1.3. DMA
DMA results of the foams are shown in Table 3 and Figure 4. A variation in the glassy modulus (G′glassy) is recorded from 311 to 90 kPa across different compositions. To explain this relatively large range, variation in the densities of these compositions was accounted for in the G′glassy estimations. The reference of 0TM was used and the value of G′glassy at 0.018 g cm−3 was extrapolated using G1 = G2(ρ1/ρ2)2 as per Gibsonet al.,[39] where G is the modulus, ρ is the material density, and subscripts 1 and 2 denote corrected and measured values, respectively. Average glassy moduli of ≈70, 101, 161, 197, and 179 kPa were thus calculated for 20 TM, 40 TM, 60 TM, 80 TM, and 100TM foams, respectively. While the values of other compositions are similar when extrapolated to the same density, 20 TM and 40 TM foams have relatively lower moduli (70–101 kPa). This may be due to larger cell sizes of these foams as seen in Figure 2. Surface effects have been shown to become more prominent as the dimensions of the tested sample approach those of the cell size, and a reduction in foam modulus and strength is often noticed in such cases.[40,41]
Figure 4.
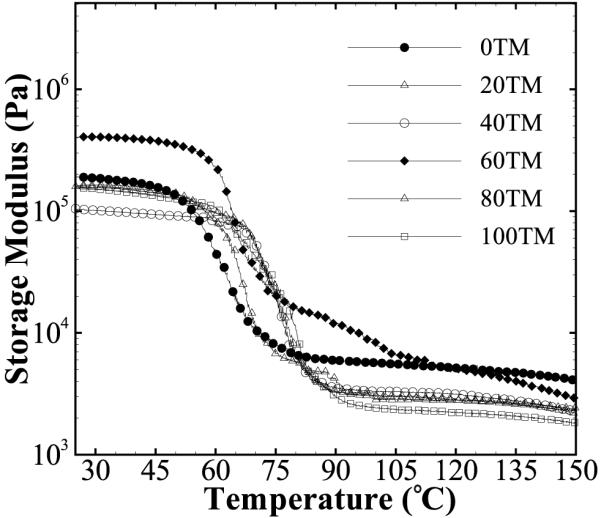
DMA curves of the different foam compositions. Single sharp glass transitions were seen for all compositions within a small range of 64–80 °C.
The DMA measured Tg of all the materials is within ≈16 °C, leading to a significant overlap in the storage modulus versus temperature curves (Figure 4). The onset of transition from the glassy to the rubbery state is approximately 55 ± 3 °C, and Tg (estimated as the temperature at the peak value of the tan δ curve) is 72 ± 7 °C across all compositions (Table 3). A small but positive increase in the Tg with increase in the TMHDI content is seen. This follows the trend observed in the DSC measurements (Figure 3). Also, a single thermal transition from the glassy to the rubbery state, with a transition range of ≈35 ± 6 °C was recorded for all compositions. The presence of a single thermal transition with a constant rubbery modulus confirms an amorphous and crosslinked polymer network structure of the foams.
3.1.4. FTIR Spectroscopy
The FTIR spectra of the foams of different compositions are shown in Figure 5. The spectra of the compositions are qualitatively similar, and the typical features of the spectra reported earlier for related compositions[11] are evident for all compositions. These include the hydrogen-bonded urethane peak at ≈1695 cm−1 and a urea shoulder at ≈1653 cm−1. The position of these peaks, however, is shifted (≈3–6 cm−1 higher) compared with previously reported foams.[11] This may be related to the difference in the physical condition of the tested samples.[42] The compression of the foams to a flat sheet for performing attenuated total reflectance (ATR) FTIR done in the previous study[11] may have enhanced hydrogen bonding of urethane/urea groups leading to a shift of urethane and urea absorption to slightly lower values.
Figure 5.
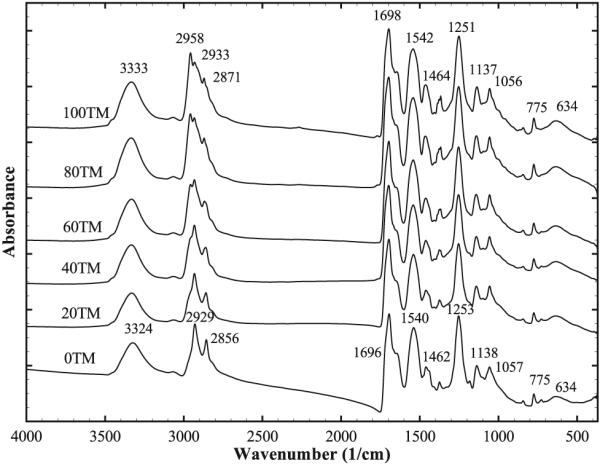
FTIR curves of the different foam compositions. Changes in the C–H vibrations of the −CH3 groups of TMHDI are evident in the 2800–3000,1430–1490, and 1350–1400 cm−1 ranges.
On the other hand, the effect of TMHDI can be readily observed across the different compositions. The differences in the C–H vibrations due to the inclusion of methyl side groups of TMHDI can be seen in the 2800–3000, 1430–1490, and 1350–1400 cm−1 wavenumber ranges. The peaks at 2958 and 2871 cm−1 in the 100TM foam correspond to asymmetrical and symmetrical C–H stretching vibrations of the −CH3 groups, respectively.[43] The peaks at 1464 and 1370 cm−1 in the 100TM foam correspond to the asymmetrical and symmetrical C–H deformation vibrations of the −CH3 groups, respectively.[43] These peaks are seen to increase in intensity due to an increase in the C–H vibration as the amount of TMHDI is increased.
3.2. Characterization of Foam Actuation and Actuation-Related Properties
3.2.1. Contact Angle
The contact angle was measured on neat/unfoamed polymer samples as these measurements on foam samples were difficult, and subject to high variability due to the porous nature of the foam surface. The measurement results of the corresponding compositions are shown in Table 4, and Figure 6 illustrates the change in contact angle as we progress from the 0TM to the 100TM composition. A decrease in the contact angle from 78 to 62° is seen as the TMHDI content is decreased in the composition. This result supports the hypothesis that the introduction of methyl groups in the polymer network via use of TMHDI increases the hydrophobicity of the material. Although the absolute values of contact angle for the corresponding foam formulations can be different from those obtained from the neat samples due to the presence of urea groups from the use of water as a chemical blowing agent in the foams, they are expected to follow a similar trend with the variation in the foam composition.
Table 4.
Summary of the results related to the actuation behavior of the foams.
| Sample | Equilibrium moisture uptake [wt%] |
Contact angle [°] |
Equilib- rium Tga) [°C] |
Estimated working- time b) [min] |
|---|---|---|---|---|
| 100TM | 2.3 ± 1.0 | 78.08 ± 2.58 | 39.1 ± 0.3 | 10 |
| 80TM | 4.3 ± 0.7 | 74.73 ± 2.51 | 30.6 ± 1.3 | 5 |
| 60TM | 4.4 ± 0.9 | 74.06 ± 0.83 | 26.4 ± 0.4 | 4 |
| 40TM | 6.0 ± 0.8 | 70.62 ± 3.51 | 21.1 ± 1.7 | 3 |
| 20TM | 5.0 ± 0.8 | 66.26 ± 4.97 | 15.0 ± 0.7 | < 3 |
| 0TM | 8.1 ± 1.9 | 62.55 ± 2.86 | 12.2 ± 0.6 | < 1 |
Measured after 2 h of submersion in water;
Defined here as the time until ≈ 20% of the initial diameter is recovered in 37 ° C water (representative of, but not necessarily equivalent to, the working time for an actual catheter-delivered device).
Figure 6.
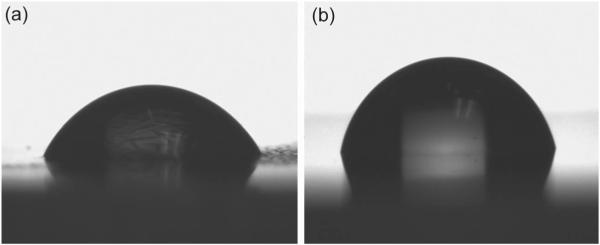
Contact angle images of (a) 0TM and (b) 100TM neat/unfoamed polymer compositions. An increase in the contact angle is noticed with an increase in the TMHDI content of the polymer.
3.2.2. Equilibrium Water Uptake
Equilibrium water absorption values are reported in Table 4. Water uptake decreases from ≈8 to ≈2% as the TMHDI content is increased in the foam composition. This result is in agreement with the contact angle results and is a direct measure of the increase in hydrophobicity of the foams with increasing TMHDI content. The slight discrepancy in the trend may be due to the different cell sizes (different surface areas) of the foam samples.
3.2.3. Depression in Tg With Exposure to Water
The results of depression in the foam Tg on its exposure to water are shown in Table 4 and Figure 7. All foam compositions reach their equilibrium plasticized Tg value within 5 min of exposure to water. Kinetically, the depression in Tg is fast enough that it may be considered independent of the TMHDI composition within the tested time scale. The extent of depression of Tg, however, progressively decreases as the TMHDI content is increased, with the equilibrium Tg value going from ≈12 °C for the 0TM foams to ≈40 °C for the 100TM foams. Consequently, the extent of plasticization due to moisture is found to be lower (higher equilibrium Tg ≈ 40 °C) for the most hydrophobic polymer composition.
Figure 7.
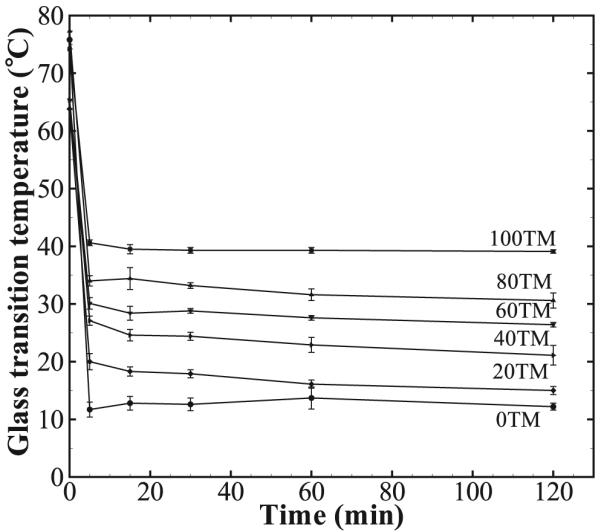
Change in the glass transition temperature (Tg) of the foam samples with respect to time submerged in water at 37 °C. The equilibrium Tg value is achieved within 5 min for all compositions. An increase in the equilibrium Tg of the foams is noticed with the increase in the TMHDI content.
3.2.4. Rate of Expansion of Foam in Water at 37 °C
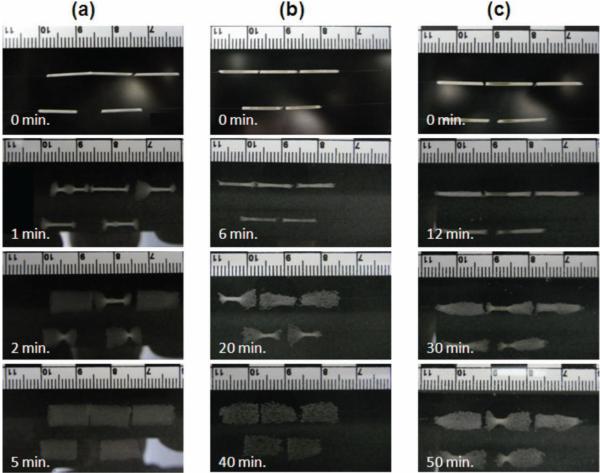
Results of the rate of expansion of foam samples in water are shown in Table 4 and Figures 8 and 9. The rate of actuation decreases with increase in the amount of TMHDI in the foam formulation. The 0TM foam samples show no delay in actuation and achieve complete actuation within 2 min of exposure to water. Conversely, 100TM foam samples maintain their secondary compressed shape for ≈10 min under water, and do not recover completely to their primary shape even after 1 h. The error bars in Figure 9 are relatively large because the maximum diameter of the expanding foams was used to generate the plot. As is evident in Figure 8, even though the average trend of actuation is the same within a given composition, the maximum diameter is not uniform across the entire length of the sample and varies across different samples of the same composition.
Figure 8.
Rate of actuation of foam samples of (a) 0 TM, (b) 80 TM, and (c) 100 TM compositions. While the 0 TM foams with only HDI in their composition actuated completely within 5 min of exposure to water at 37 °C, the 100 TM foams did not complete their actuation even at 50 min.
Figure 9.
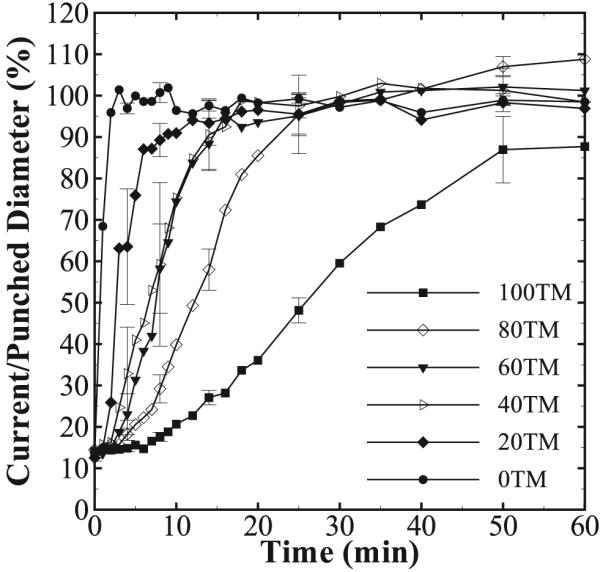
Ratio of the maximum diameter to the initial/punched diameter as a function of time in 37 °C water for all foam compositions. Only every fourth error bar is marked for clarity. A decrease in the rate of expansion of the SMP foam is seen with an increase in the TMHDI content.
The foam actuation rate depends on the depressed Tg in the water and the temperature of the water. Since the depressed Tg of the 100TM foam is ≈40 °C (i.e., slightly above the water temperature), it does not actuate as readily as the 0TM foam whose depressed Tg of ≈12 °C is well below the water temperature (37 °C). It should be noted here that although these tests are conducted in water, the foams are expected to have a similar trend of actuation behavior in physiological media due to its high water content. Also, these results are reported for 6 mm diameter cylindrical samples. Although the trends across different compositions are expected to be the same, the absolute actuation time may increase with an increase in the sample size.
3.2.5. Theoretical Solubility Parameter Analysis
Hoy’s solubility parameters calculated for different polymer compositions are reported in Table 5. The objective of doing these calculations was to develop an understanding of the changes in the solvent (water)/polymer interactions with the variation in the polymer formulation. It is well known that the difference between the solubility parameter (δt) value of a crosslinked polymer and that of the solvent is directly related to the degree of polymer swelling in that solvent.[38] The calculated net δt of 0TM and 100TM compositions are 23.0 and 21.3 J1/2 cm−3/2 respectively, resulting in a higher difference in the polymer and water δt values for the 100TM composition (δt water = 48 J1/2 cm−3/2). This suggests that the 0TM foams would undergo a higher equilibrium swelling in water compared with the 100TM foams, due to their relatively favorable chemical environment in water. The higher extent of equilibrium swelling is expected to influence the depression in Tg, and therefore the rate of actuation of the foam devices in water.
Table 5.
Hoy’s solubility parameters calculated for the different foam compositions.
| Sample |
δd
[J1/2 cm−3/2] |
δp
[J1/2 cm−3/2] |
δh
[J1/2 cm−3/2] |
δt
[J1/2 cm−3/2] |
|---|---|---|---|---|
| 100TM | 16.7 | 10.6 | 7.8 | 21.3 |
| 80TM | 16.6 | 10.8 | 8.5 | 21.6 |
| 60TM | 16.7 | 11.1 | 8.8 | 21.9 |
| 40TM | 16.7 | 11.3 | 9.3 | 22.2 |
| 20TM | 16.7 | 11.6 | 9.8 | 22.6 |
| 0TM | 16.7 | 11.9 | 10.4 | 23.0 |
To better understand the foam actuation mechanisms, we now discuss the effect of the polymer chemical structure on its interaction with water. In previous studies, it has been found that the water molecules weaken the hydrogen bonding between N–H and C=O groups and plasticize the polymer network, causing a depression in the Tg of the polyurethane SMP materials in high-humidity/water environments.[20,21,27] Water molecules have a small size and a high hydrogen bonding potential. Hence, when exposed to a polyurethane SMP, they can disrupt the hydrogen bonds between N–H and C=O groups of the urethane linkages of adjacent chains, and can then be inserted between these groups via mutual hydrogen bonding. Since hydrogen bonding is largely dynamic in nature, insertion of water molecules between adjacent chains essentially works as a lubricant, thereby increasing the mobility of the chains, that is, plasticizing the polymer.[44] By this analogy, the change in the degree of depression of Tg seen for the series of compositions here should be a function of the extent of interaction of water molecules with the urethane hydrogen bonding in the polymer. Indeed, as demonstrated by the water absorption studies and the theoretical determination of solubility parameters, the amount of equilibrium water absorbed depends on the chemical environment of the polymer. Due to higher differences in the cohesive energy densities, it is relatively energetically unfavorable for the water molecules to coexist with the polymer and undergo hydrogen bonding in the presence of higher amounts of methyl groups. Hence, a lower amount of water is absorbed at equilibrium by materials with a higher TMHDI content. With fewer water molecules between adjacent chains, that is, lower amount of equilibrium absorption of water or swelling, the increase in polymer chain mobility is lower, leading to a lower depression in Tg in the 100TM composition. Conversely, a higher water absorption or swelling leads to a higher increase in mobility and hence a higher depression in Tg in the 0TM composition.
The primary goal of this study was to achieve improved control over the rate of actuation of SMP foam to enhance its use in a device for aneurysm treatment. The SMP foam devices are proposed to be delivered to the aneurysm site via a catheterization process while they are in their completely compressed rod-like secondary shape. As the device approaches the aneurysm site, the clinician must carefully position the device within the aneurysm so that it does not protrude into the parent artery. Ideally, the device should not start expanding until these steps of delivery and positioning are completed. However, after these steps are complete, the device should expand at a relatively fast rate to fill the aneurysm. In this regard, a concern with moisture sensitive SMP devices is that the guiding catheters and microcatheters used in surgical processes are routinely flushed with saline solution during the device delivery. This may cause a moisture-sensitive material to potentially begin expanding inside the catheter during the delivery process. It is therefore desirable to reduce the moisture sensitivity of the device such that it is able to withstand body temperature fluid environments without actuation during the entire duration of its delivery and positioning. This duration can range from 1 min to up to 5–10 min, depending on the patient vasculature and the location of the aneurysm.[45]
This work demonstrated that increasing the hydrophobicity of the monomers in the foam synthesis can reduce its rate of actuation. This would allow the device to initially maintain its near-compressed shape for a longer period in water/physiological environments, and later still actuate to its primary shape in a passive/active manner to fill the aneurysm. The passive actuation of a device on exposure to water/physiological media may allow the usage of a simpler deployment device without a heating capability. However, it presents a practical tradeoff in the rate of actuation versus the working time of the device (time for which the device maintains its near-compressed secondary shape while being exposed to water/physiological media). A lower rate of actuation gives a longer device working time (as in 100 TM foams, Figure 8), but complete actuation also takes a relatively long time, which may not be preferable in all cases.
A possible strategy to mitigate the tradeoff between the rate of actuation and the working time is to use a material that has high hydrophobicity to facilitate delivery and positioning of the device, and thereafter actuate it actively by applying thermal energy. The actuation temperature of these materials can be changed by varying the ratio of the hydroxyl components HPED and TEA, as reported in Singhal et al,[11] so that they may be actuated with a relatively small amount of thermal energy to minimize the potential for thermal tissue damage. Employing active actuation of the device while utilizing the above polymer synthesis toolbox is thus expected to give a higher level of predictability and control on the actuation of the SMP foam devices during their deployment for in vivo embolic or regenerative applications.
4. Conclusion
Some polyurethane SMP foams are seen to undergo premature moisture-induced actuation, which may inhibit their use in transcatheter device delivery applications. To address this issue, a series of novel low-density, highly covalently crosslinked SMP foams was synthesized with varying hydrophobicity by substituting HDI with a more hydrophobic TMHDI in the foam composition. Contact angle and water uptake measurements confirmed that the hydrophobicity of these materials could be controllably increased via increase in the TMHDI content, consistent with the calculated solubility parameter values. Also, the depressed Tg could be controlled from ≈12 (for 0TM foams) to ≈40 °C (for 100TM foams) after submersion in water. A reduction in the foam actuation rate corresponding to the depressed Tg value was observed, and time of complete actuation of a compressed foam device could be controlled from within 2 min (for 0TM foams) to up to more than 24 h (for 100 TM foams). Such control over the actuation rate of SMP foams by virtue of their composition has, to our knowledge, not been reported before. This work provides the basis of a polymer synthesis toolbox that, we expect, will be useful in the development of passively or actively actuating, embolic/regenerative porous SMP scaffolds for biomedical applications.
Acknowledgements
This work was partially performed under the auspices of the US Department of Energy by Lawrence Livermore National Laboratory under Contract DE-AC52-07NA27344 and supported by the National Institutes of Health/National Institute of Biomedical Imaging and Bioengineering Grant R01-EB000462 and by Lawrence Livermore National Laboratory Directed Research and Development (LDRD) Grants 04-LW-054 and 04-ERD-093. The authors would like to acknowledge Thomas Yong Han (LLNL) for his help in the contact angle measurements and technical discussions.
References
- [1].Liu C, Qin H, Mather PT. J. Mater. Chem. 2007;17:1543. [Google Scholar]
- [2].Lendlein A, Kelch S. Angew. Chem. Int. Ed. 2002;41:2034. [PubMed] [Google Scholar]
- [3].Mather PT, Luo X, Rousseau IA. Annu. Rev. Mater. Res. 2009;39:445. [Google Scholar]
- [4].Rousseau IA. Polym. Eng. Sci. 2008;48:2075. [Google Scholar]
- [5].Behl M, Lendlein A. Mater. Today. 2007;10:20. [Google Scholar]
- [6].Hayashi S, Fujimura H, Mitsubishi Jukogyo Kabushiki Kaisha 1991. US 5049591.
- [7].Tobushi H, Okumura K, Endo M, Hayashi S. J. Intel. Mater. Syst. Struct. 2001;12:283. [Google Scholar]
- [8].Tobushi H, Shimada D, Hayashi S, Endo M. Proc. Inst. Mech. Eng. L J. Mater. Des. Appl. 2003;217:135. [Google Scholar]
- [9].Tobushi H, Matsui R, Hayashi S, Shimada D. Smart Mater. Struct. 2004;13:881. [Google Scholar]
- [10].De Nardo L, Alberti R, Cigada A, Yahia LH, Tanzi MC, Farč S. Acta Biomater. 2009;5:1508. doi: 10.1016/j.actbio.2008.11.017. [DOI] [PubMed] [Google Scholar]
- [11].Singhal P, Rodriguez JN, Small W, Eagleston S, Van de Water J, Maitland DJ, Wilson TS. J. Polym. Sci., Part B: Polym. Phys. 2012;50:724. doi: 10.1002/polb.23056. [DOI] [PMC free article] [PubMed] [Google Scholar]
- [12].Di Prima MA, Lesniewski M, Gall K, McDowell DL, Sanderson T, Campbell D. Smart Mater. Struct. 2007;16:2330. [Google Scholar]
- [13].Domeier L, Nissen A, Goods S, Whinnery L, McElhanon J. J. Appl. Polym. Sci. 2010;115:3217. [Google Scholar]
- [14].Sokolowski WM, Hayashi S. Applications of cold hibernated elastic memory (CHEM) structures. In: Baz AM, editor. Proceedings of the SPIE 10th International Symposium on Smart Structural Materials; San Diego. 2003. p. 534. [Google Scholar]
- [15].Metcalfe A, Desfaits AC, Salazkin I, Yahia L, Sokolowski WM, Raymond J. Biomaterials. 2003;24:491. doi: 10.1016/s0142-9612(02)00362-9. [DOI] [PubMed] [Google Scholar]
- [16].Small W, Buckley PR, Wilson TS, Benett WJ, Hartman J, Saloner D, Maitland DJ. IEEE T. Biomed. Eng. 2007;54:1157. doi: 10.1109/TBME.2006.889771. [DOI] [PubMed] [Google Scholar]
- [17].El Feninat F, Laroche G, Fiset M, Mantovani D. Adv. Eng. Mater. 2002;4:91. [Google Scholar]
- [18].Sokolowski WM, Metcalfe A, Hayashi S, Yahia L, Raymond J. Biomed. Mater. 2007;2:S23. doi: 10.1088/1748-6041/2/1/S04. [DOI] [PubMed] [Google Scholar]
- [19].Maitland DJ, Small W, IV, Ortega JM, Buckley PR, Rodriguez J, Hartman J, Wilson TS. J. Biomed. Opt. 2007;12:030504. doi: 10.1117/1.2743983. 1. [DOI] [PubMed] [Google Scholar]
- [20].Yang B, Huang WM, Li C, Lee CM, Li L. Smart Mater. Struct. 2004;13:191. [Google Scholar]
- [21].Yu YJ, Hearon K, Wilson TS, Maitland DJ. Smart Mater. Struct. 2011;20:085010. doi: 10.1088/0964-1726/20/8/085010. 1. [DOI] [PMC free article] [PubMed] [Google Scholar]
- [22].Huang WM. Open Med. Devices J. 2010;2:11. [Google Scholar]
- [23].Huang WM, Yang B, Zhao Y, Ding Z. J. Mater. Chem. 2010;20:3367. [Google Scholar]
- [24].Jung YC, So HH, Cho JW. J. Macromol. Sci., Phys. 2006;45:453. [Google Scholar]
- [25].Fan K, Huang WM, Wang CC, Ding Z, Zhao Y, Purnawali H, Liew KC, Zheng LX. Exp. Polym. Lett. 2011;5:409. [Google Scholar]
- [26].Wang CC, Huang WM, Ding Z, Zhao Y, Purnawali H. Compos. Sci. Technol. 2012;72:1178. [Google Scholar]
- [27].Yang B, Huang WM, Li C, Li L. Polymer. 2006;47:1348. [Google Scholar]
- [28].Klempner D, Sendijarevic V. Handbook of PolymericFoams and FoamTechnology. 2nd Hanser Gardner Publications; Cincinnati: 2004. [Google Scholar]
- [29].Olson RA, III, Steppe PK, Porvair PLC 2008. EP 1622695.
- [30].Powers W, Volz R, Scott Paper Company PA 1959. US 2900278.
- [31].Volz R, Scott Paper Company PA 1965. US 3171820.
- [32].Haines RM, Owens-Corning Fiberglas Corp DE 1964. US 3125542.
- [33].Geen H, Chemotronics Inc. MI 1965. US 3175030.
- [34].Geen H, Rice W, Chemotronics Inc. MI 1965. US 3175025.
- [35].Stark NH. 1960. US 2961710.
- [36].Mijovik JS, Koutsky JA. Polym. Plast. Technol. Eng. 1977;9:139. [Google Scholar]
- [37].Yakacki CM, Shandas R, Safranski D, Ortega AM, Sassaman K, Gall K. Adv. Funct. Mater. 2008;18:2428. doi: 10.1002/adfm.200701049. [DOI] [PMC free article] [PubMed] [Google Scholar]
- [38].Van Krevelen DW, Te Nijenhuis K. Properties of Polymers: Their Correlation With Chemica lStructure, Their Numerical Estimation and Prediction From Additive Group Contributions. 4th Elsevier; Amsterdam: 2009. [Google Scholar]
- [39].Gibson LJ, Ashby MF, Schajer GS, Robertson CI. Proc. R. Soc. A. 1982;382:25. [Google Scholar]
- [40].Onck PR, Andrews EW, Gibson LJ. Int. J. Mech. Sci. 2001;43:681. [Google Scholar]
- [41].Andrews EW, Gioux G, Onck P, Gibson LJ. Int. J. Mech. Sci. 2001;43:701. [Google Scholar]
- [42].Welti D. Infrared Vapour Spectra: Group Frequency Correlations, Sample Handling and the Examination of Gas Chromatographic Fractions. Heyden & Sons; London: 1970. [Google Scholar]
- [43].Socrates G. Infrared Characteristic Group Frequencies: Tables and Charts. 2nd Wiley & Sons; New York: 1994. [Google Scholar]
- [44].Hodge RM, Bastow TJ, Edward GH, Simon GP, Hill AJ. Macromolecules. 1996;29:8137. [Google Scholar]
- [45].Hartman personal communication.


