Abstract
Variable Radio Frequency Proton-Electron Double-Resonance Imaging (VRF PEDRI) enables extracting a functional map from a limited number of images acquired at pre-selected EPR frequencies using specifically designed paramagnetic probes with high quality spatial resolution and short acquisition times. In this work we explored potential of VRF PEDRI for pH mapping of aqueous samples using recently synthesized pH-sensitive phosphonated trityl radical, pTR. The ratio of Overhauser enhancements measured at each pixel at two different excitation frequencies corresponding to the resonances of protonated and deprotonated forms of pTR probe allows for a pH map extraction. Long relaxation times of pTR allow for pH mapping at EPR irradiation power as low as 1.25 W during 130 s acquisition time with spatial resolution of about 1 mm. This is particularly important for in vivo applications enabling one to avoid sample overheating by reducing RF power deposition.
Keywords: Proton-Electron Double-Resonance Imaging, Overhauser-enhanced magnetic resonance imaging, Trityl radical, PH mapping
Introduction
Proton-Electron Double-Resonance Imaging (PEDRI) [1] or Overhauser-enhanced magnetic resonance imaging (OMRI) [2] is based on the proton MRI acquired upon electron paramagnetic resonance (EPR) irradiation of paramagnetic molecules, the latter providing an enhancement of the NMR signal via transfer of polarization from electrons to protons by the Overhauser effect [3]. Conventional PEDRI has been shown to be a useful technique to image paramagnetic probe distribution [4, 5] and tissue oxygenation [6] in living subjects. In addition, functional PEDRI approaches such as variable field [7] and variable radio frequency (VRF) PEDRI [8] allow for recovering essential spectral information and functional mapping using specially designed paramagnetic probes. VRF PEDRI in combination with pH-sensitive nitroxide probe has been used for extracellular tumor pH mapping in living animals [9], a pH map being obtained from two PEDRI acquisitions performed at EPR frequencies of protonated and unprotonated forms of the nitroxide.
The trityl radicals have advantage over nitroxides for in vivo PEDRI applications due to extraordinary high stability in living tissues [10] and long relaxation times [11] allowing for a maximum saturation with limited radio frequency (RF) power deposition. These compounds were first developed for biomedical applications by Nycomed Innovation [12] and have been used for in vivo EPR [13] and PEDRI oximetry [6]. In addition, trityl derivatives containing amino [14] or phosphono [15, 16] groups demonstrate dual function oxygen and pH spectral sensitivity. Recently monophosphonated trityl probe, pTR, has been used for concurrent tissue pO2 and pH monitoring in tumor-bearing mice using continuous waves EPR spectroscopy [16]. In this work we investigate the capacity of the pTR probe for pH mapping of aqueous samples by VRF PEDRI approach.
Experimental
Synthesis
The monophosphonated trityl probe, pTR (Scheme 1), was synthesized as previously described [16].
Scheme 1.
Chemical structure of monophosphonated trityl radical, pTR, and the scheme of acid-base equilibrium between the radical forms with protonated (pTR3−) and unprotonated (pTR4−) phosphono group (pKa2=6.9). Note the values of pKa1≈1.3 for the first dissociation of phosphono group and pKa≈2.6 for the dissociation of carboxyl groups [16].
PEDRI Instrument
VRF PEDRI experiments were performed on a home-made imager/spectrometer [17]. A water-cooled iron core Resonex 5000/Paradigm resistive magnet (Resonex Corp., Sunnyvale, CA) was used to generate the main vertical 200 G magnetic field. High homogeneity of the NMR detection field was achieved by a set of 24 active shims, providing homogeneity of better than 20 ppm over sample volume. Modified Danfysik MPS 854/SYS 8000 power supply was used to power the magnet. Current regulation of the magnetic field relies on the high precision manually adjustable reference voltage, providing stability better than 0.5 ppm/hr of the current and, therefore, of the magnetic field.
For dynamic nuclear polarization (DNP) spectroscopy, the secondary magnet is used for partial offset of the main magnetic field which enables the field sweep necessary for spectroscopy [17]. A planar low inductance coil (Tesla Engineering, West Sussex, UK) placed in the gap within the primary electromagnet magnet is used for this purpose. The secondary coil is actively shielded to minimize the eddy currents that result in the primary electromagnet when the current in the secondary coils is ramped up and down to perform field offset. The cancellation coils also have an integrated gradient coil which is not used in the DNP spectroscopy studies but has been used in PEDRI applications. Any heat generated is removed from the water cooled cancellation coils by an Eaton-Williams TE 20411 heat exchanger. The power supply that drives the secondary coil consists of a Copley 266 power supply amplifier (Copley Controls, MA, USA) rated at 350 V, 250 A which is powered by two 15 kW DC power supplies (Lambda EMI, NJ, USA) connected in parallel.
Resonator assembly for regional images of small animals with coaxial orientation of EPR and NMR B1 fields was used. For EPR excitation, it uses one-loop two-gap design previously described in [18]. The resonator has loop of 33 mm ID and 20 mm length. For MRI, Helmholtz coils were utilized. Resonators were tuned to be used both at ~200 G main magnetic field. Quality factor was 200 and 80 correspondingly. EPR RF tuning element was designed as removable/interchangeable block. No mutual shielding, as well as coupling between EPR and MRI channels during the EPR irradiation was observed which was the main concern for this design. EPR power absorption is ~3 times less than power required to achieve similar enhancement with Aldemant Grant design [19]. The EPR irradiation was supplied by a synthesized source (Fluke 6071A) and was amplified by Kalmus 7150LC-CE amplifier (maximum output of 150 W). Transmitted and reflected power was monitored by BIRD RF Power Analyst 4391 A.
Individual parts of the imaging system are controlled by a customized MRRS MR 5000 console (MR Solutions Inc., Surrey, UK), including gradient hardware, the RF system, field cycling coils (which has been used for DNP experiments), and the magnet shim coils. Console also provides image acquisition and post-processing. For pH mapping PEDRI images were acquired at fixed magnetic field of 200 G upon EPR irradiation at two EPR frequencies, selected to optimize the contrast between unprotonated, pTR4−, and protonated, pTR3−, radical forms. The pulse sequence begins with the switching on the irradiation at one of the frequencies. RFEPR started 800 msec prior to MRI image acquisition in order to allow polarization transfer from electron spins to protons and continued during the image acquisition. Conventional gradient echo pulse sequence was used for image acquisition. The system parameters used: magnetic field (fixed), 200 G; EPR frequencies, 573.625 MHz and 573.950 MHz; NMR frequency, 856 kHz.
pH Titration
Trityl radical solutions were titrated by addition of a small volume of NaOH or HCl with the final dilution of sample less than 1%. pH was controlled by pH electrode calibrated using pH values for reference solution recommended by National Bureau of Standards (U.S.). Temperature of reference and titrated solutions during pH measurements was controlled using jacketed reaction beaker attached to Lauda Circulator E100.
Phantom for optimization of PEDRI pH measurements
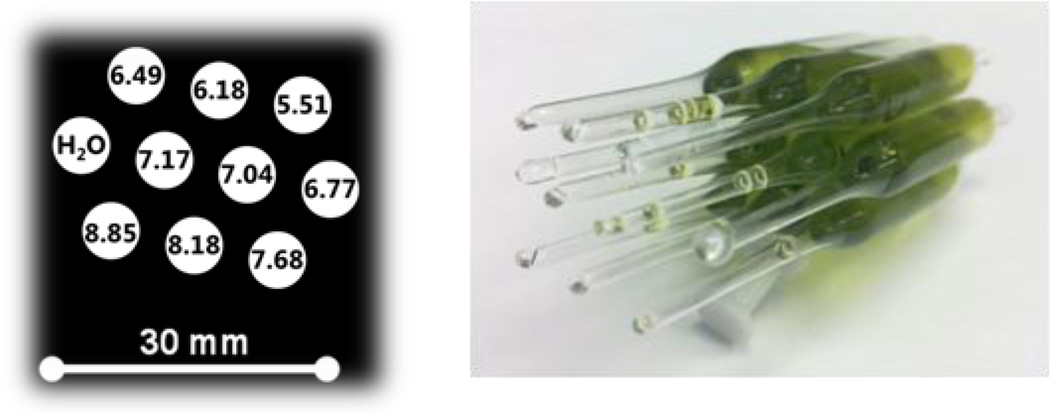
The phantom used for optimization of VRF PEDRI pH mapping is shown in Figure 1. The phantom consists of 10 sealed glass tubes: 9 tubes were filled with a 0.5 mM solution of the probe in 150 mM sodium chloride at different pH values from 5.51 to 8.85 indicated in the Figure 1; the 10th tube was filled with sodium chloride to be used as a reference. All samples were degassed.
Figure 1.
Schematics of the phantom used for PEDRI pH calibration. The tubes are filled with 1 ml solution.
DNP measurements
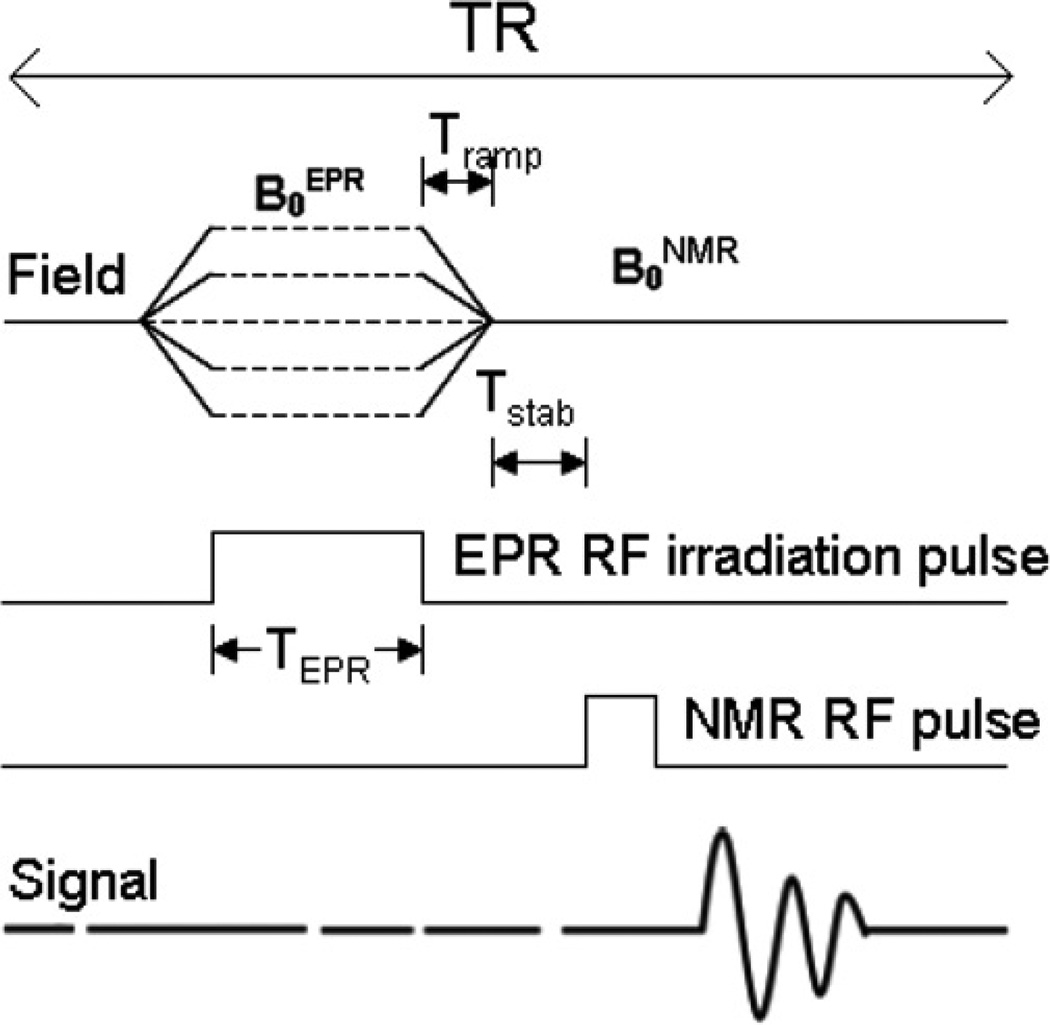
DNP spectra were obtained by means of a field-cycled DNP pulse sequence in which the evolution field strength was stepped in 10 mG increments as illustrated in Figure 2. The pulse sequence begins with the switching of the magnetic field from B0NMR to B0EPR in a time equal to Tramp (typically 40 msec). EPR irradiation of the electron spin at B0EPR applied for a time TEPR=800 msec. This is followed by the ramping of the field up or down back to B0NMR for detection of the NMR signal after Tstab of 5 msec. This sequence is repeated by increasing B0EPR in steps to achieve the field sweep necessary for acquiring the DNP spectrum. The EPR irradiation frequency was maintained constant (as was the NMR frequency), so each step of the evolution field was equivalent to the sampling of an EPR signal at a different magnetic field value. The number of steps defined the overall width of the observed spectrum and its resolution. In this study, typically spectra of 200 points over a field range of 2 G centered on 200 G provided the spectrum of low field line of the sample.
Figure 2.
A DNP spectroscopy pulse sequence diagram.
Results
DNP optimization of EPR irradiation power
The EPR spectrum of pTR probe is represented by the doublet due to hyperfine splitting, hfs, from the phosphorus nucleus (SN = 1/2) of the phosphono group. The difference in hfs values of pTR3− (aP=3630 mG) and pTR4− (aP=3370 mG) forms, ΔaP = 260 mG, corresponds to 130 mG distance between spectral lines of these forms [16].
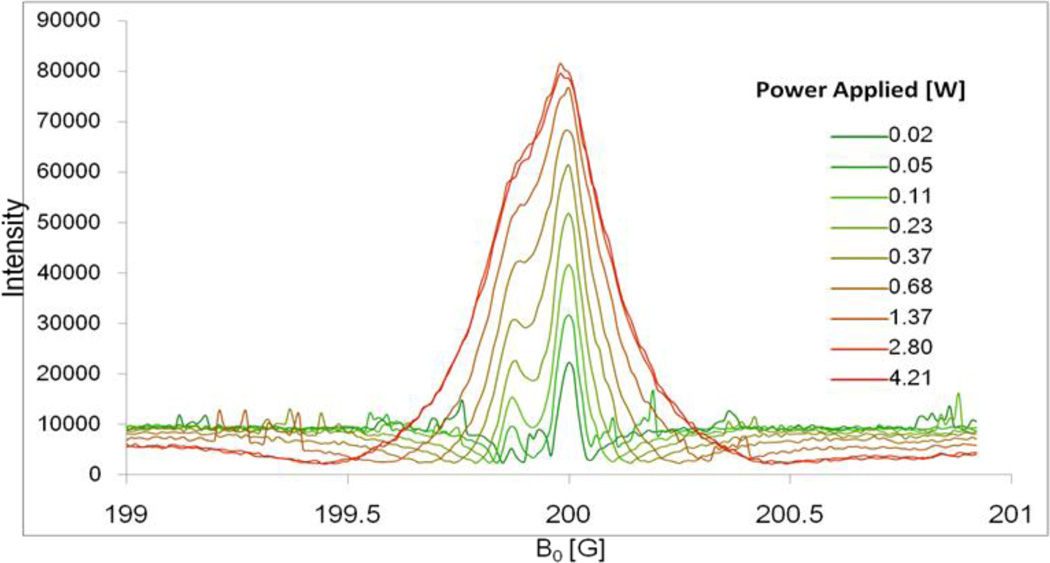
Figure 3 shows DNP spectra of the low-field component of pTR radical measured at EPR frequency 573.65 MHz and various EPR irradiation powers. At low irradiation powers two well resolved peaks separated by about 120 mG are observed with the higher spectral intensity for unprotonated pTR4− form in agreement with the sample pH value (pH 7.4) being above pKa2=6.9 (see Scheme 1). While DNP signal is enhanced with the power increase, corresponding line broadening of the individual components compromise spectral resolution, therefore decreasing pH sensitivity. For further VRF PEDRI experiments a power of 1.25 W was chosen achieving enhancement ~7 while keeping spectral lines partially resolved.
Figure 3.
DNP spectra of low-field component of the 0.5 mM pTR radical solution, 150 mM NaCl, pH 7.4, measured at EPR frequency 573.650 MHz and different irradiation power.
pH mapping with VRF PEDRI and pTR probe
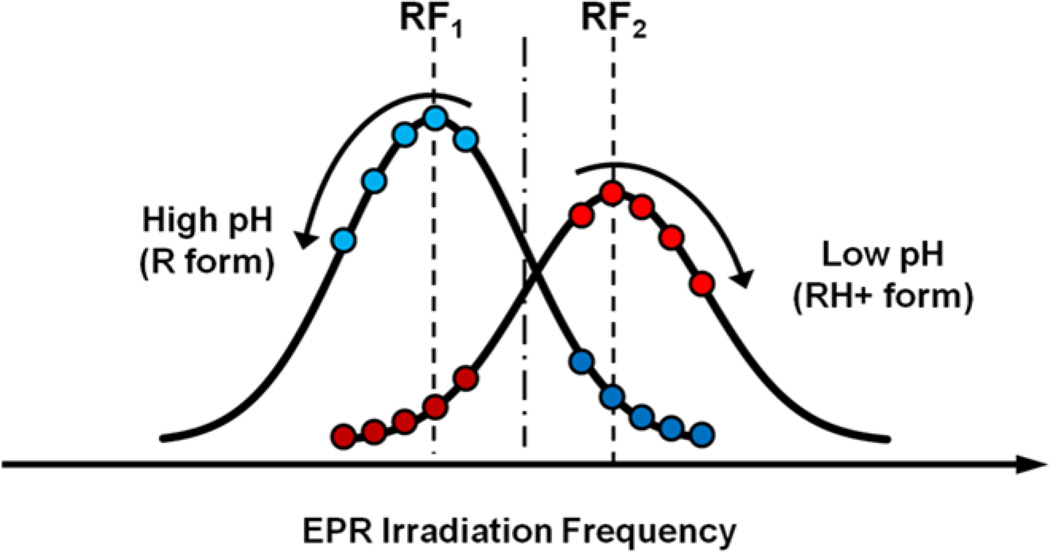
To evaluate the capacity of VRF PEDRI for pH mapping using pTR probe, the PEDRI measurements were performed using the phantom described in Experimental part (see Fig.1). The phantom consists of 10 tubes filled with saline or 0.5 mM pTR saline solutions with different pH values ranging from 5.51 to 8.85. For pH mapping two PEDRI images were acquired at fixed magnetic field of 200 G upon EPR irradiation at two EPR frequencies, RF1 and RF2, that correspond to the resonances of the unprotonated, pTR4−, and protonated, pTR3−, radical forms. As follows from the Figure 3, the difference between field positions of pTR3− and pTR4 signals is about 120 mG which corresponds to EPR frequency difference of about 340 kHz, while resonator central frequency is about 573.8 MHz. For fine tuning of EPR irradiation frequencies, PEDRI images of the phantom (Fig.1) were acquired upon irradiation at two sets of frequencies, RF1 and RF2, as illustrated in Figure 4. The acquired images were analyzed for the changes in normalized intensity ratio, I (RF1)/(I(RF1)+ I(RF2)), over pH range from pH 5.51 to pH 8.85. The RF1 and RF2 frequencies that provide the biggest ratio change, or optimal dynamic range of pH sensitivity, were selected for further pH mapping.
Figure 4.
The illustration of optimization of EPR frequencies for PEDRI pH mapping. The EPR resonator was tuned to 573.800 MHz. The EPR frequencies RF1 and RF2 were varied with 25 kHz increment step. Offset from the EPR resonator central frequency did not exceed 200 kHz and did not lead to significant increase in microwave power reflection and reduction of irradiation efficiency. The acquired PEDRI images were analyzed for the changes in normalized intensity ratio, I (RF1)/(I(RF1)+ I(RF2)), over total pH range from pH 5.51 to pH 8.85 (see Fig.1). The RF1 and RF2 frequencies that provide the biggest difference, namely RF1 = 573.625 MHz and RF2 = 573.950 MHz, were selected for further pH mapping.
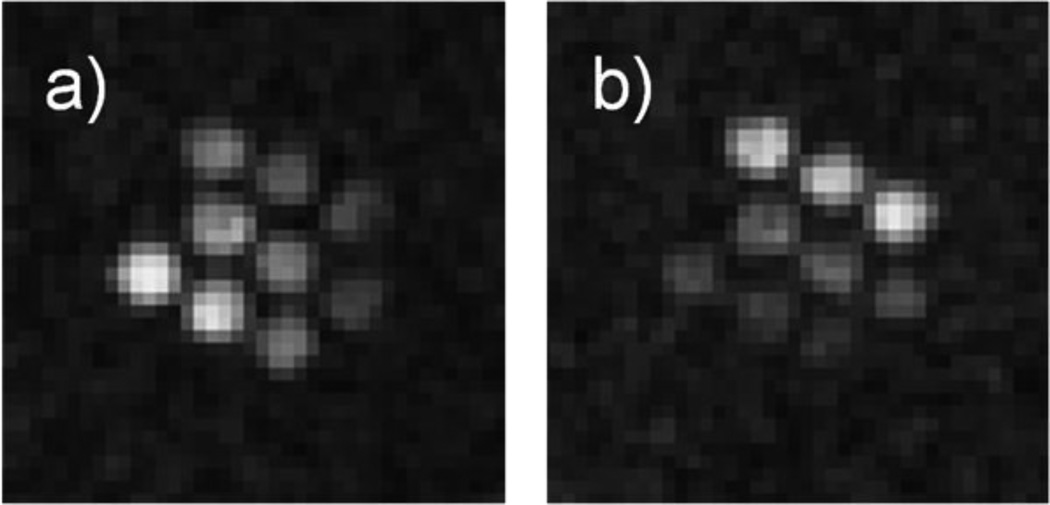
Figure 5 shows PEDRI images of the phantom obtained upon EPR irradiation at optimized EPR frequencies, RF1 = 573.625 MHz and RF2 = 573.950 MHz. When acquired at RF1 (Figure 5a), signals from the upper right tube filled with the most acidic solution and bottom left tube with the most alkaline solution demonstrated the lowest and highest enhancements correspondingly. The situation is reversed for the image acquired at RF2 (Figure 5b). The tube with saline solution alone is not visible on the either image due to the absence of paramagnetic probe-induced signal enhancement.
Figure 5.
PEDRI of the miltitube phantom shown in Fig.1. Images were acquired with a) 573.625 MHz and b) 573.950 MHz EPR irradiation frequency, respectively. The MRI acquisition parameters (using gradient echo pulse sequence) were: TR, 500 ms; TE, 40 ms; matrix, 64 × 64; field of view, 80 × 80 mm; slice thickness, 20 mm; Number of repetitions, 4; acquisition time, 129 s; NMR frequency, 856 kHz. EPR irradiation power, 1.25 W, irradiation time, 130 s.
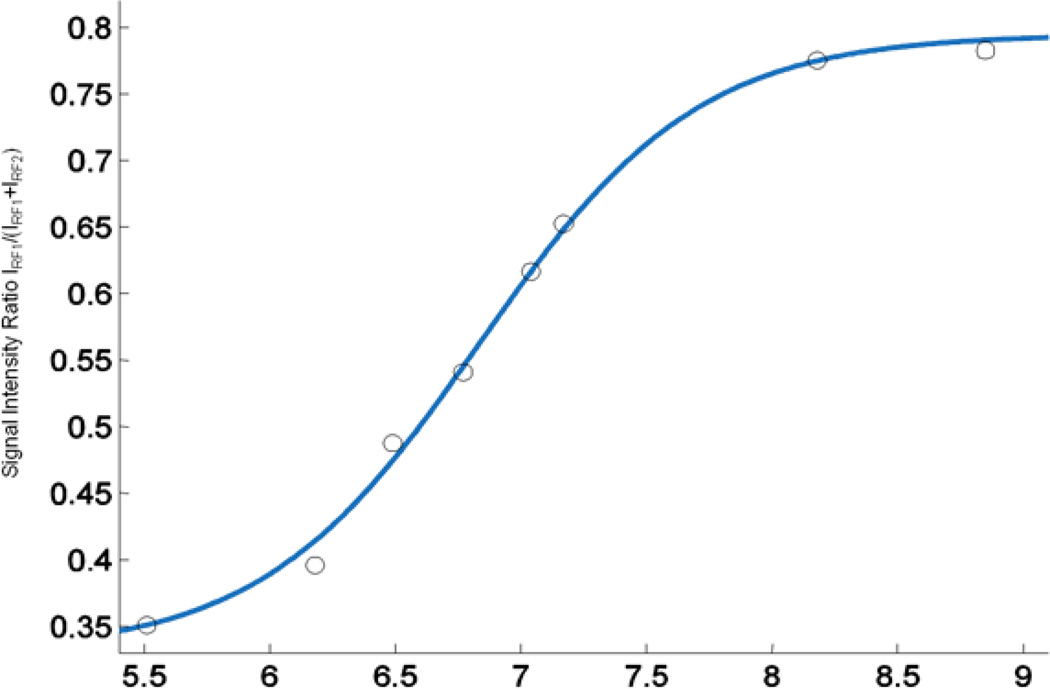
The corresponding dependence of intensities ratio I(RF1)/(I(RF1)+I(RF2)) on pH is shown in Figure 6. Each point on the graphs corresponds to an average value of the ratios within the individual tube, calculated for each pixel of the image. The data from the phantom are described by standard titration curves with the observed pKa2 value of 6.9±0.1. This is in agreement with the previously reported value of pKa, 6.90±0.05, obtained from pH dependence of the hyperfine splitting of the EPR spectra of the pTR radical [16]. pH values accessible for pH mapping using pTR probe and VRF PEDRI approach are in the range from pH 6 to pH 8 with an accuracy of pH detection of 0.1 pH units.
Figure 6.
pH dependence of VRF PEDRI intensities ratio I(RF1)/(I(RF1)+I(RF2)). Solid line is standard titration curve with the pKa2 value of 6.9.
Discussion
Acidity, or pH, is one of the most important parameters in the physiology of living organisms [20]. Deviation from normal tissue pH homeostasis in the human body has been reported for a number of pathological conditions that include cancers [21], myocardial [22] and brain [23] ischemia, and chronic pulmonary [24] and kidney [25] diseases. The extracellular tumor tissue acidosis has been identified as a significant factor in cancer pathophysiology contributing to tumor initiation, progression, and therapy [21, 26]. Therefore, in vivo extracellular pH (pHe) imaging can contribute to the diagnosis, understanding of disease progression, and treatment optimization.
The techniques currently employed for imaging of tumor pHe include Optical Imaging, Positron Emission Tomography (PET), Magnetic Resonance Spectroscopy and Imaging (MRI), EPR imaging (EPRI) and PEDRI. Optical pH imaging [27, 28] suffers from limited penetration depth while PET requires application of radioisotope labeled pH probes [29]. Both MRI and EPRI allow for in vivo pH mapping in living subjects due to sufficient penetration depth of radio frequency microwaves in living tissue. To avoid signal overlaps MRI and NMR techniques for the assessment of tumor pHe rely entirely on exogenous pH probes such as the 31P pH probe 3-aminopropylphosphate [30], 19F pH probes [31] and hyperpolarized 13C-labeled bicarbonate [32]. Note that clinical application of 13C-labeled bicarbonate is limited by a short image acquisition time due to the fast 13C signal decay. EPR-based pH measurements using nitroxide pH probes [33–35] possess a high signal specificity due to the lack of endogenous paramagnetic species. However, pH mapping using continuous wave EPRI requires a comparatively long acquisition time [36, 37]. Moreover, short relaxation times of the nitroxide pH probes compromise spatial resolution of EPRI which requires the application of powerful field gradients and/or extraordinary fast pulse techniques.
pH mapping using VRF PEDRI is based on the proton MRI acquired upon specific EPR frequency irradiations of pH-sensitive paramagnetic probes. Therefore, PEDRI inherently offers high spatial resolution and rapid image data collection. Recently VRF PEDRI in combination with pH-sensitive nitroxide probe has been used for pHe mapping in tumor-bearing mice [9]. The pH-sensitive pTR probe has advantage over nitroxide probe possessing a longer relaxation times [38] and, therefore allowing for a maximum saturation with lower RF power deposition. In this work we performed VRF PEDRI pH mapping with a spatial resolution of ≈1 mm (Figure 5) and functional sensitivity of 0.1 pH units using comparatively low irradiation power of 1.25 W and short acquisition time of ≈2 min. An acquisition time can be further decreased down to about 20 s using fast spin echo sequence as described in the recent work [9].
Trityl radicals were found to be highly sensitive oxygen probes due to extraordinary narrow linewidths. A variable power (VP) PEDRI approach [6, 39] based on acquisitions with different powers of EPR irradiation has been employed for oxygen mapping. A phosphonated trityl probe demonstrates dual function sensitivity to oxygen and pH [16, 38]. Further studies are required to investigate the potential of pTR probe for concurrent mapping of two different functional parameters using combination of VP and VRF PEDRI approaches.
Acknowledgements
This work was supported in part by a NIH Grants EB014542 and EB016096grant, and Japan Society for the Promotion of Science (JSPS) grant 26249057 to H.H. VVK acknowledges JSPS for invitation fellowship S-14064.
References
- 1.Lurie DJ, Bussell DM, Bell LH, Mallard JR. J Magn Reson. 1988;76:366–370. [Google Scholar]
- 2.Golman K, Leunbach I, Ardenkjaer-Larsen JH, Ehnholm GJ, Wistrand LG, Petersson JS, Järvi A, Vahasalo S. Acta Radiol. 1998;39:10–17. doi: 10.1080/02841859809172142. [DOI] [PubMed] [Google Scholar]
- 3.Overhauser AW. Phys Rev. 1953;92:411–415. [Google Scholar]
- 4.Lurie DJ, Nicholson I, Foster MA, Mallard JR. Phil Trans Roy Soc Lond Math Phys Sci. 1990;333:453–456. [Google Scholar]
- 5.Foster MA, Grigor'ev IA, Lurie DJ, Khramtsov VV, McCallum S, Panagiotelis I, Hutchison JM, Koptioug A, Nicholson I. Magn Reson Med. 2003;49:558–567. doi: 10.1002/mrm.10392. [DOI] [PubMed] [Google Scholar]
- 6.Krishna MC, English S, Yamada K, Yoo J, Murugesan R, Devasahayam N, Cook JA, Golman K, Ardenkjaer-Larsen JH, Subramanian S, Mitchell JB. Proc Natl Acad Sci U S A. 2002;99:2216–2221. doi: 10.1073/pnas.042671399. [DOI] [PMC free article] [PubMed] [Google Scholar]
- 7.Khramtsov VV, Caia GL, Shet K, Kesselring E, Petryakov S, Zweier JL, Samouilov A. J Magn Reson. 2010;202:267–273. doi: 10.1016/j.jmr.2009.11.017. [DOI] [PMC free article] [PubMed] [Google Scholar]
- 8.Efimova OV, Sun Z, Petryakov S, Kesselring E, Caia GL, Johnson D, Zweier JL, Khramtsov VV, Samouilov A. J Magn Reson. 2011;209:227–232. doi: 10.1016/j.jmr.2011.01.011. [DOI] [PMC free article] [PubMed] [Google Scholar]
- 9.Samouilov A, Efimova OV, Bobko AA, Sun Z, Petryakov S, Eubank TD, Trofimov DG, Kirilyuk IA, Grigor’ev IA, Takahashi W, Zweier JL, Khramtsov VV. Analyt Chem. 2014;86:1045–1052. doi: 10.1021/ac402230h. [DOI] [PMC free article] [PubMed] [Google Scholar]
- 10.Ardenkjaer-Larsen JH, Laursen I, Leunbach I, Ehnholm G, Wistrand LG, Petersson JS, Golman K. J Magn Reson. 1998;133:1–12. doi: 10.1006/jmre.1998.1438. [DOI] [PubMed] [Google Scholar]
- 11.Yong L, Harbridge J, Quine RW, Rinard GA, Eaton SS, Eaton GR, Mailer C, Barth E, Halpern HJ. J Magn Reson. 2001;152:156–161. doi: 10.1006/jmre.2001.2379. [DOI] [PubMed] [Google Scholar]
- 12.Anderson S, Golman K, Rise F, Wikström H, Wistrand LG. 5,530,140. US Patent. 1996
- 13.Elas M, Williams BB, Parasca A, Mailer C, Pelizzari CA, Lewis MA, River JN, Karczmar GS, Barth ED, Halpern HJ. Magn Reson Med. 2003;49:682–691. doi: 10.1002/mrm.10408. [DOI] [PubMed] [Google Scholar]
- 14.Dhimitruka I, Bobko AA, Hadad CM, Zweier JL, Khramtsov VV. J Am Chem Soc. 2008;130:10780–10787. doi: 10.1021/ja803083z. [DOI] [PMC free article] [PubMed] [Google Scholar]
- 15.Bobko AA, Dhimitruka I, Komarov DA, Khramtsov VV. Analyt Chem. 2012;84:6054–6060. doi: 10.1021/ac3008994. [DOI] [PMC free article] [PubMed] [Google Scholar]
- 16.Dhimitruka I, Bobko AA, Eubank TD, Komarov DA, Khramtsov VV. J Am Chem Soc. 2013;135:5904–5910. doi: 10.1021/ja401572r. [DOI] [PMC free article] [PubMed] [Google Scholar]
- 17.Shet K, Caia GL, Kesselring E, Samouilov A, Petryakov S, Lurie DJ, Zweier JL. J Magn Reson. 2010;205:202–208. doi: 10.1016/j.jmr.2010.04.015. [DOI] [PMC free article] [PubMed] [Google Scholar]
- 18.Petryakov S, Samouilov A, Kesselring E, Caia GL, Sun Z, Zweier JL. J Magn Reson. 2010;205:1–8. doi: 10.1016/j.jmr.2010.02.020. [DOI] [PMC free article] [PubMed] [Google Scholar]
- 19.Petryakov S, Samouilov A, Roytenberg M, Li H, Zweier JL. Magn Reson Med. 2006;56:654–659. doi: 10.1002/mrm.20992. [DOI] [PubMed] [Google Scholar]
- 20.Häussinger D. pH homeostasis: mechanisms and control. London: Academic Press; 1988. p. 479. [Google Scholar]
- 21.Estrella V, Chen T, Lloyd M, Wojtkowiak J, Cornnell HH, Ibrahim-Hashim A, Bailey K, Balagurunathan Y, Rothberg JM, Sloane BF, Johnson J, Gatenby RA, Gillies RJ. Cancer Res. 2013;73:1524–1535. doi: 10.1158/0008-5472.CAN-12-2796. [DOI] [PMC free article] [PubMed] [Google Scholar]
- 22.Kapur S, Wasserstrom JA, Kelly JE, Kadish AH, Aistrup GL. Am J Physiol Heart Circ Physio. 2009;296:H1491–H1512. doi: 10.1152/ajpheart.00539.2008. [DOI] [PubMed] [Google Scholar]
- 23.Beppu K, Sasaki T, Tanaka KF, Yamanaka A, Fukazawa Y, Shigemoto R, Matsui K. Neuron. 2014;81:314–320. doi: 10.1016/j.neuron.2013.11.011. [DOI] [PubMed] [Google Scholar]
- 24.Sue DY, Wasserman K, Moricca RB, Casaburi R. Chest. 1988;94:931–938. doi: 10.1378/chest.94.5.931. [DOI] [PubMed] [Google Scholar]
- 25.Kopple JD, Kalantar-Zadeh K, Mehrotra R. Kidney Intern. 2005;67:S21–S27. doi: 10.1111/j.1523-1755.2005.09503.x. [DOI] [PubMed] [Google Scholar]
- 26.Calorini L, Peppicelli S, Bianchini F. Experimental Oncology. 2012;34:79–84. [PubMed] [Google Scholar]
- 27.Zhang X, Lin Y, Gillies RJ. J Nucl Med. 2010;51:1167–1170. doi: 10.2967/jnumed.109.068981. [DOI] [PMC free article] [PubMed] [Google Scholar]
- 28.Wang L, Li C. J Mater Chem. 2011;21:15862–15871. [Google Scholar]
- 29.Macholl S, Morrison MS, Iveson P, Arbo BE, Andreev OA, Reshetnyak YK, Engelman DM, Johannesen E. Mol Imaging Biol. 2012;14:725–734. doi: 10.1007/s11307-012-0549-z. [DOI] [PMC free article] [PubMed] [Google Scholar]
- 30.Gillies RJ, Raghunand N, Garcia-Martin ML, Gatenby RA. IEEE Eng Med Biol Mag. 2004;23:57–64. doi: 10.1109/memb.2004.1360409. [DOI] [PubMed] [Google Scholar]
- 31.Kenwright AM, Kuprov I, De Luca E, Parker D, Pandya SU, Senanayake PK, Smith DG. Chem Commun. 2008:2514–2516. doi: 10.1039/b802838a. [DOI] [PubMed] [Google Scholar]
- 32.Gallagher FA, Kettunen MI, Day SE, Hu DE, Ardenkjaer-Larsen JH, Zandt R, Jensen PR, Karlsson M, Golman K, Lerche MH, Brindle KM. Nature. 2008;453:940–943. doi: 10.1038/nature07017. [DOI] [PubMed] [Google Scholar]
- 33.Khramtsov VV, Grigor'ev IA, Foster MA, Lurie DJ. Antiox Redox Signal. 2004;6:667–676. doi: 10.1089/152308604773934431. [DOI] [PubMed] [Google Scholar]
- 34.Goodwin J, Yachi K, Nagane M, Yasui H, Miyake Y, Inanami O, Bobko AA, Khramtsov VV, Hirata H. NMR Biomed. 2014;27:453–458. doi: 10.1002/nbm.3081. [DOI] [PMC free article] [PubMed] [Google Scholar]
- 35.Bobko AA, Eubank TD, Voorhees JL, Efimova OV, Kirilyuk IA, Petryakov S, Trofimov DG, Marsh CB, Zweier JL, Grigor'ev IA, Samouilov A, Khramtsov VV. Magn Reson Med. 2012;67:1827–1836. doi: 10.1002/mrm.23196. [DOI] [PMC free article] [PubMed] [Google Scholar]
- 36.Khramtsov VV. Curr Org Chem. 2005;9:909–923. [Google Scholar]
- 37.Koda S, Goodwin J, Khramtsov VV, Fujii H, Hirata H. Analyt Chem. 2012;84:3833–3837. doi: 10.1021/ac203415w. [DOI] [PMC free article] [PubMed] [Google Scholar]
- 38.Bobko AA, Dhimitruka I, Zweier JL, Khramtsov VV. Angew. Chem. Int. Edit. 2014;53:2735–2738. doi: 10.1002/anie.201310841. [DOI] [PMC free article] [PubMed] [Google Scholar]
- 39.Efimova OV, Caia GL, Sun Z, Petryakov S, Kesselring E, Samouilov A, Zweier JL. J Magn Reson. 2011;212:197–203. doi: 10.1016/j.jmr.2011.06.030. [DOI] [PMC free article] [PubMed] [Google Scholar]


