Abstract
Tau is a microtubule associated protein that is found primarily in neurons, and in pathological conditions such as Alzheimer disease (AD) it accumulates and contributes to the disease process. Since tau plays a fundamental role in the pathogenesis of AD and other tauopathies, and in AD mouse models reducing tau levels improves outcomes, approaches that facilitate tau clearance are being considered as therapeutic strategies. However, fundamental to the development of such interventions is a clearer understanding of the mechanisms that regulate tau clearance. Here we report a novel mechanism of tau degradation mediated by the co-chaperone BAG3. BAG3 has been shown to be an essential component of a complex that targets substrates to the autophagy pathway for degradation. In rat primary neurons, activation of autophagy by inhibition of proteasome activity or treatment with trehalose resulted in significant decreases in tau and phospho-tau levels. These treatments also induced an upregulation of BAG3. Proteasome inhibition activated JNK, which was responsible for the upregulation of BAG3 and increased tau clearance. Inhibiting JNK or knocking down BAG3 blocked the proteasome inhibition-induced decreases in tau. Further, BAG3 overexpression alone resulted in significant decreases in tau and phospho-tau levels in neurons. These results indicate that BAG3 plays a critical role in regulating the levels of tau in neurons, and interventions that increase BAG3 levels could provide a therapeutic approach in the treatment of AD.
Keywords: tau, BAG3, autophagy, co-chaperone, JNK, Alzheimer disease
Introduction
Tau is primarily a neuronal protein that regulates cytoskeletal dynamics, transport processes and synaptic function (Morris, et al., 2011). Maintaining appropriate levels of this protein through a balance of synthesis and degradation is crucial for the health of the cell. Aberrant posttranslational processing and accumulation of tau is involved in the pathogenesis of Alzheimer disease (AD), as well as other tauopathies. Impairment of the mechanisms responsible for the clearance of tau has been proposed to be a contributing factor in AD, and therefore understanding the degradative pathways responsible for the turnover of tau is of fundamental importance (Gotz, et al., 2013).
Macroautophagy (which will be henceforth referred to as autophagy), is constitutively active in neurons and is an integral factor in the homeostatic turnover of proteins (Boland, et al., 2008). In the case of soluble proteins autophagy adaptors, as well as chaperones and co-chaperones, often play an important role in targeting specific cargos to the autophagic machinery (Gamerdinger, et al., 2011). There is good evidence that tau is a substrate of autophagy and that soluble forms of the protein are selectively targeted to this degradative pathway by specific adaptor complexes. Recently we demonstrated that the autophagy adaptor protein NDP52 plays a role in targeting tau to degradation by autophagy (Jo, et al., 2014). However, this is likely not the only mechanism responsible for directing soluble tau species to autophagy.
Previously it was demonstrated that inhibiting the proteasome in rat cortical neurons activated autophagy and reduced tau levels (Kruger, et al., 2012), however the mechanisms responsible for directing tau to autophagy were not explored. Several studies have shown that proteasome inhibition results in an upregulation of the co-chaperone BAG3 (Liu, et al., 2013,Rapino, et al., 2014,Wang, et al., 2008). BAG3 has an AP-1 binding site in its promoter (Li, et al., 2013) and inhibition of the proteasome results in JNK activation (Wang, et al., 2009) and transcriptional upregulation of BAG3 (Wang, et al., 2008). BAG3 is part of a cell’s protein quality control mechanisms (Gamerdinger, et al., 2009) by facilitating the autophagic degradation of protein substrates (Behl, 2011,Carra, et al., 2008). Given this function of BAG3, it can be suggested that this co-chaperone may play a role in mediating the clearance of tau.
In this study we show that proteasome inhibition as well as trehalose, which stimulates autophagy in an mTOR-independent manner, decrease the levels of tau and phospho-tau in primary rat cortical neurons. Although it was previously demonstrated that these treatments reduce tau levels (Kruger, et al., 2012), the mechanisms involved were not explored. Here we show that concurrent with the decreases in tau levels, these treatments significantly increase BAG3. Proteasome inhibition-induced increases in BAG3 levels and tau clearance were blocked by addition of a JNK inhibitor. Knockdown of BAG3 also inhibited the proteasome inhibition-induced increases in tau degradation. Finally, overexpression of BAG3 in the rat primary neurons without additional treatments resulted in a significant reduction in tau levels. These findings clearly demonstrate that BAG3 plays a role in facilitating the clearance of soluble tau in neurons under conditions of stress such as proteasome inhibition, suggesting that interventions that enhance the expression of BAG3 may provide therapeutic benefits for AD and other tauopathies.
Materials and Methods
Reagents and Antibodies
Epoxomicin, MG132, and lactacystin were purchased from Cayman Chemical. SP600125 was purchased from Cell Signaling. Trehalose was purchased from Calbiochem. Bafilomycin A1 was purchased from LC Laboratories. Resazurin and Calcein-AM were purchased from VWR. The polyclonal tau antibody was purchased from Dako. 12E8 (pSer262) was a gift from P. Seubert (Prothena, Inc) and PHF-1 (pSer396/404) was a gift from P. Davies (The Feinstein Institute for Medical Research). The other antibodies used in the study were AT-180 (pThr231, Pierce), anti-LC3B (Cell Signaling), anti-HSPB8 (Cell Signaling), anti-BAG3 (Proteintech), anti-β-actin (Millipore), and anti-α-tubulin (Pierce Biotechnology).
Primary culture of rat cortical neurons and drug treatments
Cortical neurons were prepared from embryonic day 17-18 rats and cultured as described previously (Quintanilla, et al., 2012). In brief, the cortical tissues were collected from embryonic rat brain and meninges were removed under sterile conditions. The cortices were transferred into Trypsin-EDTA (0.05%) and digested for 25 min. The cortices were washed 3 times with MEM containing 5% FBS and triturated with a 10 ml pipette. Cells were counted and plated at 1.3 × 10⁵ / cm2 in MEM (with 5% FBS, 2 mM glutamine, 10 mM glucose). Medium was replaced with Neurobasal medium (Invitrogen) (with 0.5 mM glutamine, 250 μM glutamic acid, 2% B27) after 5 h. The medium was half changed with Neurobasal medium (with 0.5 mM glutamine, 2% B27) on day in vitro (DIV) 3 and DIV6. On DIV7, cultures were treated with vehicle (0.1% DMSO), epoxomicin (Epx, 8 nM), trehalose (Tre, 150 mM), MG132 (0.5 μM), lactacystin (Lacta, 10 μM) and/or SP600125 (Sp, 12.5 μ M) for 24 h followed by the indicated analyses. Except where otherwise indicated, Bafilomycin A1 (Baf, 10 nM) treatment alone or together with epoxomicin was for 4 h. All procedures were performed in compliance with the University of Rochester of health guidelines for the care and use of laboratory animals.
Measurement of cell viability
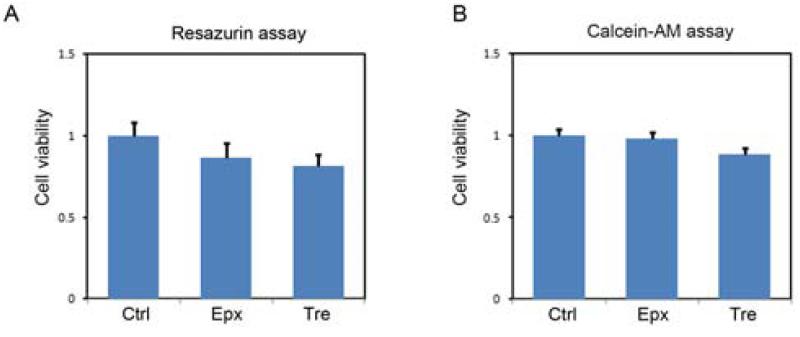
Neuronal viability was assessed using two methods. Cortical neuronal cultures were plated on 24-well plates and on DIV7 cells were treated as indicated and viability measured after 24 h. For the data shown in Figure 3A, neuronal viability was assayed by measuring the change in fluorescence intensity following the cellular reduction of resazurin to resorufin (O'Brien, et al., 2000). All experiments were performed in neurobasal medium at 37 °C. Cell viability was assessed incubating cells in 10% resazurin for 45 min at 37 °C, then measuring fluorescence at 540/590 nm (excitation/emission). This fluorescence was expressed as a percentage of that in control cells (which were in neurobasal medium only), after subtraction of background fluorescence. For the data shown in Figure 3B, neuronal viability was measured using Calcein-AM, which is taken up and hydrolyzed by an intracellular esterase in viable cells to yield a green fluorescent product. Cells were incubated with 2 μM Calcein-AM for 1 h at 37°C before fluorescence measurements (485/528 nm). Cell viability was expressed as a percentage of the value in untreated control culture. One-way ANOVA was used for statistical analysis, and significant differences in cell viability were determined by post hoc comparisons of means using the Bonferroni test.
FIGURE 3. Both epoxomicin and trehalose do not significantly affect neuronal survival.
DIV7 Rat primary neurons were treated with epoxomicin (Epx, 8nM) or trehalose (Tre, 150mM) for 24 h and viability was determined with the resazurin (A) or calcein-AM (B) assay as described under “Materials and Methods.” For resazurin assay n=5, for calcein-AM assay n=3.
Production of lentivirus particles and knockdown or overexpression of Bag3
BAG3-shRNA (5’-AAGGTTCAGACCATCTTGGAA-3’) and BAG3-scrRNA (5’-CAGTCGCGTTTGCGACTGG-3’) were cloned into the Psuper RNAi vector at the 3’ end of the H1 promoter using BglII and XhoI restriction enzymes. Both RNA (BAG3scr and BAG3sh) + H1 promoter cassettes were then amplified by PCR and isolated by gel electrophoresis. BAG3-shRNA +H1 as well as BAG3-scrRNA + H1 cassettes and FG12 lentiviral vector (Addgene.org) were digested with PacI and HpaI. The BAG3-shRNA + H1 cassette was ligated into the FG12 lentiviral vector as was the BAG3-scrRNA + H1 cassette. Both completed constructs were then transformed into chemically competent bacteria and then the plasmids were purified. For BAG3 overexpression, human BAG3 cDNA was purchased from Abgent (Accession BC006418). The human BAG3 portion was PCR amplified out of the pcDNA4/TO/myc-His A vector and inserted into FGB lentiviral vector (a derivative of the FG12 vector, gift from Dr. C. Proschel) at the AgeI and EcoRI sites. The construct was then transformed into chemically competent bacteria and the plasmids were purified. pPAX and VSV-G constructs were obtained from Addgene.org. The lentiviral particles were prepared as described previously (Salmon and Trono, 2006). Briefly, HEK-293TN cells were grown to 50% confluency in DMEM with 10% Fetalclone II in 150 mm culture dishes. Before transfection, the medium was changed to DMEM with 2% Fetalclone II. DNA (pPAX : VSV-G : shRNA/scrRNA vector [9 μg : 4.5 μg : 6 μg]) was transfected using jetPRIME® transfection reagent (PolyPlus). Twenty-four hours later, the medium was removed and fresh DMEM with 1% fetalclone II was added to the cells. The cells were placed in a 33°C incubator and 48 h later the medium, which contains the viral particles, was filtered through a 0.2 μM PES syringe filter and spun at 30,000 x g for 3h at 4°C. The viral particle pellets were resuspended in sterile 0.1% bovine serum albumin (BSA) in PBS at 1/50th of the original volume of media and aliquoted. The aliquots were snap-frozen in liquid nitrogen and stored in liquid nitrogen until use. For the BAG3 knockdown experiments the neurons were infected with lentivirus on DIV4 after the half-medium change by add in the virus particles to the medium at a 1:100 (viral suspension: neurobasal medium) ratio for 12 h. The transduction media was then fully replaced with 50% conditioned-50% fresh neurobasal medium (with 0.5 mM glutamine, 2% B27). Neurons were then treated as indicted on DIV9 and collected on DIV10. For the BAG3 overexpression studies, neurons were transduced on DIV2 and again on DIV4 and collected on DIV9 for analysis.
Immunoblotting
All immunoblotting procedures have been described elsewhere (Dolan and Johnson, 2010). Briefly, Cells were rinsed in ice-cold phosphate-buffered saline (PBS) and collected in lysis buffer, containing 0.5% NP-40, 150 mM NaCl, 10 mM Tris-Cl (pH 7.4), 1 mM EGTA, 1 mM EDTA, 1 mM phenylmethylsulphonyl fluoride, and 10 μg/ml each of aprotinin, leupeptin, and pepstatin. Samples were sonicated on ice and centrifuged at 13,200g for 20 min. Protein concentrations of supernatants were then determined by the bicinchoninic acid assay with BSA as a standard and samples were diluted to a final concentration of 1 mg/ml with 2x reducing stop buffer (0.25 M Tris-HCl, pH 6.8, 5 mM EDTA, 5 mM EGTA, 25 mM dithiothreitol, 2% SDS, 10% glycerol, and bromophenol blue as the tracking dye). Aliquots of 5-60 μg protein (depending on the protein to be detected) were subjected to 12% SDS–polyacrylamide gel electrophoresis. Separated proteins were transferred onto a nitrocellulose membrane. Blots were blocked in 5% nonfat dry milk in TBST (20 mM Tris-HCl, pH 7.6, 137 mM NaCl, 0.05% Tween 20) for 1 h at room temperature. The blots were then incubated overnight with the primary antibody. The membranes were then washed three times with TBST and incubated with HRP-conjugated secondary antibody for 1 h at room temperature. The membranes were rinsed three times for 30 min with TBST, followed by four quick rinses with distilled water, and developed with enhanced chemiluminescence as described previously(Thorpe and Kricka, 1986). Protein intensities were quantified using ImageJ 1.48v software. Data were evaluated for significance by Student’s t-test and one-way ANOVA.
Quantitative real-time PCR
Rat primary neurons were treated with vehicle, epoxomicin or trehalose as described above for 12 hr. Cells were collected, total RNA isolated and cDNA synthesized as previously described (Jo, et al., 2014). Quantitative real-time PCR (qRT-PCR) was performed using SYBR® Green real-time PCR master mix (Invitrogen) on a Bio-Rad IQ5 Real-Time PCR Detection System. Each reaction consisted of 10 μ L of cDNA product from the diluted reverse transcription reaction (x30), 2.5 μ M of primers (rat tau: forward primer 5’-AAC ATC CAT CAC AAG CCA GGA GGT -3’, reverse primer 5’-TGG GTG ATG TTA TCC AAG GAG CCA-3’(Jo, et al., 2014); rat 18sRNA forward primer 5’-CCG CAG CTA GGA ATA ATG GAA TAG GAC -3’, reverse primer 5’-GTT AGC ATG CCG AGA GTC TCG TTC-3’ (Tran and Keele, 2011) ), 12.5 μl of SYBR® Green real-time PCR master mix. The reactions were incubated in a 96-well plate at 95°C for 5 min, followed by 45 cycles of 95°C for 15 s, 60°C for 20 s and 72°C for 40 s. After the reactions were completed, the threshold was manually set and the threshold cycle (CT) was automatically recorded. The CT is defined as the fractional cycle number at which the fluorescence signal passes the fixed threshold. All reactions were run in three replicates for each sample.
Data processing and statistical analyses
Data plotting and statistical analysis were performed in Microsoft Excel 2010 and SPSS11.5. Data are given as mean ± S.E.M. Data groups were compared applying Students unpaired t-test for two groups or one-way ANOVA analysis with Dunnett's or Bonferroni's multiple comparison post-test for more than two groups. Differences were considered statistically significant when P < 0.05.
Results
Proteasome inhibition and trehalose decrease endogenous tau levels
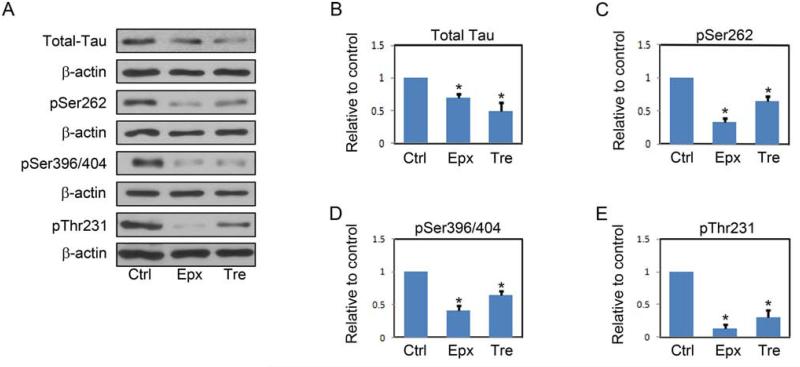
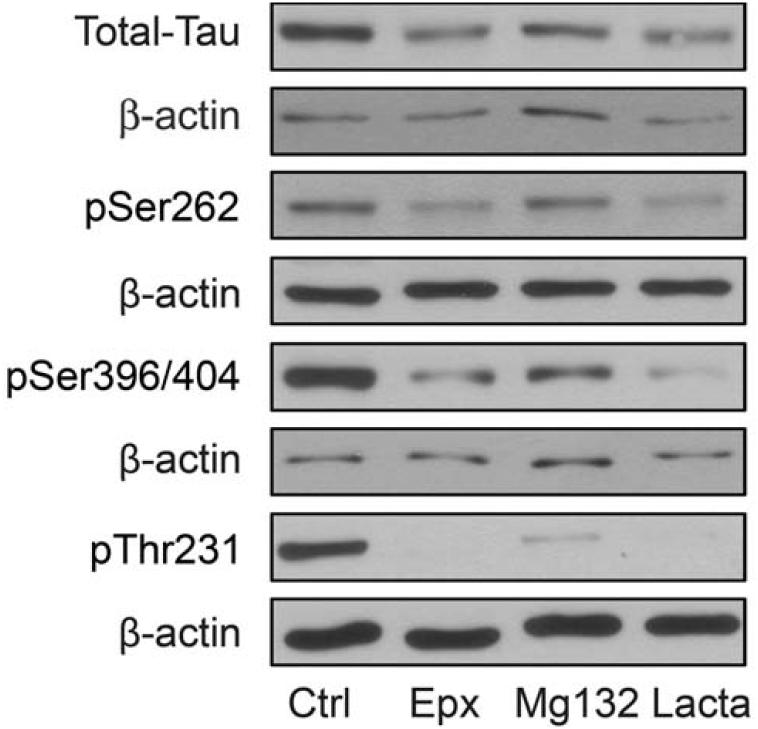
To determine the effects of proteasome inhibition or treatment with the disaccharide trehalose on endogenous tau levels, primary rat cortical neurons were treated with vehicle only or incubated with 8 nM epoxomicin or 150 mM trehalose for 24 h. The levels of total tau, as well as the levels of different phospho-tau species (12E8, pSer262; PHF-1, pSer396/404; AT180, pThr231) were then determined by immunoblotting. Representative immunoblots are shown in Figure 1A, and quantitative cumulative data are shown in Figures 1B-E. These data are in agreement with a previous study (Kruger, et al., 2012), and demonstrate that proteasome inhibition or trehalose treatment results in significant decreases in endogenous tau and phospho-tau levels. To demonstrate that the decrease in tau levels after epoxomicin treatment was mediated by proteasome inhibition and not a secondary effect of the drug; studies were carried out in which the neurons were incubated with MG132 or lactacystin, two additional proteasome inhibitors. These results (Figure 2) clearly demonstrate that all three proteasome inhibitors effectively reduce tau levels, suggesting the effect is from proteasome inhibition. To verify that proteasome inhibition and trehalose were not causing cell death, neurons were incubated with vehicle only or with 8 nM epoxomicin or 150 mM trehalose for 24 h prior to determining cell viability using two independent measures. The results of these studies show that neither treatment significantly compromised neuronal viability (Figure 3). As a final control neurons were treated as described above prior to measuring tau mRNA levels by qRT-PCR. These data show that tau mRNA levels were not altered by these treatments (supplementary Figure 1S).
FIGURE 1. Inhibition of the proteasome by epoxomicin or increasing autophagy with trehalose decreases tau levels.
A, Representative immunoblots of lysates from DIV7 primary neurons treated with vehicle only, epoxomicin (Epx, 8nM), or trehalose (Tre, 150mM) for 24 h.. Collected lysates were immunoblotted for total tau and for phosphorylated tau species. For phospho-tau, the 12E8 (pSer262), PHF-1 (pSer396/404) and AT-180 (pThr231) antibodies were used. The membranes were reprobed with a β-actin antibody as a loading control. B-E, shown is quantification of relative levels of tau remaining after treatment described in A. The amount of tau was normalized to β-actin levels and then expressed as the percentage compared with control. Data points are the mean±S.E.M from four independent experiments. *P<0.05.
FIGURE 2. Other typical proteasome inhibitors decrease tau levels.
Representative immunoblots of lysates from DIV7 primary neurons treated with epoxomicin (Epx, 8nM), MG132 (0.5μM), lactacystin (Lacta, 10μM) or vehicle for 24 h. Collected lysates were immunoblotted for total tau and phosphorylated tau species. For phospho-tau the 12E8 (pSer262), PHF-1 (pSer396/404) and AT-180 (pThr231) antibodies were used. The membranes were also reprobed with a β-actin antibody as a loading control.
Proteasome inhibition and trehalose increase autophagy and the expression of BAG3
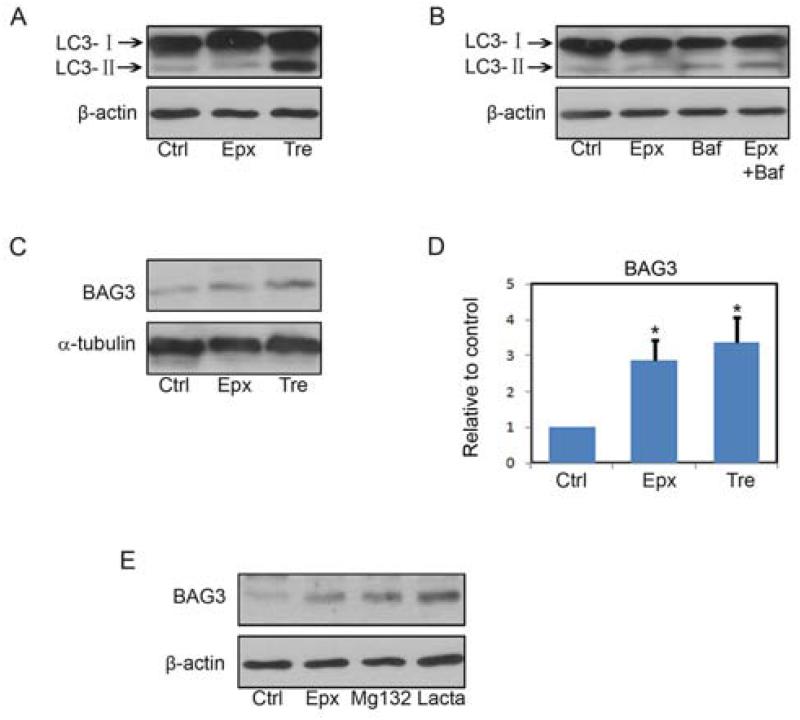
To assess the autophagy response in these paradigms, neurons were treated as in Figure 1 prior to blotting for LC3-II as an indicator of autophagosome formation (Kabeya, et al., 2000). Trehalose caused a robust increase in LC3-II, while no significant increase was observed following epoxomicin treatment (Figure 4A). This discrepancy may be related to the different extent of autophagic induction by each of the compounds. Given that autophagic flux is very efficient in neurons (Boland, et al., 2008), and LC3-II is degraded once the autophagosome fuses with the lysosome (Nixon, 2013), increases in LC3-II may not be detectable unless induction of autophagosome formation is very robust. To examine the possibility that epoxomicin can induce autophagy but not strongly enough to exceed the endogenous rate of autophagosome maturation, neurons were incubated with vehicle only or 8 nM epoxomicin for 20 h and subsequently 10 nM bafilomycin A1 was added for the last 4 h, to inhibit the acidification of lysosomes which decrease the activity of the acid hydrolases and prevents degradation of LC3-II. The results of these studies show that 4 h of incubation with bafilomycin A1 increased the levels of LC3-II, and that in the presence of epoxomicin there was a further increase (Figure 4B), indicating that proteasome inhibition does increase autophagy in neurons. We next examined the effects of epoxomicin and trehalose on the levels of BAG3. Incubation with either epoxomicin or trehalose resulted in significant increases in the levels of BAG3 (Figure 4C and D). Similar increases in BAG3 levels were observed when the cells were treated with MG132 or lactacystin (Figure 4E).
FIGURE 4. Proteasome inhibition and trehalose increase BAG3 levels.
A, Rat primary neurons (DIV7) were treated with vehicle, epoxomicin (Epx, 8nM), or trehalose (Tre, 150mM) for 24 h. LC3I/II levels were analyzed by immunoblotting. B, Rat primary neurons (DIV7) were treated with vehicle or epoxomicin (Epx 8nM) for 20 h, Bafilomycin A1 (Baf, 10 nM) was added to the vehicle and epoxomicin treated cells, or no further additions were made and the incubation continued for another 4 h. LC3I/II levels were analyzed by immunoblotting. C, The same treatment as in A but samples were immunoblotted for Bag3. D, Quantitative analysis showed that BAG3 protein levels were significantly increased by both epoxomicin (Epx, 8nM) and trehalose (Tre, 150mM). Bars represent mean±S.E.M. *P<0.05 compared with compared with the control after normalization to the corresponding actin levels. Student’s t-test, n=3. E, Rat primary neurons (DIV7) were treated with vehicle, epoxomicin (Epx 8nM), MG132 (0.5μM) or lactacystin (Lacta, 10μM) for 24 h. BAG3 levels were determined by immunoblotting.
Proteasome inhibition-induced increases in BAG3 levels and tau clearance are dependent on JNK activation
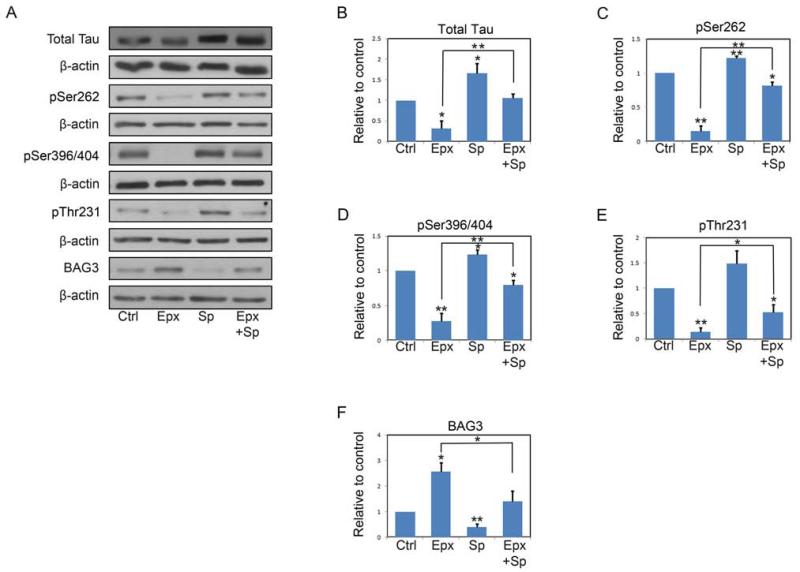
Previous studies in non-neuronal cells have shown that proteasome inhibition results in JNK activation (Wang, et al., 2009) and subsequently upregulation of BAG3 (Liu, et al., 2013). To determine if the upregulation of BAG3 and increased clearance of tau in response to proteasome inhibition was dependent on JNK activation in neurons, we used the selective JNK inhibitor SP600125 (Wang, et al., 2009,Yang, et al., 2004). Neurons were incubated with vehicle or epoxomicin alone or in combination with 12.5 μM SP600125 for 24 h prior to determination of tau and BAG3 levels. Interestingly, JNK inhibition alone resulted in significant increases in tau and phospho-tau species, and a significant decrease in BAG3 levels. Further, SP600125 significantly attenuated the upregulation of BAG3 in response to epoxomicin and the decreases in tau levels (Figure 5A-F).
FIGURE 5. JNK inhibitor SP600125 decreases the expression of BAG3 and inhibits epoxomicin induced tau clearance.
A, Representative immunoblots of lysates from DIV7 primary neurons treated with vehicle only, epoxomicin (Epx, 8nM), SP600125 (Sp, 12.5 μM) or epoxomicin plus SP600125 (Epx+Sp) for 24 h. Collected lysates were immunoblotted for total tau, phosphorylated tau species and BAG3. For phospho-tau, the 12E8 (pSer262), PHF-1 (pSer396/404) and AT-180 (pThr231) antibodies were used. The membranes were reprobed with a β-actin antibody as a loading control. B-F, shown is quantification of relative levels of tau and BAG3 remaining after treatment described in A. The amount of tau was normalized to β-actin levels and then expressed as the percentage compared with control. Data points are the mean±S.E.M from four independent experiments. *P<0.05, **P<0.01.
BAG3 mediates the clearance of tau
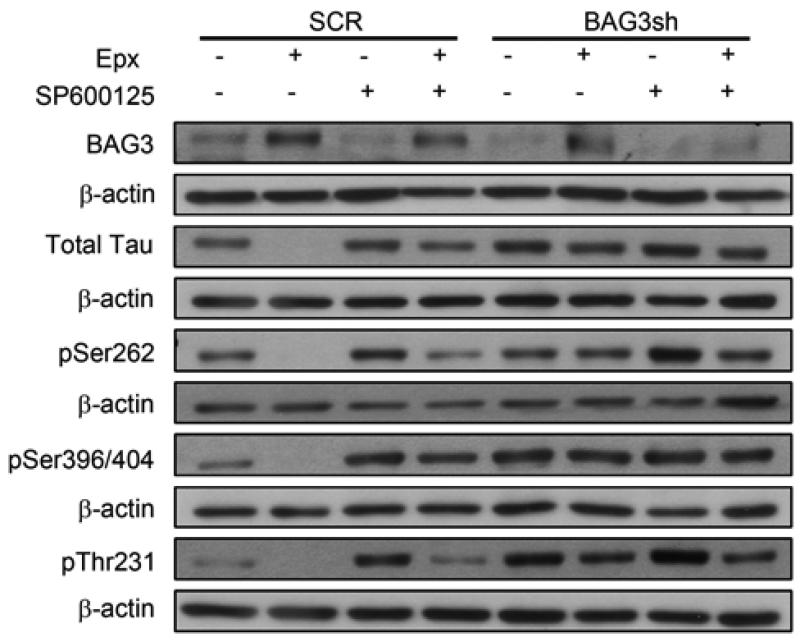
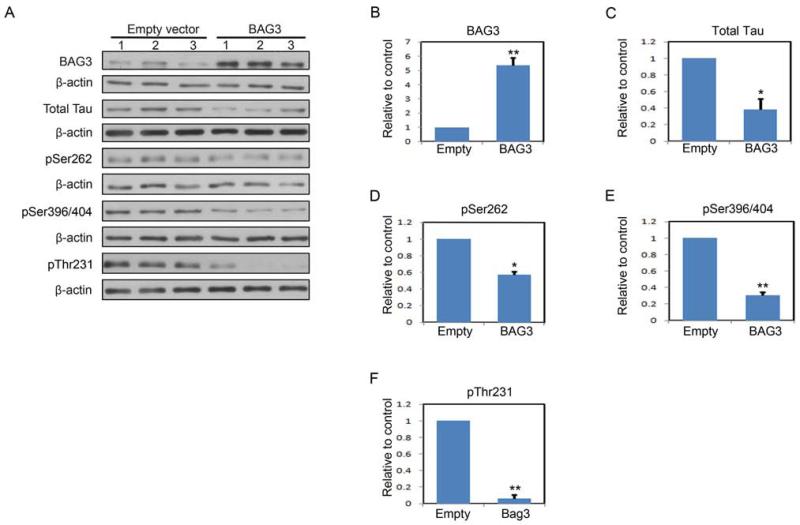
To demonstrate that BAG3 plays an essential role in the clearance of tau in response to proteasome inhibition, neurons were transduced with a BAG3-shRNA or a control BAG3-scrRNA lentivirus. The data shown in Figure 6 indicate that knockdown of BAG3 prevents the proteasome inhibition-induced decrease in tau. To further demonstrate that BAG3 mediates the clearance of tau, neurons were transduced with a BAG3 expression lentiviral vector or control empty lentiviral vector followed by analyses of BAG3 and tau levels. Figure 7A shows samples from 3 separate experiments, and quantitation of the data are shown in Figures 7B-F. These data clearly demonstrate that increased expression of BAG3 independent of any other treatment results in a significant decrease in tau and phospho-tau levels.
FIGURE 6. BAG3 is required for epoxomicin-induced tau clearance.
Representative immunoblots of lysates from DIV7 primary neurons infected with either a scramble (SCR) or BAG3 shRNA virus were treated with vehicle only, epoxomicin (Epx, 8nM), SP600125 (Sp, 12.5 μM) or epoxomicin plus SP600125 (Epx+Sp) for 24 h. Total protein extracts were analyzed for total tau and for phosphorylated tau species. For phospho-tau, the 12E8 (pSer262), PHF-1 (pSer396/404) and AT-180 (pThr231) antibodies were used. Figures are representative of n=3.
FIGURE 7. Increased BAG3 results in increased tau clearance.
A, Immunoblots of lysates from DIV7 primary neurons infected with either an empty or human BAG3 expression lentivirus vector. Total protein extracts were analyzed for total tau and for phosphorylated tau species. For phospho-tau, the 12E8 (pSer262), PHF-1 (pSer396/404) and AT-180 (pThr231) antibodies were used. B-F, shown is quantification of relative levels of tau remaining after infection described in A. The amount of tau was normalized to β-actin levels and then expressed as the percentage compared with control. Data points are the mean±S.E.M from three independent experiments. *P<0.05, **P<0.01.
Discussion
In this study we show for the first time that BAG3 plays a role in facilitating the clearance of endogenous, soluble tau in neurons. BAG3 is a member of the BAG family of co-chaperones, which in humans has 6 members. All BAG proteins contain at least one “BAG domain” which facilitates interaction with hsp70 (Takayama and Reed, 2001). Early work focused on the role that BAG proteins play in regulating cell signaling pathways (Takayama and Reed, 2001), however more recent studies have shown that BAG proteins are also involved in protein quality control mechanisms (Kalia, et al., 2010). For example, BAG1 associates with the 26S proteasome and may serve as a link between the chaperone and ubiquitin-proteasome complexes (Luders, et al., 2000). BAG2 interacts with CHIP and inhibits the ubiquitylation of substrates by this E3 ligase (Dai, et al., 2005). BAG5 interacts with parkin and negatively regulates E3 ligase activity (Kalia, et al., 2004) and BAG3 has been reported to stimulate the autophagic clearance of polyQ constructs (Carra, et al., 2008). These and other studies provide clear evidence that BAG proteins are involved in regulating protein clearance mechanisms.
BAG proteins have been previously implicated in modulating the clearance of tau through the proteasome. One study provided evidence that the BAG2/hsp70 complex is tethered to the microtubule and can “capture” tau and deliver it to the proteasome for non-ubiquitin dependent degradation. When COS-7 cells transfected with tau and BAG2 were treated with a proteasome inhibitor BAG2-mediated clearance of tau was inhibited (Carrettiero, et al., 2009). In contrast, we found that in primary neurons proteasome inhibition actually promoted tau degradation and that this was dependent on BAG3. These data may suggest that in neurons the effects of BAG3 in the modulation of the clearance of tau may predominate. In another study BAG1 was shown to interact with tau in an hsp70-dependent manner, and decreasing BAG1 levels resulted in decreases in total tau levels, with increases in the phosphorylation of the tau that remained. Overexpression of BAG-1 in P19 cells increased tau levels, and in an in vitro assay BAG-1 in combination with hsp70 inhibited degradation of tau by the 20S proteasome. It is unclear why increased expression of BAG-1 result in decreased tau degradation, although the authors suggested it could be due to BAG-1 facilitating the refolding of tau and downregulating the pathway that leads to degradation (Elliott, et al., 2007). This same group also reported that an isoform of BAG-1, BAG-1M is increased in the hippocampi of AD patients (Elliott, et al., 2009). In contrast to these studies we found that increasing BAG3 levels in primary neurons alone resulted in a significant decrease in total and phospho-tau levels. These data suggest that BAG1 and BAG3 may be playing complimentary roles in regulating tau levels.
There are studies suggesting BAG1 and BAG3 may work in a coordinated fashion to mediate quality control mechanisms in the cell and the contribution of each to protein turnover is a function of age and stress conditions (Gamerdinger, et al., 2011). When the levels of BAG1 and BAG3 were compared in young (3 mo) vs old (24 mo) mouse cerebella, it was found that BAG1 levels were relatively higher in the young animals, while in the older animals BAG3 levels were significantly higher. These total tissue level differences in BAG1/BAG3 expression as a function of age were due to changes in the protein level in neurons and not astrocytes (Gamerdinger, et al., 2009). BAG3 plays a role in selective autophagy, while other studies have shown that BAG1 facilitates the degradation of ubiquitylated substrates by the proteasome (Behl, 2011,Gamerdinger, et al., 2011). Thus it has been suggested that the upregulation of BAG3 and relative decrease in BAG1 during aging may be due an increased need for autophagic mechanisms in older cells which are subjected greater cellular stress. In addition, proteasome function declines during aging (Chondrogianni and Gonos, 2005) which would result in an increase dependence on autophagy as a protein clearance mechanism. Decreases in proteasome activity result in significant cell stress due in part to accumulation of misfolded proteins in the endoplasmic reticulum (ER) which leads to the unfolded protein response (UPR) and JNK activation (Ding, et al., 2007). Interestingly, activation of JNK results in increased BAG3 levels (Wang, et al., 2008) which then facilitates selective autophagy processes as a protective measure against the stressor.
There is growing evidence that BAG3 plays a role in directing proteins to selective autophagy. BAG3 interacts with HspB8 to direct polyQ constructs (Carra, et al., 2008), mutant SOD1 and a truncated form of TDP-43 (Crippa, et al., 2010) to the autophagy pathway. There is also data to suggest the targeting of substrates to autophagy by BAG3 involves autophagy adaptors such as p62 which can interact directly with LC3-II and facilitate docking of the cargo carrying complex (Gamerdinger, et al., 2009). In this study we clearly demonstrate that BAG3 plays a crucial role in facilitating the clearance of tau in neurons. Our data strongly suggest that BAG3 facilitates tau clearance by increasing targeting to selective autophagy. It can be speculated that this may be an important mechanism for regulation of tau levels and the removal of stress-modified tau species as BAG3 levels are increased in response to stressors that increase JNK activity (Li, et al., 2013,Liu, et al., 2013). During normal aging BAG3 levels are increased (Gamerdinger, et al., 2011) thus maintaining tau proteostasis. However in AD these increases in BAG3 levels may be insufficient to clear pathological tau species and this could contribute to tau accumulation. Therefore approaches that result in increased tau levels may be of therapeutic benefit for the treatment of AD and warrants further exploration.
Supplementary Material
Inhibition of proteasome activity or trehalose treatment in rat primary neurons results in a significant decrease in tau and phospho-tau levels.
Inhibition of proteasome activity or trehalose treatment in rat primary neurons results in an upregulation of BAG3 and autophagy.
Overexpression of BAG3 results in significantly decreases in tau and phospho-tau levels in neurons.
BAG3 plays a critical role in regulating the levels of tau in neurons.
Acknowledgements
This work was supported by NIH grant NS076789. We would like to thank Dr. C. Proschel for the FG12 and FIGB vectors, Dr. P. Davies for PHF-1 and Dr. P. Seubert for 12E8. We would also like to thank Dr. Robert Mooney for use of the Bio-Rad IQ5 Real-Time PCR Detection System and Adrianne Chesser for her comments on the manuscript.
The source of funding is NIH grant NS076789.
The data presented in this manuscript is not published or submitted elsewhere.
All authors approve of the procedures and have read and approved the manuscript.
Footnotes
Publisher's Disclaimer: This is a PDF file of an unedited manuscript that has been accepted for publication. As a service to our customers we are providing this early version of the manuscript. The manuscript will undergo copyediting, typesetting, and review of the resulting proof before it is published in its final citable form. Please note that during the production process errors may be discovered which could affect the content, and all legal disclaimers that apply to the journal pertain.
The authors have no conflicts to disclose.
Appendix A. Supplementary data
Supplementary data associated with this article can be found in the online version, at:
References
- Behl C. BAG3 and friends: co-chaperones in selective autophagy during aging and disease. Autophagy. 2011;7(7):795–8. doi: 10.4161/auto.7.7.15844. doi:10.4161/auto.7.7.15844. [DOI] [PubMed] [Google Scholar]
- Boland B, Kumar A, Lee S, Platt FM, Wegiel J, Yu WH, Nixon RA. Autophagy induction and autophagosome clearance in neurons: relationship to autophagic pathology in Alzheimer's disease. The Journal of neuroscience : the official journal of the Society for Neuroscience. 2008;28(27):6926–37. doi: 10.1523/JNEUROSCI.0800-08.2008. doi:10.1523/JNEUROSCI.0800-08.2008. [DOI] [PMC free article] [PubMed] [Google Scholar]
- Carra S, Seguin SJ, Lambert H, Landry J. HspB8 chaperone activity toward poly(Q)-containing proteins depends on its association with Bag3, a stimulator of macroautophagy. The Journal of biological chemistry. 2008;283(3):1437–44. doi: 10.1074/jbc.M706304200. doi:10.1074/jbc.M706304200. [DOI] [PubMed] [Google Scholar]
- Carrettiero DC, Hernandez I, Neveu P, Papagiannakopoulos T, Kosik KS. The cochaperone BAG2 sweeps paired helical filament-insoluble tau from the microtubule. The Journal of neuroscience : the official journal of the Society for Neuroscience. 2009;29(7):2151–61. doi: 10.1523/JNEUROSCI.4660-08.2009. doi:10.1523/JNEUROSCI.4660-08.2009. [DOI] [PMC free article] [PubMed] [Google Scholar]
- Chondrogianni N, Gonos ES. Proteasome dysfunction in mammalian aging: steps and factors involved. Experimental gerontology. 2005;40(12):931–8. doi: 10.1016/j.exger.2005.09.004. doi:10.1016/j.exger.2005.09.004. [DOI] [PubMed] [Google Scholar]
- Crippa V, Sau D, Rusmini P, Boncoraglio A, Onesto E, Bolzoni E, Galbiati M, Fontana E, Marino M, Carra S, Bendotti C, De Biasi S, Poletti A. The small heat shock protein B8 (HspB8) promotes autophagic removal of misfolded proteins involved in amyotrophic lateral sclerosis (ALS) Hum Mol Genet. 2010;19(17):3440–56. doi: 10.1093/hmg/ddq257. doi:10.1093/hmg/ddq257. [DOI] [PubMed] [Google Scholar]
- Dai Q, Qian SB, Li HH, McDonough H, Borchers C, Huang D, Takayama S, Younger JM, Ren HY, Cyr DM, Patterson C. Regulation of the cytoplasmic quality control protein degradation pathway by BAG2. The Journal of biological chemistry. 2005;280(46):38673–81. doi: 10.1074/jbc.M507986200. doi:10.1074/jbc.M507986200. [DOI] [PubMed] [Google Scholar]
- Ding WX, Ni HM, Gao W, Yoshimori T, Stolz DB, Ron D, Yin XM. Linking of autophagy to ubiquitin-proteasome system is important for the regulation of endoplasmic reticulum stress and cell viability. The American journal of pathology. 2007;171(2):513–24. doi: 10.2353/ajpath.2007.070188. doi:10.2353/ajpath.2007.070188. [DOI] [PMC free article] [PubMed] [Google Scholar]
- Dolan PJ, Johnson GV. A caspase cleaved form of tau is preferentially degraded through the autophagy pathway. The Journal of biological chemistry. 2010;285(29):21978–87. doi: 10.1074/jbc.M110.110940. doi:10.1074/jbc.M110.110940. [DOI] [PMC free article] [PubMed] [Google Scholar]
- Elliott E, Laufer O, Ginzburg I. BAG-1M is up-regulated in hippocampus of Alzheimer's disease patients and associates with tau and APP proteins. Journal of neurochemistry. 2009;109(4):1168–78. doi: 10.1111/j.1471-4159.2009.06047.x. doi:10.1111/j.1471-4159.2009.06047.x. [DOI] [PubMed] [Google Scholar]
- Elliott E, Tsvetkov P, Ginzburg I. BAG-1 associates with Hsc70.Tau complex and regulates the proteasomal degradation of Tau protein. The Journal of biological chemistry. 2007;282(51):37276–84. doi: 10.1074/jbc.M706379200. doi:10.1074/jbc.M706379200. [DOI] [PubMed] [Google Scholar]
- Gamerdinger M, Carra S, Behl C. Emerging roles of molecular chaperones and co-chaperones in selective autophagy: focus on BAG proteins. Journal of molecular medicine. 2011;89(12):1175–82. doi: 10.1007/s00109-011-0795-6. doi:10.1007/s00109-011-0795-6. [DOI] [PubMed] [Google Scholar]
- Gamerdinger M, Hajieva P, Kaya AM, Wolfrum U, Hartl FU, Behl C. Protein quality control during aging involves recruitment of the macroautophagy pathway by BAG3. The EMBO journal. 2009;28(7):889–901. doi: 10.1038/emboj.2009.29. doi:10.1038/emboj.2009.29. [DOI] [PMC free article] [PubMed] [Google Scholar]
- Gotz J, Xia D, Leinenga G, Chew YL, Nicholas H. What Renders TAU Toxic. Frontiers in neurology. 2013;4:72. doi: 10.3389/fneur.2013.00072. doi:10.3389/fneur.2013.00072. [DOI] [PMC free article] [PubMed] [Google Scholar]
- Jo C, Gundemir S, Pritchard S, Jin YN, Rahman I, Johnson GV. Nrf2 reduces levels of phosphorylated tau protein by inducing autophagy adaptor protein NDP52. Nature communications. 2014;5:3496. doi: 10.1038/ncomms4496. doi:10.1038/ncomms4496. [DOI] [PMC free article] [PubMed] [Google Scholar]
- Kabeya Y, Mizushima N, Ueno T, Yamamoto A, Kirisako T, Noda T, Kominami E, Ohsumi Y, Yoshimori T. LC3, a mammalian homologue of yeast Apg8p, is localized in autophagosome membranes after processing. The EMBO journal. 2000;19(21):5720–8. doi: 10.1093/emboj/19.21.5720. doi:10.1093/emboj/19.21.5720. [DOI] [PMC free article] [PubMed] [Google Scholar]
- Kalia SK, Kalia LV, McLean PJ. Molecular chaperones as rational drug targets for Parkinson's disease therapeutics. CNS & neurological disorders drug targets. 2010;9(6):741–53. doi: 10.2174/187152710793237386. [DOI] [PMC free article] [PubMed] [Google Scholar]
- Kalia SK, Lee S, Smith PD, Liu L, Crocker SJ, Thorarinsdottir TE, Glover JR, Fon EA, Park DS, Lozano AM. BAG5 inhibits parkin and enhances dopaminergic neuron degeneration. Neuron. 2004;44(6):931–45. doi: 10.1016/j.neuron.2004.11.026. doi:10.1016/j.neuron.2004.11.026. [DOI] [PubMed] [Google Scholar]
- Kruger U, Wang Y, Kumar S, Mandelkow EM. Autophagic degradation of tau in primary neurons and its enhancement by trehalose. Neurobiol Aging. 2012;33(10):2291–305. doi: 10.1016/j.neurobiolaging.2011.11.009. doi:10.1016/j.neurobiolaging.2011.11.009. [DOI] [PubMed] [Google Scholar]
- Li C, Li S, Kong DH, Meng X, Zong ZH, Liu BQ, Guan YF, Du ZX, Wang HQ. BAG3 is upregulated by c-Jun and stabilizes JunD. Biochimica Et Biophysica Acta-Molecular Cell Research. 2013;1833(12):3346–54. doi: 10.1016/j.bbamcr.2013.10.007. doi:DOI 10.1016/j.bbamcr.2013.10.007. [DOI] [PubMed] [Google Scholar]
- Liu BQ, Du ZX, Zong ZH, Li C, Li N, Zhang Q, Kong DH, Wang HQ. BAG3-dependent noncanonical autophagy induced by proteasome inhibition in HepG2 cells. Autophagy. 2013;9(6):905–16. doi: 10.4161/auto.24292. doi:10.4161/auto.24292. [DOI] [PMC free article] [PubMed] [Google Scholar]
- Luders J, Demand J, Hohfeld J. The ubiquitin-related BAG-1 provides a link between the molecular chaperones Hsc70/Hsp70 and the proteasome. The Journal of biological chemistry. 2000;275(7):4613–7. doi: 10.1074/jbc.275.7.4613. [DOI] [PubMed] [Google Scholar]
- Morris M, Maeda S, Vossel K, Mucke L. The many faces of tau. Neuron. 2011;70(3):410–26. doi: 10.1016/j.neuron.2011.04.009. doi:10.1016/j.neuron.2011.04.009. [DOI] [PMC free article] [PubMed] [Google Scholar]
- Nixon RA. The role of autophagy in neurodegenerative disease. Nature medicine. 2013;19(8):983–97. doi: 10.1038/nm.3232. doi:10.1038/nm.3232. [DOI] [PubMed] [Google Scholar]
- O'Brien J, Wilson I, Orton T, Pognan F. Investigation of the Alamar Blue (resazurin) fluorescent dye for the assessment of mammalian cell cytotoxicity. Eur J Biochem. 2000;267(17):5421–6. doi: 10.1046/j.1432-1327.2000.01606.x. [DOI] [PubMed] [Google Scholar]
- Quintanilla RA, Dolan PJ, Jin YN, Johnson GV. Truncated tau and Abeta cooperatively impair mitochondria in primary neurons. Neurobiol Aging. 2012;33(3):e25–35. doi: 10.1016/j.neurobiolaging.2011.02.007. 619. doi:10.1016/j.neurobiolaging.2011.02.007. [DOI] [PMC free article] [PubMed] [Google Scholar]
- Rapino F, Jung M, Fulda S. BAG3 induction is required to mitigate proteotoxicity via selective autophagy following inhibition of constitutive protein degradation pathways. Oncogene. 2014;33(13):1713–24. doi: 10.1038/onc.2013.110. doi:10.1038/onc.2013.110. [DOI] [PubMed] [Google Scholar]
- Salmon P, Trono D. Production and titration of lentiviral vectors. Curr Protoc Neurosci. 2006:21. doi: 10.1002/0471142301.ns0421s37. Chapter 4, Unit 4. doi:10.1002/0471142301.ns0421s37. [DOI] [PubMed] [Google Scholar]
- Takayama S, Reed JC. Molecular chaperone targeting and regulation by BAG family proteins. Nature cell biology. 2001;3(10):E237–41. doi: 10.1038/ncb1001-e237. doi:10.1038/ncb1001-e237. [DOI] [PubMed] [Google Scholar]
- Thorpe GH, Kricka LJ. Enhanced chemiluminescent reactions catalyzed by horseradish peroxidase. Methods Enzymol. 1986;133:331–53. doi: 10.1016/0076-6879(86)33078-7. [DOI] [PubMed] [Google Scholar]
- Tran L, Keele NB. P-chlorophenylalanine increases glutamate receptor 1 transcription in rat amygdala. Neuroreport. 2011;22(15):758–61. doi: 10.1097/WNR.0b013e32834ae2a1. doi:10.1097/WNR.0b013e32834ae2a1. [DOI] [PMC free article] [PubMed] [Google Scholar]
- Wang HQ, Liu BQ, Gao YY, Meng X, Guan Y, Zhang HY, Du ZX. Inhibition of the JNK signalling pathway enhances proteasome inhibitor-induced apoptosis of kidney cancer cells by suppression of BAG3 expression. Br J Pharmacol. 2009;158(5):1405–12. doi: 10.1111/j.1476-5381.2009.00455.x. doi:10.1111/j.1476-5381.2009.00455.x. [DOI] [PMC free article] [PubMed] [Google Scholar]
- Wang HQ, Liu HM, Zhang HY, Guan YF, Du ZX. Transcriptional upregulation of BAG3 upon proteasome inhibition. Biochemical and Biophysical Research Communications. 2008;365(2):381–5. doi: 10.1016/j.bbrc.2007.11.001. doi:DOI 10.1016/j.bbrc.2007.11.001. [DOI] [PubMed] [Google Scholar]
- Yang Y, Ikezoe T, Saito T, Kobayashi M, Koeffler HP, Taguchi H. Proteasome inhibitor PS-341 induces growth arrest and apoptosis of non-small cell lung cancer cells via the JNK/c-Jun/AP-1 signaling. Cancer Sci. 2004;95(2):176–80. doi: 10.1111/j.1349-7006.2004.tb03200.x. [DOI] [PMC free article] [PubMed] [Google Scholar]
Associated Data
This section collects any data citations, data availability statements, or supplementary materials included in this article.


