

Summary
Hypermethylation-mediated tumor suppressor gene (TSG) silencing is a central epigenetic alteration in RAS-dependent tumorigenesis. Ten-eleven translocation (TET) enzymes can depress DNA methylation by hydroxylation of 5-methylcytosine (5mC) bases to 5-hydroxymethylcytosine (5hmC). Here we report that suppression of TET1 is required for KRAS-induced DNA hypermethylation and cellular transformation. In distinct non-malignant cell lines, oncogenic KRAS promotes transformation by inhibiting TET1 expression via the ERK signaling pathway. This reduces chromatin occupancy of TET1 at TSG promoters, lowers levels of 5hmC, and increases levels of 5mC and 5mC-dependent transcriptional silencing. Restoration of TET1 expression by ERK pathway inhibition or ectopic TET1 reintroduction in KRAS-transformed cells reactivates TSGs and inhibits colony formation. KRAS knockdown increases TET1 expression and diminishes colony-forming ability, while KRAS/TET1 double knockdown bypasses the KRAS dependence of KRAS-addicted cancer cells. Thus, suppression of TET1-dependent DNA demethylation is critical for KRAS-mediated transformation.
Introduction
RAS proteins are a family of 21 kDa proteins that accomplish signal transduction by coupling receptor engagement to downstream pathway activation (Pylayeva-Gupta et al., 2011). RAS proteins, which include KRAS, HRAS and NRAS, share similar functions in regulating cell proliferation, differentiation and survival. Gain-of-function mutations in RAS genes are found frequently in malignancies (D'Arcangelo and Cappuzzo, 2012; Pylayeva-Gupta et al., 2011), and multiple malignancies depend on RAS mutations to maintain malignant phenotypes (Chin et al., 1999). Hyperactive RAS drives constitutive signaling through the RAF-MEK-ERK and PI3K-AKT cascades (Schubbert et al., 2007) driving cellular transformation (Greig et al., 1985). Accordingly, targeting RAS-related signaling pathways is a central goal of molecular oncology (Downward, 2003).
Cytosine methylation of CpG dinucleotides is an epigenetic modification that cells use to regulate gene expression, largely to promote transcriptional silencing. Focal hypermethylation of tumor suppressor genes (TSGs) accompanied by genomic hypomethylation are epigenetic hallmarks of malignancy (Belinsky, 2004; Jones and Baylin, 2002; Wu et al., 2014). Three DNA methyltransferases (DNMTs), the de novo enzymes DNMT3A and DNMT3B and the maintenance enzyme DNMT1, are responsible for establishment and maintenance of DNA methylation patterns (Bestor, 2000). Aberrant overexpression of DNMTs contributes to cancer-associated DNA hypermethylation (Belinsky et al., 1996; Wu et al., 1993). Inhibition of DNMTs in cancers can revert DNA hypermethylation, reactivate silenced TSGs and diminish tumorigenicity (Laird et al., 1995; Suzuki et al., 2004), indicating that DNA methylation is reversible by modulating DNMT activities.
Previous studies showed that RAS-driven transformation drives methylation-associated silencing of TSGs to inhibit apoptosis and promote cell proliferation (Borrello et al., 1987; Gazin et al., 2007; Patra, 2008; Serra et al., 2014). RAS activation was shown to trigger DNA hypermethylation through elevated DNMT transcription (Bakin and Curran, 1999; Chang et al., 2006; Gazin et al., 2007; Pruitt et al., 2005) and the initiation of what has been termed an elaborate pathway involving components of the RAF-MEK-ERK and PI3K-AKT cascades that positions Dnmt1 on particular TSG promoters such as Fas (Gazin et al., 2007). In addition, inhibition of DNMT expression has been shown to be sufficient to reverse RAS-induced hypermethylation and transformation (MacLeod and Szyf, 1995; Ramchandani et al., 1997). Thus, DNMT enzymes have been considered the principal mediators of DNA methylation driven by RAS activation and have been targeted by early stage drug discovery efforts (Fagan et al., 2013a; 2013b; Huang et al., 2013). While positively acting factors that promote Ras-dependent DNA methylation have been identified by genetic selections (Gazin et al., 2007; Serra et al., 2014), factors that must be inhibited for Ras-driven DNA methylation remain elusive.
Recent findings demonstrated that the ten-eleven translocation (TET) family proteins, including TET1, TET2 and TET3, function as iron and α-ketoglutarate-dependent 5-methylcytosine dioxygenases that convert 5-methylcytosine (5mC) bases to 5-hydroxymethylcytosine (5hmC) bases (Ito et al., 2010; Tahiliani et al., 2009). 5hmC is proposed as an intermediate in passive and active DNA demethylation (Kohli and Zhang, 2013; Pastor et al., 2013; Wu and Zhang, 2014; 2010), suggesting novel mechanisms to regulate methylation dynamics and gene reactivation. Presence of 5hmC in genomic DNA impairs maintenance methylation by preventing DNMT1 recognition (Hashimoto et al., 2012; Valinluck and Sowers, 2007), thereby facilitating passive demethylation linked to the semiconservative nature of DNA replication. In addition, 5hmC can be further converted by TET proteins to 5-formylcytosine (5fC) and 5-carboxycytosine (5caC) (Ito et al., 2011), which are replaced by cytosine through DNA repair processes (Cortellino et al., 2011; He et al., 2011) and may play roles in gene expression apart from demethylation. TET-mediated active demethylation is independent of DNA replication (Pastor et al., 2013; Wu and Zhang, 2010).
TET proteins and 5hmC modifications are abundant in mouse embryonic stem cells (ESC) (Ficz et al., 2012; Ito et al., 2010; Koh et al., 2011) and in the brain (Guo et al., 2011; Kaas et al., 2013; Kriaucionis and Heintz, 2009). In addition to the roles of TET-driven DNA modification in ESC and neuronal systems, emerging evidence suggests that TET-dependent DNA demethylation plays a role in tumorigenesis. In solid tumors, expression of TET genes is dramatically reduced and is highly associated with reduced 5hmC (Ko et al., 2010; Lian et al., 2012; Yang et al., 2013) and hypermethylation-mediated silencing of TSGs (Hsu et al., 2012; Sun et al., 2013). Moreover, TET2 is frequently mutated with impaired catalytic activity in myeloid cancers (Abdel-Wahab et al., 2009; Delhommeau et al., 2009; Ko et al., 2010). These data suggest that TET genes themselves may have TSG activity. However, whether TET-mediated DNA demethylation plays a role in RAS-induced DNA hypermethylation and malignant transformation remains unclear.
In this study, we used two non-malignant cell lines to dissect KRAS-driven transformation and the establishment of cancer-associated DNA hypermethylation. Unexpectedly, instead of an increase in DNMT expression, we discovered that TET1 is transcriptional suppressed via the RAS-ERK signaling pathway. Regional decreases in 5hmC were accompanied by TSG promoter hypermethylation and gene silencing. Forced TET1 reintroduction not only reactivated silenced TSGs but also abolished KRAS-induced colony-forming ability. Moreover, KRAS depletion by small interfering RNA (siRNA) up-regulated TET1 expression in cancer cells. Strikingly, knocking down TET1 restores colony-forming ability to KRAS depleted cells, indicating that TET1 suppression is sufficient to maintain KRAS transformation several steps downstream from KRAS. These data establish that impaired TET1-mediated DNA demethylation is a critical mediator of tumor initiation and maintenance in KRAS-transformed cells.
Results
Oncogenic KRAS Expression is Sufficient to Transform Non-Malignant HBEC3 Cells
Expression of KRAS-G12V has the ability to transform a broad spectrum of non-malignant cells (Patra, 2008; Pylayeva-Gupta et al., 2011). However, a previous report showed that overexpression of KRAS-G12V was insufficient to transform immortalized human bronchial epithelial cells (HBEC3), apparently due to lack of induction of downstream signals (Sato et al., 2006). To probe the biological effect of oncogenic KRAS in HBEC3 cells, we established stable cell lines with KRAS-G12V marked by an N-terminal myc-tag. After serial dilution to select monoclonal cell lines, three KRAS clones (R1, R2 and R3) and two vector control clones (V1 and V2) were selected and examined by western blot (Figure 1A). In R1, R2 and R3 cells, expression of myc-KRAS was about 30% of the level of endogenous RAS proteins. However, as shown in Figure 1A, expression of KRAS-G12V was associated with activation of AKT and ERK as evidenced by a 2-fold induction of phospho-AKT and 6-fold induction of phospho-ERK.
Figure 1. Oncogenic KRAS Expression is Sufficient to Transform Non-Malignant HBEC3 Cells.
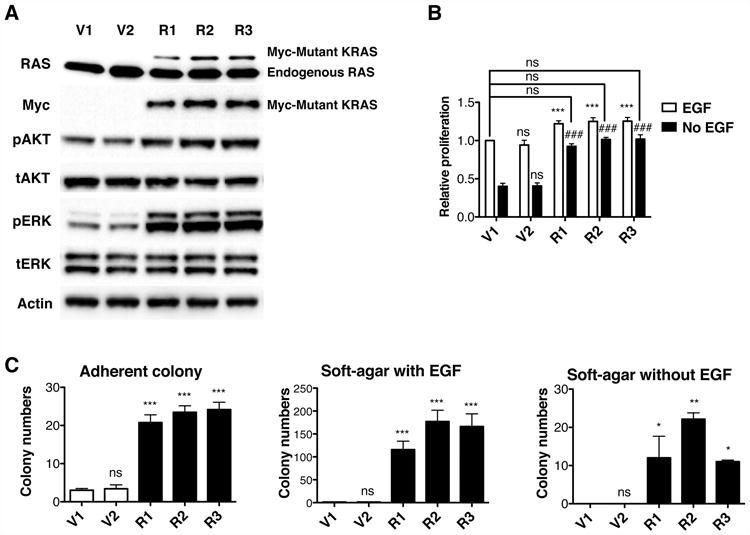
(A) HBEC3 stable clones were established to express oncogenic KRAS. Protein levels of RAS, phospho-AKT (pAKT), total-AKT (tAKT), phospho-ERK (pERK) and total-ERK (tERK) were determined by western blotting.
(B) KRAS cell lines without EGF proliferate as well as vector cell lines with EGF. Data were normalized to V1 cells with EGF.
(C) Adherent and soft-agar colony formation indicate that KRAS transforms HBEC3 cells. All data are presented as mean ± SD. ns, no significant difference; *, p < 0.05; **, p < 0.01; ***, p < 0.001 in comparison to V1 cells. ns, no significant difference; ###, p < 0.001 in comparison to V1 cells without EGF.
We found a 23% increase in cell proliferation in KRAS cells under growth factor-rich conditions (Figure 1B). Additionally, because KRAS is an effector of epidermal growth factor (EGF) receptor signaling (Sharma et al., 2007; Yarden and Sliwkowski, 2001), we considered whether expression of hyperactive KRAS could enable bypass of EGF-dependent growth of HBEC3 cells (Sato et al., 2006) (Figure 1B). Without EGF supplementation, vector cells lost half their proliferation ability. However, KRAS cell lines without EGF supplementation showed the same extent of proliferation as vector cells with EGF, indicating a KRAS-mediated bypass. To further evaluate the oncogenic properties of KRAS cells, adherent and soft-agar colony formation were assessed. As shown in Figure 1C, adherent colony formation was increased 6-fold in KRAS cells while soft-agar colony formation in the presence of EGF was increased more than 100-fold. Without EGF supplementation, KRAS cells produced more than 10 colonies while vector cells produced none. In summary, HBEC3 cells can be used to dissect hyperproliferation, EGF-independence and colony formation driven by KRAS mutation.
Oncogenic KRAS Expression Causes Hypermethylation-Mediated Silencing of TSGs and Loss of Imprinting
Aberrant DNA methylation is a hallmark of cancer and RAS activation has been shown to drive DNA hypermethylation during tumorigenesis (Bakin and Curran, 1999; Chang et al., 2006; Gazin et al., 2007; Pruitt et al., 2005). Although there was no increase in 5mC content in KRAS-transformed cells (Figures 2A and S1A), we surveyed 24 TSGs reported to be silenced by promoter hypermethylation in lung cancers (Belinsky, 2004) (Table S1) by quantitative methylated DNA immunoprecipitation (MeDIP). An increase in promoter methylation was found in five of the 24 TSGs in KRAS cells, including DAPK (Kim et al., 2001), MGMT (Pulling et al., 2003), DUOX1 (Luxen et al., 2008), TIMP3 (Bachman et al., 1999) and GATA4 (Guo et al., 2004) (Figures 2B and S1B). Bisulfite sequencing indicated 2 to 20-fold methylation increases in the promoters of DAPK, MGMT and DUOX1 in R2 cells in comparison to V1 cells (Figure 2C), demonstrating that KRAS activation caused DNA hypermethylation of specific TSGs. Because promoter hypermethylation is highly associated with transcriptional silencing, we analyzed expression of the five target genes. As shown in Figures 2D and S1C, the mRNA levels of all five genes were markedly decreased in KRAS cells.
Figure 2. Oncogenic KRAS Expression Causes Hypermethylation-Mediated Silencing of TSGs.
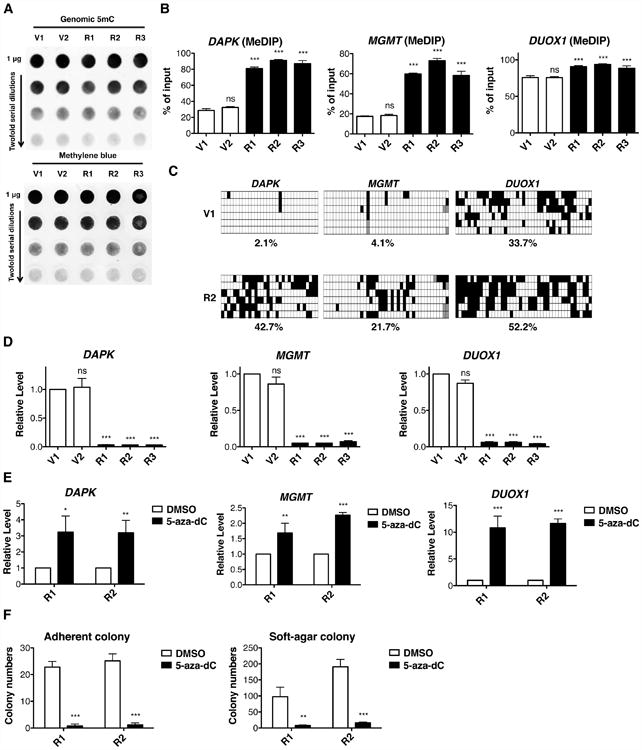
(A) Genomic 5mC levels in HBEC3-derived cell lines were measured by DNA dot blot in the top panel. The blot was stained with methylene blue as a loading control in the bottom panel.
(B) Methylation levels of promoter-associated CpG islands were analyzed by qPCR.
(C) 5mC bisulfite sequencing of DAPK, MGMT and DUOX1 promoters. White squares represent non-methylated cytosines and black squares represent methylated cytosines in CpG sites. The percentages of methylated CpG from 6 independent clones are indicated.
(D) mRNA levels were analyzed by RT-qPCR and normalized to V1 cells.
(E) After 100 nM 5-aza-dC treatment for 5 days, mRNA levels were analyzed by RT-qPCR and normalized to the DMSO treated control.
(F) Adherent and soft-agar colony formation after 5-aza-dC treatment indicate that KRAS transformation depends on the hypermethylation phenotype. Cells were pre-treated with 100 nM 5-aza-dC for 5 days and then tested for colony formation. All data are presented as mean ± SD. ns, no significant difference; *, p< 0.05; **, p < 0.01; ***, p < 0.001 in comparison to V1 cells or DMSO treated control. See also Figure S1.
In addition to hypermethylation of TSGs, loss of imprinting is an additional type of dysregulated methylation in malignancies. We focused on the well-studied H19 imprinting control region (H19 ICR) (Steenman et al., 1994) to examine the methylation change associated with KRAS activation. Bisulfite sequencing indicated that the methylation level of H19 ICR was increased from 40.7% in V1 cells to 65.9% in R2 cells (Figure S1D). Hypermethylation of H19 ICR was accompanied by silenced H19 and activated IGF2 expression (Figure S1E).
To test whether promoter hypermethylation was sufficient to suppress gene expression and whether methylation-associated gene silencing was reversible, we treated cells with the demethylating agent, 5-aza-deoxycytidine (5-aza-dC) (Jones et al., 1982) (Figure S1F). As shown in Figures 2E and S1G, 5-aza-dC reactivated expression of all five TSGs and reverted expression of H19 and IGF2, indicating that transcriptional silencing is driven by promoter hypermethylation and is reversible. In addition, 5-aza-dC pre-treatment decimated colony formation in KRAS-transformed cells compared to DMSO treatment (Figure 2F). Thus, HBEC3 cellular transformation depends upon an altered methylation status that is commonly found in human cancers.
KRAS Negatively Regulates TET1 Expression through the ERK Signaling Pathway
DNMT enzymes, especially DNMT1, are considered the major positive effectors of RAS-induced hypermethylation (Gazin et al., 2007; Patra, 2008). Thus, we tested whether levels of DNMT1 were increased in KRAS cells. However, we did not observe any difference of DNMT1 expression between vector and KRAS cells at the mRNA or protein levels (Figure 3A). We further examined the other two DNA methyltransferases, DNMT3A and DNMT3B (Figure S2A). There was a slight decrease in DNMT3B expression in KRAS cells, which would not be expected to cause DNA hypermethylation. In addition to increased expression of one or more DNA methyltransferases, another possible mechanism to cause hypermethylation is suppression of enzymes that act on 5mC substrates, such as TET1, TET2 and TET3. As shown in Figures 3A and S2A, KRAS activation nearly extinguished expression of TET1 at the mRNA and protein levels. No change was observed in TET2 and TET3 expression.
Figure 3. KRAS Negatively Regulates TET1 Expression through the ERK Signaling Pathway.
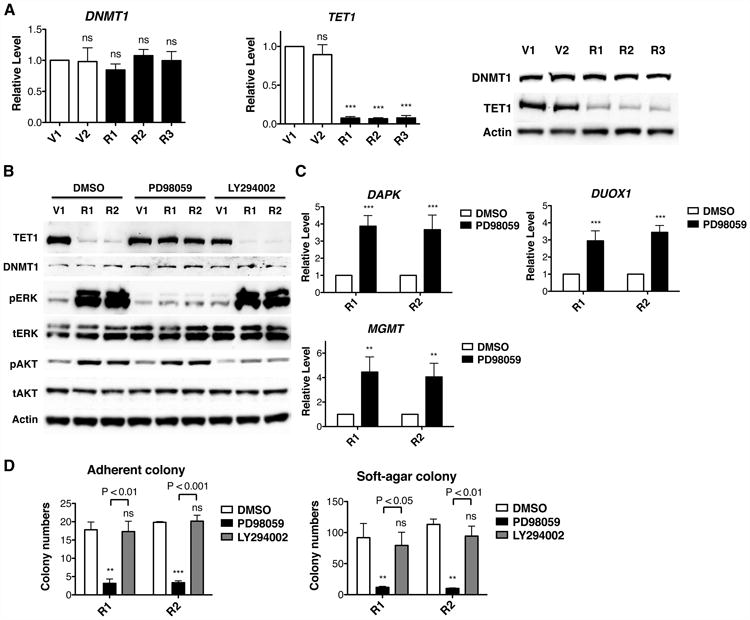
(A) In HBEC3 cell lines, mRNA levels of DNMT1 and TET1 were determined by RT-qPCR and normalized to V1 cells. Protein levels were determined by western blotting.
(B) After 30 μM ERK pathway inhibitor PD98059 or 2 μM AKT pathway inhibitor LY294002 treatment for 6 days, protein levels of DNMT1 and TET1 were determined by western blotting.
(C) After ERK pathway inhibition, mRNA levels were analyzed by RT-qPCR and normalized to DMSO control.
(D) Adherent and soft-agar colony formation after ERK pathway or AKT pathway inhibition indicate that cellular transformation is mediated by the ERK pathway. Cells were pre-treated with inhibitors for 6 days and then tested for colony formation. All data are presented as mean ± SD. ns, no significant difference; **, p < 0.01; ***, p < 0.001 in comparison to V1 cells or DMSO treated control. See also Figure S2.
RAS activation drives two major protein kinase cascades, namely the PI3K/AKT and RAF/MEK/ERK cascades. To dissect the mediator of TET1 extinguishment by KRAS, we used specific inhibitors of PI3K and MEK. Because these signals are essential for cell survival, we used low doses, i.e., 2 μM PI3K inhibitor LY294002 (Vlahos et al., 1994) or 30 μM MEK inhibitor PD98059 (Dudley et al., 1995) to titrate KRAS signaling without reducing cell viability (Figure S2B). As shown in Figure 3B, TET1 expression in KRAS cells treated with the MEK inhibitor was restored to the same level as in vector cells. However, no effect was observed after partial inhibition of PI3K. Moreover, DNMT1 expression was not altered by either inhibitor (Figure 3B). Remarkably, ERK pathway inhibition caused up to 3-fold transcriptional increases of DAPK, MGMT, DUOX1 and H19 in KRAS cells (Figures 3C and S2C). Because epigenetic silencing of TSGs is essential for KRAS-mediated transformation in HBEC3 cells, we tested whether KRAS-mediated transformation was also regulated by one or the other kinase cascade. KRAS cells pre-treated with PD98059 or LY294002 for 6 days were subjected to adherent and soft-agar colony-forming assays. As shown in Figure 3D, ERK pathway inhibition significantly reduced colony-forming abilities of KRAS cells, while AKT pathway inhibition had no effect. Together, our data indicate that KRAS decreases TET1 transcription and promotes cellular transformation through the ERK pathway.
Reduction of TET1 and 5hmC are Responsible for KRAS-Mediated DNA Hypermethylation and Cellular Transformation
To clarify the consequence of TET1 reduction in KRAS cells, we examined 5hmC levels in the genome. Though there was no dramatic change in genomic 5hmC in vector and KRAS cells (Figures 4A and S3A), we used 5-hydroxymethylcytosine DNA immunoprecipitation (hMeDIP) to discover a 2 to 4-fold decrease in 5hmC in promoter regions of the five TSGs and H19 ICR that are hypermethylated by mutant KRAS expression (Figures 4B and S3B). Because traditional bisulfite sequencing cannot distinguish 5mC and 5hmC (Huang et al., 2010), we used Tet-assisted bisulfite sequencing (TAB-seq) (Yu et al., 2012) to identify specific 5hmC modifications in V1 and R2 cells. As shown in Figure 4C, 5hmC modifications were decreased from 8.1% (V1) to 4.5 % (R2) in the DAPK promoter, 9.8% (V1) to 3.9% (R2) in the MGMT promoter and 9.2% (V1) to 4.1% (R2) in the DUOX1 promoter, respectively.
Figure 4. Reduction of TET1 and 5hmC are Responsible for KRAS-Mediated DNA Hypermethylation and Cellular Transformation.
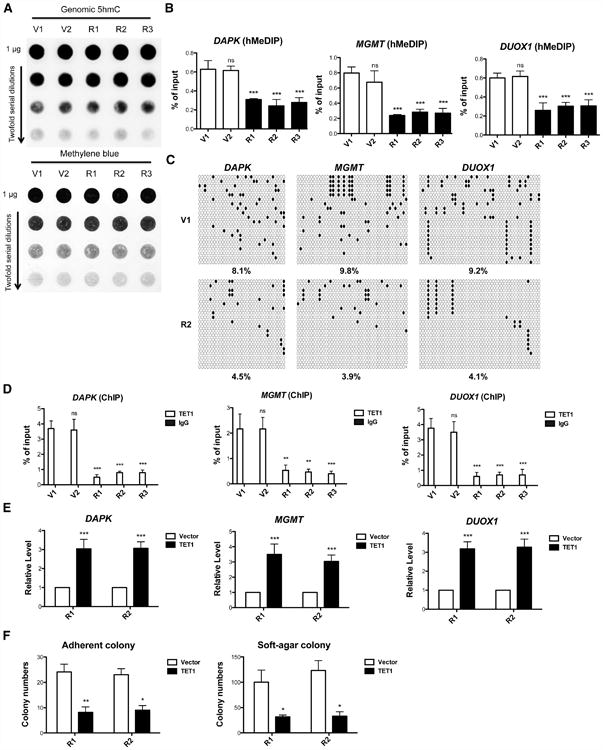
(A) Genomic 5hmC levels in HBEC3-drived cell lines were measured by DNA dot blot in the top panel. The blot was stained with methylene blue as a loading control in the bottom panel.
(B) Hydroxymethylation levels of promoter-associated CpG islands were analyzed by qPCR.
(C) TAB-seq 5hmC of DAPK, MGMT and DUOX1 promoters. White circles represent cytosines or 5mC, black circles represent 5hmC in CpG sites, and Xs represent undetermined sites. The percentages of 5hmC from 20 independent clones are indicated.
(D) TET1 chromatin occupancy was analyzed using TET1 ChIP and qPCR.
(E) After TET1 viral transduction for 6 days, mRNA levels were analyzed by RT-qPCR and normalized to vector viral transduction control.
(F) Adherent and soft-agar colony formation after TET1 viral transduction indicate that TET1 re-expression reverts the transformed phenotype. All data are presented as mean ± SD. ns, no significant difference; *, p < 0.05; **, p < 0.01;***, p < 0.001 in comparison to V1 cells or vector virus control. See also Figure S3.
Given the finding that KRAS activation inhibits TET1 expression, the decrease of 5hmC in targeted genes might be due to reduced chromatin association with TET1. By TET1 chromatin immunoprecipitation (ChIP), we found that TET1 chromatin occupancy was reduced at the examined promoters in all KRAS cell lines (Figures 4D and S3C). To test whether loss of TET1 was responsible for gene silencing and cellular transformation observed in KRAS cells, we reintroduced TET1 expression in KRAS cell lines. As shown in Figures S3D and S3E, we ectopically expressed the catalytic domain of human TET1 (aa 1418-2136) (Guo et al., 2011) at a mRNA level equivalent that of endogenous TET1 in vector cells without affecting cell viability. This reactivated expression of all five TSGs and H19, which had been silenced by KRAS (Figures 4E and S3F). Moreover, as shown in Figure 4F, restoration of TET1 expression also suppressed KRAS-mediated transformation. Thus, TET1 suppression is required to maintain TSG silencing and transformation in KRAS cells.
Loss of Tet1 Expression is Associated with Decreased 5hmC and Increased 5mC Content in Kras-Transformed NIH3T3 Cells
Previous work showed that oncogenic Kras expression caused methylation-mediated silencing of TSGs in NIH3T3 mouse fibroblast cells in a manner that depends on Dnmt1 and other positively acting factors (Gazin et al., 2007). We hypothesized that suppression of Tet1-mediated DNA modifications might underlie Kras-driven hypermethylation in this system. As shown in Figures 5A and S4A, Dnmt1 was increased 2-fold in oncogenic Kras-transformed NIH3T3 (Kras) cells. In addition, Tet1 was decreased 2-fold while Tet2 and Tet3 were also modestly down-regulated in Kras cells. At the genome level, Kras activation resulted in a nearly 2-fold increase in 5mC accompanied by a 30% decrease of 5hmC levels (Figure 5B). Kras-dependent hypermethylation and silencing in NIH3T3 cells includes the Fas, Sfrp1 and Lox genes (Gazin et al., 2007). As shown in Figures 5C and S4A, the mRNA expression of these genes was nearly extinguished by Kras activation. To gain further insight into the dynamics of 5mC and 5hmC, we compared 5mC and 5hmC content in promoter regions in parallel. Our data showed intense methylation increases from 0% 5mC to 80% 5mC concomitant with a 4-fold 5hmC decrease in Kras cells compared to NIH3T3 cells (Figures 5D, S4B and S4C). As shown in Figures 5E and S4D, bisulfite sequencing and TAB-seq indicated that there were few or no 5mC modifications in the examined promoters in NIH3T3 cells while Ras activation up-regulated methylation to greater than 70%. Increases in 5mC were accompanied by up to 3-fold reduction in 5hmC in Kras cells. The Fas promoter has been reported to be unmethylated in nontransformed NIH3T3 cells (Gazin et al., 2007). However, all 7 interrogated CpG sties in the Fas promoter were 95-100% in the 5hmC state in NIH3T3 cells. Upon Kras transformation, these CpG sites were converted to 50-100% 5mC. These data indicate that NIH3T3 cells employ a strong Tet-dependent DNA modification activity to maintain TSG promoters at low methylation status. Consistent with this interpretation, Tet1 is highly associated with Fas, Sfrp1 and Lox promoters in NIH3T3 cells and is largely evacuated from them in Kras-transformed NIH3T3 cells (Figures 5F and S4E).
Figure 5. Loss of Tet1 Expression is Associated with Decreased 5hmC and Increased 5mC Content in Kras-Transformed NIH3T3 Cells.
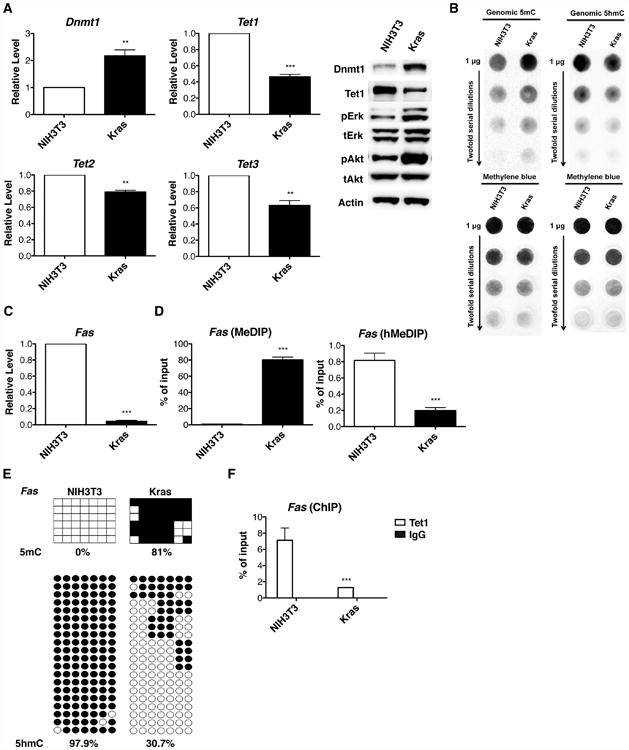
(A) mRNA levels were determined by RT-qPCR and normalized to NIH3T3 cells. Protein levels were determined by western blotting.
(B) Genomic 5mC and 5hmC levels were measured by DNA dot blot in the top panel. The blots were stained with methylene blue as a loading control in the bottom panel.
(C) Fas expression was determined by RT-qPCR and normalized to NIH3T3 cells.
(D) Methylation and hydroxymethylation levels of Fas promoter were analyzed by qPCR.
(E) Bisulfite sequencing for 5mC and TAB-seq for 5hmC. The percentages of 5mC or 5hmC were indicated.
(F) Tet1 chromatin occupancy was analyzed using Tet1 ChIP and qPCR. The data indicate that Kras transformation depresses Fas expression by converting the promoter from a 5hmC state to a 5mC state due to depletion of Tet1. All data are presented as mean ± SD. **, p < 0.01; ***, p < 0.001 in comparison to NIH3T3 cells. See also Figure S4.
As shown in Figures 6A and S5A, Erk pathway activity is required for down-regulation of Tet1 in Kras-transformed NIH3T3 cells. Erk inhibition reactivated silenced TSGs (Figure 6B) and reduced colony formation (Figures S5B and 6C), while Akt inhibition showed no significant changes (Figures 6B and 6C). Reintroduction of TET1 expression was also sufficient to increase expression of Fas, Sfrp1 and Lox nearly 3-fold without affecting cell viability (Figure 6D and S5C). By reintroducing TET1 expression to Kras-transformed NIH3T3 cells, we greatly reduced colony-forming ability (Figure 6E).
Figure 6. Kras Promotes Transformation by Inhibiting Tet1 Expression.
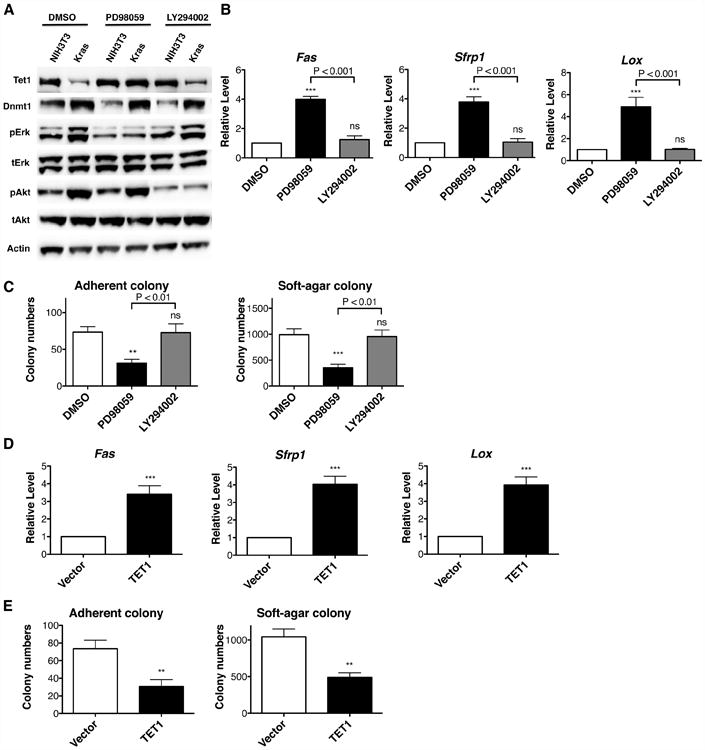
(A) After 25 μM PD98059 or 2.5 μM LY294002 treatment for 4 days, protein levels of Dnmt1 and Tet1 were determined by western blotting.
(B) After Erk pathway or Akt pathway inhibition, mRNA levels were analyzed by RT-qPCR and normalized to DMSO control.
(C) Adherent and soft-agar colony formation after Erk pathway or Akt pathway inhibition indicate that cellular transformation is mediated by the ERK pathway in KRAS-transformed NIH3T3 cells. Cells were pre-treated with inhibitors for 4 days and then tested for colony formation.
(D) After TET1 viral transduction for 6 days, mRNA levels were analyzed by RT-qPCR and normalized to vector viral transduction control.
(E) Adherent and soft-agar colony formation after TET1 viral transduction indicate that TET1 re-expression reverts Kras-mediated malignancy. All data are presented as mean ± SD. ns, no significant difference; **, p < 0.01; ***, p < 0.001 in comparison to DMSO treated control or vector virus control. See also Figure S5.
Thus, in NIH3T3 and HBEC3 cells, KRAS activation suppresses TET1 transcription through the ERK signaling pathway. Reduction of TET1 led to decreased 5hmC, increased 5mC levels, and silencing of TSG promoter regions associated with reduced TET1 chromatin occupancy. Restoration of TET1 by ERK pathway inhibition or reintroducing TET1 gene expression reactivated silenced TSGs and reduced colony formation. These data identify TET1 in an essential axis of KRAS-ERK-TSG hypermethylation in the transition from an immortalized cell to a malignant cell.
Knocking down TET1 restores colony-forming ability to KRAS-depleted H1299 cancer cells
To dissect the connection between KRAS and TET1 in fully malignant cells, we used siRNA treatment to determine TET1 expression after KRAS depletion in H1299 lung cancer cells. After treating with KRAS siRNA for 2 days, TET1 mRNA and protein increased nearly 2-fold compared to mock-transfected cells or control siRNA, while DNMT1 expression stayed the same (Figure 7A). As shown in Figure S6A, KRAS-mediated suppression of TET1 was also observed in HepG2 hepatoma cancer cells, indicating that negative regulation by KRAS of TET1 is not cell type-specific. In agreement with our findings in HBEC3 and NIH3T3 cells, inhibition of the ERK signaling pathway reactivated TET1 expression, whereas AKT pathway inhibition failed to produce this effect (Figure 7B). Moreover, KRAS knockdown inhibited colony-forming activities (Figure 7C), indicating that H1299 cells are addicted to KRAS expression. To determine whether TET1 is functionally important in KRAS knockdown cells, we treated cells with KRAS siRNA, TET1 siRNA or combined KRAS and TET1 siRNAs. We confirmed that TET1 knockdown was sufficient to prevent TET1 induction in KRAS/TET1 double knockdown cells (Figure 7D and S6B). Colony-forming assays performed with siRNA-treated cells indicated that TET1 knockdown in a cell depleted for KRAS is sufficient to rescue the inhibition of colony formation by loss of KRAS (Figure 7E). Thus, despite the many targets downstream of the PI3K-AKT and RAF-MEK-ERK cascades and the complexity of RAS-driven oncogenesis, TET1 suppression is sufficient to restore H1299 malignancy.
Figure 7. Knocking down TET1 restores transformation to KRAS-depleted H1299 cancer cells.
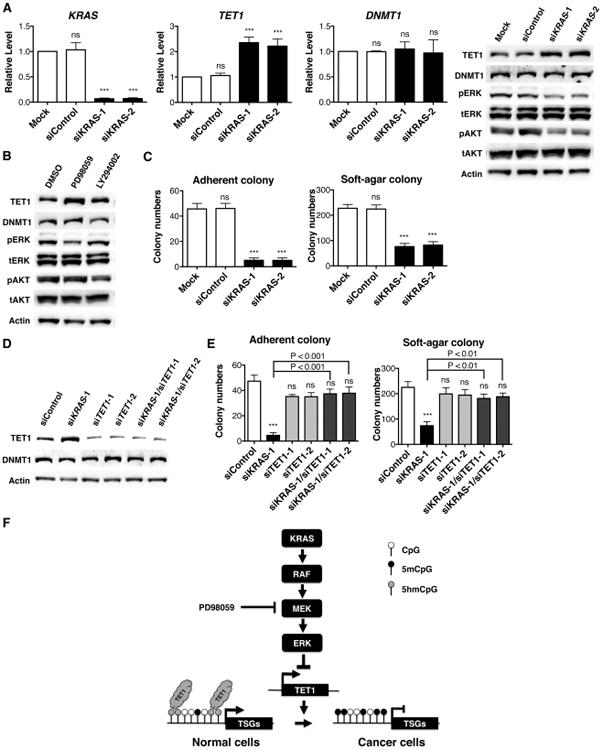
(A) After 10 μM KRAS siRNA treatment for 2 days, mRNA levels were determined by RT-qPCR and normalized to mock control without adding siRNA. Protein levels of TET1 and DNMT1 were determined by western blotting.
(B) After 20 μM PD98059 or 5 μM LY294002 treatment for 2 days, protein levels were determined by western blotting.
(C) Adherent and soft-agar colony formation after KRAS siRNA treatment.
(D) Protein levels were determined by western blotting after siRNA treatments.
(E) Adherent and soft-agar colony formation after indicated siRNA treatments. The data indicate that KRAS becomes dispensable if TET1 is knocked down. All data are presented as mean ± SD. ns, no significant difference; ***, p < 0.001 in comparison to mock cells or siControl treated cells.
(F) Essential role of TET1 suppression for RAS-mediated DNA hypermethylation and cellular transformation. TET1 modulates epigenetic and transcriptional regulation via hydroxylation of 5mC and subsequent DNA demethylation. TET1 targets CpG-rich promoters of TSGs to prevent DNA hypermethylation. The KRAS-ERK signaling pathway suppresses TET1 transcription. In KRAS-transformed cells, TET1 suppression decreases TET1 binding and 5hmC production at targeted promoters, resulting in hypermethylation-mediated silencing of TSGs. See also Figure S6.
Discussion
Cancers with RAS activation exhibit aberrant promoter hypermethylation and transcriptional silencing of TSGs. Sustained epigenetic repression of TSGs not only promotes tumor initiation, but also maintains their survival and malignant properties. Based on the fact that DNMT isozymes convert cytosine bases to 5mC, DNMT enzymes, especially DNMT1 (Gazin et al., 2007), are considered the main effectors that drive DNA hypermethylation during RAS-induced tumorigenesis. This work reveals that suppression of TET1 expression is essential for KRAS-induced DNA hypermethylation in cancer cells (Figure 7F).
In the Kras-transformed NIH3T3 system, when PI3K and MEK are inhibited, the Fas and Sfrp1 promoters are rapidly demethylated even when an inhibitor of DNA replication is applied (Wajapeyee et al., 2013). These data implied a mechanism for active DNA demethylation, which had not been identified. It has been reported that reduced TET gene expression and genomic 5hmC levels are common features of cellular transformation and that this can be induced by BRAF expression (Kudo et al., 2012). Here we show that MEK activity is part of a specific signal transduction pathway required for TET1 suppression and for the KRAS program of TSG hypermethylation. As shown in Figure 5E, the ability of apoptosis-proficient NIH3T3 cells to maintain expression of Fas is so important that the Fas promoter is apparently kept in a 5hmC-modified state by Tet1 so that it cannot be silenced by methylation. Kras transformation depletes Tet1 and allows Dnmt enzymes to convert nonmodified CpG dinucleotides to 5mCpG dinucleotides at the Fas promoter.
Although similar KRAS-mediated TET1 suppression was found in HBEC3 and NIH3T3 cells, there are two important differences. First, decreased Tet1 was accompanied by increased Dnmt1 in Kras-transformed NIH3T3 cells, while TET1 was reduced without DNMT1 alteration in KRAS-transformed HBEC3 cells. These cell-type specific effects indicate that KRAS can regulate dynamic DNA methylation by inhibiting TET1 expression alone or by further coupling with increased DNMT1. Further studies should reveal whether TET1 reduction and DNMT1 induction by KRAS activation work collaboratively or independently on target genes to cause promoter hypermethylation during tumorigenesis. Second, a significant reduction in genomic 5hmC was observed in Kras-transformed NIH3T3 cells but not in HBEC3 cells, suggesting that extinguishing TET1 expression may be insufficient to reduce global 5hmC. This may be the case because TET proteins regulate 5mC conversion to 5hmC at distinct genomic loci. TET1 localizes to CpG-rich promoters via its CXXC domain (Huang et al., 2014; Xu et al., 2011). However, TET2, which lacks the CXXC domain, associates primarily with gene bodies (Huang et al., 2014). Indeed, in ESC, Tet2 knockdown causes a greater reduction in genomic 5hmC levels than Tet1 knockdown (Huang et al., 2014). In addition, TET family proteins may be partially redundant with the potential for TET2 and TET3 to maintain genomic 5hmC levels when TET1 is not expressed. Consistent with this hypothesis, double depletion of Tet1 and Tet2 more significantly reduces 5hmC levels than individual depletion (Dawlaty et al., 2013; Koh et al., 2011).
The architectural transcription factor high mobility group AT-hook 2 (HMGA2) acts as a repressor of TET1 expression in a metastatic bone-tropic breast cancer cell line derived from MDA-MB-231 (Sun et al., 2013). Because HMGA2 expression is regulated by BRAF, ERK and let-7 in this cell line (Dangi-Garimella et al., 2009), it was possible that alteration of HMGA2 might be a common feature of KRAS-driven TET1 suppression. However, neither KRAS transformation in HBEC3 (Figure S2D) or NIH3T3 cells or KRAS knockdown in H1299 or HepG2 cells altered expression of HMGA2, LIN28, SNAIL, HOXA7 or HOXA9 genes (data not shown).
Though it is possible for oncogenes to be dispensable after establishment of neoplastic transformation, oncogene addiction (Weinstein, 2002) is common and well documented in RAS-dependent malignancies (Chin et al., 1999; Singh et al., 2009), and depends on the RAS-driven DNA hypermethylation phenotype (Wajapeyee et al., 2013). In our study, because TET1 re-expression blocks transformation and because TET1 knockdown can allow KRAS knockdown cells to retain a malignant phenotype, we identified TET1 repression as a critical component of the RAS program. Several inhibitors of the EGFR-RAS-RAF-MEK-ERK axis are under development (Downward, 2003; Engelman et al., 2008; Karapetis et al., 2008; Pao and Chmielecki, 2010). Because these drugs may depend on re-activating TET1 expression for efficacy, TET1 re-repression or increased 5hmC may serve as biomarkers of functional reversion of RAS transformation.
Experimental Procedures
Cell Culture
HBEC3 cells and stable cell lines were grown in KSFM media supplemented with bovine pituitary extract and recombinant human EGF unless specific indicated. NIH3T3 cells (CRL-1658, ATCC), Kras-transformed NIH3T3 cells (CRL-6361, ATCC) and HepG2 cells were grown in DMEM media with 10% FBS. H1299 cells were grown in RPMI-1640 media with 10% FBS.
Establishment of Stable Cell Lines
To establish oncogenic KRAS-expressing stable lines in HBEC3 cells, a full-length human KRAS-G12V cDNA clone (gift of Dr. John Minna) was used as template to generate a KRAS-G12V construct with an N-terminal myc-tag. For transient TET1 reintroduction, a catalytic domain of human TET1 cDNA clone (plasmid 39454, Addgene) (Guo et al., 2011) was used as template to generate a TET1 construct with an N-terminal myc-tag. PCR fragments were first T/A cloned into pGEM-Teasy vector (Promega) and then subcloned into pLenti6/V5 vector (Invitrogen). Viral production and transduction was performed using ViralPower Bsd Lentiviral Support Kit (Invitrogen). Monoclonal cell lines were selected by serial dilution in 96-well plates with 5 μg/ml Blasticidin (Invitrogen). Primer pairs used for plasmid construction are provided in Table S2.
DNA Dot Blot Assays
For global 5mC and 5hmC levels, DNA dot blots were performed with a 96-well manifold. Genomic DNA was extracted using DNeasy Blood & Tissue Kit (Qiagen). 1 μg genomic DNA and serial 2-fold dilutions were mixed with 0.4 M NaOH, 10 mM EDTA and denatured at 100°C for 10 min. Samples were then chilled on ice and neutralized with an equal volume of 2 M ammonium acetate pH 7.0 and loaded onto a 20× SSC rinsed Hybond-ECL nitrocellulose membrane. 5mC and 5hmC were detected using specific antibodies (5mC, 39769, Active motif; 5hmC, BI-MECY, Eurogentec) and visualized by SuperSignal West Femto Substrate (Thermo Scientific).
MeDIP and hMeDIP
Promoter methylation analysis was performed using MethylMiner Methylated DNA Enrichment Kit (Invitrogen) and promoter hydroxymethylation analysis was performed using HydroxyMethyl Collector (Active Motif). Genomic DNA was first fragmented by sonication to an average size of 400 bp. Methylated DNA or hydroxymethylated DNA was captured and eluated following the manufacturers' protocols. 5mC and 5hmC levels were analyzed using specific primer sets with qPCR (Table S2 and S3). 10% of input DNA was used as a control. All data were collected from 3 independent experiments.
Bisulfite Sequencing
For 5mC detection, genomic DNA was treated with bisulfite using EpiTect Bisulfite kit (Qiagen). Bisulfite treated DNA was then used as a template and PCR was performed using specific primer pairs (Table S2 and S3). Final PCR products were gel purified and cloned into the pGEM-T easy vector. Independent clones were subjected to sequencing. For 5hmC detection, genomic DNA was applied to 5hmC TAB-seq Kit (WiseGene) following the manufacturer protocol prior to bisulfite coversion.
ChIP
ChIP was performed with Magna ChIP HiSens chromatin immunoprecipitation kit (Millipore), TET1 antibody (09-872, Millipore), and analyzed using qPCR (Table S2 and S3). 10% of input DNA was used as a control. All data were collected from 3 independent experiments.
siRNA Transfection
Cells were transfected with 10 nM siRNA using the Lipofectamine RNAiMAX Reagent (Invitrogen). siRNAs were purchased from PreDesigned Oligo Sets (Integrated DNA Technologies), including siControl (DS NC1); siKRAS-1 (N004985.12.3); siKRAS-2 (N004985.12.5); siTET1-1 (N030625.12.1) and siTET1-2 (N030625.12.2).
Statistical Analysis
All data were presented as mean ± SD. Paired Student's t tests or one-way ANOVA was used to calculate P-value and determine significance. P-values below 0.05 were considered statistically significant.
Supplementary Material
Figure S1. Oncogenic KRAS Expression Causes Hypermethylation-Mediated Silencing of TSGs and Loss of Imprinting, Related toFigure 2
(A) Genomic 5mC levels in HBEC3-R2 cells treated with DMSO or 5-aza-dC were measured by DNA dot blot.
(B) Methylation levels of promoter-associated CpG islands were analyzed by qPCR.
(C) mRNA levels were analyzed by RT-qPCR and normalized to V1 cells.
(D) 5mC bisulfite sequencing of H19 ICR. White squares represent nonmethylated cytosines and black squares represent methylated cytosines in CpG sites. The percentages of methylated CpG from 20 independent clones are indicated.
(E) mRNA levels were analyzed by RT-qPCR and normalized to V1 cells.
(F) HBEC3-R2 cells were treated with increasing concentrations of 5-aza-dC for 5 days. Cell viability was determined by resazurin and normalized to the DMSO treated control.
(G) After 5-aza-dC treatment, mRNA levels were analyzed by RT-qPCR and normalized to the DMSO treated control. All data are presented as mean ± SD. ns, no significant difference; **, p < 0.01; ***, p < 0.001 in comparison to V1 cells or the DMSO treated control.
Figure S2. ERK Pathway Inhibition Reactivates Silenced H19 Expression in KRAS cells, Related toFigure 3
(A) mRNA levels were determined by RT-qPCR and normalized to V1 cells.
(B) HBEC3-R2 cells were treated with increasing concentrations of PD98059 or LY294002 for 6 days. Cell viability was determined by resazurin and normalized to the DMSO treated control.
(C) After ERK pathway inhibition, mRNA levels were analyzed by RT-qPCR and normalized to the DMSO control.
(D) mRNA levels were determined by RT-qPCR and normalized to V1 cells.
Figure S3. Reduction of 5hmC and TET1-Association are Responsible for KRAS-Mediated DNA Hypermethylation, Related toFigure 4
(A) Genomic 5hmC levels in HBEC3-R2 cells treated with DMSO or 5-aza-dC were measured by DNA dot blot.
(B) Hydroxymethylation levels of promoter-associated CpG islands were analyzed by qPCR.
(C) TET1 chromatin occupancy was analyzed using TET1 ChIP and qPCR.
(D) After TET1 viral transduction for 6 days, mRNA levels were analyzed by RT-qPCR and normalized to V1 cells with vector viral transduction.
(E) After TET1 viral transduction, cell viability was determined by resazurin and normalized to vector viral transduction.
(F) After TET1 viral transduction, mRNA levels were analyzed by RT-qPCR and normalized to the vector viral transduction control. All data are presented as mean ± SD. ns, no significant difference; *, p < 0.05; **, p < 0.01; ***, p < 0.001 in comparison to V1 cells or the vector virus control.
Figure S4. Kras-Mediated Suppression of Tet1 is Associated with Decreased 5hmC and Increased 5mC Levels, Related toFigure 5
(A) mRNA levels were determined by RT-qPCR and normalized to NIH3T3 cells.
(B) Methylation and (C) Hydroxymethylation levels of Sfrp1 and Lox promoters were analyzed by qPCR.
(D) Bisulfite sequencing for 5mC and TAB-seq for 5hmC. The percentages of 5mC or 5hmC are indicated at each promoter without and with Kras transformation.
(E) Tet1 chromatin occupancy was analyzed using Tet1 ChIP and qPCR. All data are presented as mean ± SD. ns, no significant difference; **, p < 0.01; ***, p <0.001 in comparison to NIH3T3 cells.
Figure S5. Erk Pathway Inhibition Increases Tet1 Expression in Kras-Transformed NIH3T3 Cells, while Akt Pathway Inhibition Shows no Effect, Related toFigure 6
(A) After Erk pathway or Akt pathway inhibition, mRNA levels were analyzed by RT-qPCR and normalized to the DMSO control.
(B) Adherent and soft-agar colony formation.
(C) After TET1 viral transduction, cell viability was determined by resazurin and normalized to vector viral transduction. All data were presented as mean ± SD. ns, no significant difference; ***, p < 0.001 in comparison to the DMSO treated control or NIH3T3 cells.
Figure S6. KRAS-Mediated Suppression of TET1 is Found in HepG2 Hepatoma Cancer Cells, Related toFigure 7
(A) After KRAS siRNA treatment, mRNA levels were determined by RT-qPCR and normalized to mock cells. Protein levels of TET1 and DNMT1 were determined by western blotting.
(B) After siRNA treatment, mRNA levels of H1299 cells were determined by RT-qPCR and normalized to siControl treated cells. All data are presented as mean ± SD. ns, no significant difference; **, p < 0.01; ***, p < 0.001 in comparison to mock cells or siControl treated cells.
Table S1. Target list of hypermethylated and silenced lung cancer TSGs, related to experimental procedures.
Table S2. Human primers, related to experimental procedures.
Table S3. Mouse primers, related to experimental procedures.
Acknowledgments
HBEC3 cells and human oncogenic KRAS cDNA were kind gifts from Dr. John Minna. This work was supported by grant R01CA075954 and contract HHSN261200433000C from the National Cancer Institute to C.B.
Footnotes
Author Contributions: B.W. designed and performed the experiments. B.W. and C.B. conceived and wrote the paper.
Inventory of Supplemental Information: Supplemental information includes six figures, three tables, and Supplemental Experimental Procedures.
Publisher's Disclaimer: This is a PDF file of an unedited manuscript that has been accepted for publication. As a service to our customers we are providing this early version of the manuscript. The manuscript will undergo copyediting, typesetting, and review of the resulting proof before it is published in its final citable form. Please note that during the production process errors may be discovered which could affect the content, and all legal disclaimers that apply to the journal pertain.
References
- Abdel-Wahab O, Mullally A, Hedvat C, Garcia-Manero G, Patel J, Wadleigh M, Malinge S, Yao J, Kilpivaara O, Bhat R, et al. Genetic characterization of TET1, TET2, and TET3 alterations in myeloid malignancies. Blood. 2009;114:144–147. doi: 10.1182/blood-2009-03-210039. [DOI] [PMC free article] [PubMed] [Google Scholar]
- Bachman KE, Herman JG, Corn PG, Merlo A, Costello JF, Cavenee WK, Baylin SB, Graff JR. Methylation-associated silencing of the tissue inhibitor of metalloproteinase-3 gene suggest a suppressor role in kidney, brain and other human cancers. Cancer Res. 1999;59:798–802. [PubMed] [Google Scholar]
- Bakin AV, Curran T. Role of DNA 5-methylcytosine transferase in cell transformation by fos. Science. 1999;283:387–390. doi: 10.1126/science.283.5400.387. [DOI] [PubMed] [Google Scholar]
- Belinsky SA, Nikula KJ, Baylin SB, Issa JP. Increased cytosine DNA-methyltransferase activity is target-cell-specific and an early event in lung cancer. Proc Natl Acad Sci USA. 1996;93:4045–4050. doi: 10.1073/pnas.93.9.4045. [DOI] [PMC free article] [PubMed] [Google Scholar]
- Belinsky SA. Gene-promoter hypermethylation as a biomarker in lung cancer. Nat Rev Cancer. 2004;4:707–717. doi: 10.1038/nrc1432. [DOI] [PubMed] [Google Scholar]
- Bestor TH. The DNA methyltransferases of mammals. Human Molecular Genetics. 2000;9:2395–2402. doi: 10.1093/hmg/9.16.2395. [DOI] [PubMed] [Google Scholar]
- Borrello MG, Pierotti MA, Bongarzone I, Donghi R, Mondellini P, Della Porta G. DNA methylation affecting the transforming activity of the human Ha-ras oncogene. Cancer Res. 1987;47:75–79. [PubMed] [Google Scholar]
- Chang HC, Cho CY, Hung WC. Silencing of the metastasis suppressor RECK by RAS oncogene is mediated by DNA methyltransferase 3b-induced promoter methylation. Cancer Res. 2006;66:8413–8420. doi: 10.1158/0008-5472.CAN-06-0685. [DOI] [PubMed] [Google Scholar]
- Chin L, Tam A, Pomerantz J, Wong M, Holash J, Bardeesy N, Shen Q, O'Hagan R, Pantginis J, Zhou H, et al. Essential role for oncogenic Ras in tumour maintenance. Nature. 1999;400:468–472. doi: 10.1038/22788. [DOI] [PubMed] [Google Scholar]
- Cortellino S, Xu J, Sannai M, Moore R, Caretti E, Cigliano A, Le Coz M, Devarajan K, Wessels A, Soprano D, et al. Thymine DNA Glycosylase Is Essential for Active DNA Demethylation by Linked Deamination-Base Excision Repair. Cell. 2011;146:67–79. doi: 10.1016/j.cell.2011.06.020. [DOI] [PMC free article] [PubMed] [Google Scholar]
- Dangi-Garimella S, Yun J, Eves EM, Newman M, Erkeland SJ, Hammond SM, Minn AJ, Rosner MR. Raf kinase inhibitory protein suppresses a metastasis signalling cascade involving LIN28 and let-7. Embo J. 2009;28:347–358. doi: 10.1038/emboj.2008.294. [DOI] [PMC free article] [PubMed] [Google Scholar]
- Dawlaty MM, Breiling A, Le T, Raddatz G, Barrasa MI, Cheng AW, Gao Q, Powell BE, Li Z, Xu M, et al. Combined Deficiency of Tet1 and Tet2 Causes Epigenetic Abnormalities but Is Compatible with Postnatal Development. Developmental Cell. 2013;24:310–323. doi: 10.1016/j.devcel.2012.12.015. [DOI] [PMC free article] [PubMed] [Google Scholar]
- Delhommeau F, Dupont S, Della Valle V, James C, Trannoy S, Massé A, Kosmider O, Le Couedic JP, Robert F, Alberdi A, et al. Mutation in TET2 in myeloid cancers. N Engl J Med. 2009;360:2289–2301. doi: 10.1056/NEJMoa0810069. [DOI] [PubMed] [Google Scholar]
- Downward J. Targeting RAS signalling pathways in cancer therapy. Nat Rev Cancer. 2003;3:11–22. doi: 10.1038/nrc969. [DOI] [PubMed] [Google Scholar]
- Dudley DT, Pang L, Decker SJ, Bridges AJ, Saltiel AR. A synthetic inhibitor of the mitogen-activated protein kinase cascade. Proc Natl Acad Sci USA. 1995;92:7686–7689. doi: 10.1073/pnas.92.17.7686. [DOI] [PMC free article] [PubMed] [Google Scholar]
- D'Arcangelo M, Cappuzzo F. K-Ras Mutations in Non-Small-Cell Lung Cancer: Prognostic and Predictive Value. ISRN Molecular Biology. 2012;2012:1–8. doi: 10.5402/2012/837306. [DOI] [PMC free article] [PubMed] [Google Scholar]
- Engelman JA, Chen L, Tan X, Crosby K, Guimaraes AR, Upadhyay R, Maira M, McNamara K, Perera SA, Song Y, et al. Effective use of PI3K and MEK inhibitors to treat mutant Kras G12D and PIK3CA H1047R murine lung cancers. Nat Med. 2008;14:1351–1356. doi: 10.1038/nm.1890. [DOI] [PMC free article] [PubMed] [Google Scholar]
- Fagan RL, Cryderman DE, Kopelovich L, Wallrath LL, Brenner C. Laccaic Acid A Is a Direct, DNA-competitive Inhibitor of DNA Methyltransferase 1. J Biol Chem. 2013a;288:23858–23867. doi: 10.1074/jbc.M113.480517. [DOI] [PMC free article] [PubMed] [Google Scholar]
- Fagan RL, Wu M, Chédin F, Brenner C. An Ultrasensitive High Throughput Screen for DNA Methyltransferase 1-Targeted Molecular Probes. PLoS ONE. 2013b;8:e78752. doi: 10.1371/journal.pone.0078752. [DOI] [PMC free article] [PubMed] [Google Scholar]
- Ficz G, Branco MR, Seisenberger S, Santos F, Krueger F, Hore TA, Marques CJ, Andrews S, Reik W. Dynamic regulation of 5-hydroxymethylcytosine in mouse ES cells and during differentiation. Nature. 2012;473:398–402. doi: 10.1038/nature10008. [DOI] [PubMed] [Google Scholar]
- Gazin C, Wajapeyee N, Gobeil S, Virbasius CM, Green MR. An elaborate pathway required for Ras-mediated epigenetic silencing. Nature. 2007;449:1073–1077. doi: 10.1038/nature06251. [DOI] [PMC free article] [PubMed] [Google Scholar]
- Greig RG, Koestler TP, Trainer DL, Corwin SP, Miles L, Kline T, Sweet R, Yokoyama S, Poste G. Tumorigenic and metastatic properties of “normal” and ras-transfected NIH/3T3 cells. Proc Natl Acad Sci USA. 1985;82:3698–3701. doi: 10.1073/pnas.82.11.3698. [DOI] [PMC free article] [PubMed] [Google Scholar]
- Guo JU, Su Y, Zhong C, Ming GL, Song H. Hydroxylation of 5-Methylcytosine by TET1 Promotes Active DNA Demethylation in the Adult Brain. Cell. 2011;145:423–434. doi: 10.1016/j.cell.2011.03.022. [DOI] [PMC free article] [PubMed] [Google Scholar]
- Guo M, Akiyama Y, House MG, Hooker CM, Heath E, Gabrielson E, Yang SC, Han Y, Baylin SB, Herman JG, et al. Hypermethylation of the GATA genes in lung cancer. Clin Cancer Res. 2004;10:7917–7924. doi: 10.1158/1078-0432.CCR-04-1140. [DOI] [PubMed] [Google Scholar]
- Hashimoto H, Liu Y, Upadhyay AK, Chang Y, Howerton SB, Vertino PM, Zhang X, Cheng X. Recognition and potential mechanisms for replication and erasure of cytosine hydroxymethylation. Nucleic Acids Res. 2012;40:4841–4849. doi: 10.1093/nar/gks155. [DOI] [PMC free article] [PubMed] [Google Scholar]
- He YF, Li BZ, Li Z, Liu P, Wang Y, Tang Q, Ding J, Jia Y, Chen Z, Li L, et al. Tet-Mediated Formation of 5-Carboxylcytosine and Its Excision by TDG in Mammalian DNA. Science. 2011;333:1303–1307. doi: 10.1126/science.1210944. [DOI] [PMC free article] [PubMed] [Google Scholar]
- Hsu CH, Peng KL, Kang ML, Chen YR, Yang YC, Tsai CH, Chu CS, Jeng YM, Chen YT, Lin FM, et al. TET1 Suppresses Cancer Invasion by Activating the Tissue Inhibitors of Metalloproteinases. CellReports. 2012;2:568–579. doi: 10.1016/j.celrep.2012.08.030. [DOI] [PubMed] [Google Scholar]
- Huang J, Stewart A, Maity B, Hagen J, Fagan RL, Yang J, Quelle DE, Brenner C, Fisher RA. RGS6 suppresses Ras-induced cellular transformation by facilitating Tip60-mediated Dnmt1 degradation and promotingapoptosis. Oncogene. 2013:1–8. doi: 10.1038/onc.2013.324. [DOI] [PMC free article] [PubMed] [Google Scholar]
- Huang Y, Chavez L, Chang X, Wang X, Pastor WA, Kang J, Zepeda-Martinez JA, Pape UJ, Jacobsen SE, Peters B, et al. Distinct roles of the methylcytosine oxidases Tet1 and Tet2 in mouse embryonic stem cells. Proc Natl Acad Sci USA. 2014;111:1361–1366. doi: 10.1073/pnas.1322921111. [DOI] [PMC free article] [PubMed] [Google Scholar]
- Huang Y, Pastor WA, Shen Y, Tahiliani M, Liu DR, Rao A. The Behaviour of 5-Hydroxymethylcytosine in Bisulfite Sequencing. PLoS ONE. 2010;5:e8888. doi: 10.1371/journal.pone.0008888. [DOI] [PMC free article] [PubMed] [Google Scholar]
- Ito S, Shen L, Dai Q, Wu SC, Collins LB, Swenberg JA, He C, Zhang Y. Tet Proteins Can Convert 5-Methylcytosine to 5-Formylcytosine and 5-Carboxylcytosine. Science. 2011;333:1300–1303. doi: 10.1126/science.1210597. [DOI] [PMC free article] [PubMed] [Google Scholar]
- Ito S, D'Alessio AC, Taranova OV, Hong K, Sowers LC, Zhang Y. Role of Tet proteins in 5mC to 5hmC conversion, ES-cell self-renewal and inner cell mass specification. Nature. 2010;466:1129–1133. doi: 10.1038/nature09303. [DOI] [PMC free article] [PubMed] [Google Scholar]
- Jones PA, Taylor SM, Mohandas T, Shapiro LJ. Cell cycle-specific reactivation of an inactive X-chromosome locus by 5-azadeoxycytidine. Proc Natl Acad Sci USA. 1982;79:1215–1219. doi: 10.1073/pnas.79.4.1215. [DOI] [PMC free article] [PubMed] [Google Scholar]
- Jones PA, Baylin SB. The fundamental role of epigenetic events in cancer. Nat Rev Genet. 2002;3:415–428. doi: 10.1038/nrg816. [DOI] [PubMed] [Google Scholar]
- Kaas GA, Zhong C, Eason DE, Ross DL, Vachhani RV, Ming GL, King JR, Song H, Sweatt JD. TET1 Controls CNS 5-Methylcytosine Hydroxylation, Active DNA Demethylation, Gene Transcription, and Memory Formation. Neuron. 2013;79:1086–1093. doi: 10.1016/j.neuron.2013.08.032. [DOI] [PMC free article] [PubMed] [Google Scholar]
- Karapetis CS, Khambata-Ford S, Jonker DJ, O'Callaghan CJ, Tu D, Tebbutt NC, Simes RJ, Chalchal H, Shapiro JD, Robitaille S, et al. K-ras mutations and benefit from cetuximab in advanced colorectal cancer. N Engl J Med. 2008;359:1757–1765. doi: 10.1056/NEJMoa0804385. [DOI] [PubMed] [Google Scholar]
- Kim DH, Nelson HH, Wiencke JK, Christiani DC, Wain JC, Mark EJ, Kelsey KT. Promoter methylation of DAP-kinase: association with advanced stage in non-small cell lung cancer. Oncogene. 2001;20:1765–1770. doi: 10.1038/sj.onc.1204302. [DOI] [PubMed] [Google Scholar]
- Ko M, Huang Y, Jankowska AM, Pape UJ, Tahiliani M, Bandukwala HS, An J, Lamperti ED, Koh KP, Ganetzky R, et al. Impaired hydroxylation of 5-methylcytosine inmyeloid cancers with mutant TET2. Nature. 2010;468:839–843. doi: 10.1038/nature09586. [DOI] [PMC free article] [PubMed] [Google Scholar]
- Koh KP, Yabuuchi A, Rao S, Huang Y, Cunniff K, Nardone J, Laiho A, Tahiliani M, Sommer CA, Mostoslavsky G, et al. Tet1 and Tet2 Regulate 5-Hydroxymethylcytosine Production and Cell Lineage Specificationin Mouse Embryonic Stem Cells. Cell Stem Cell. 2011;8:200–213. doi: 10.1016/j.stem.2011.01.008. [DOI] [PMC free article] [PubMed] [Google Scholar]
- Kohli RM, Zhang Y. TET enzymes, TDG and the dynamics of DNA demethylation. Nature. 2013;502:472–479. doi: 10.1038/nature12750. [DOI] [PMC free article] [PubMed] [Google Scholar]
- Kriaucionis S, Heintz N. The Nuclear DNA Base 5-Hydroxymethylcytosine Is Present in Purkinje Neurons and the Brain. Science. 2009;324:929–930. doi: 10.1126/science.1169786. [DOI] [PMC free article] [PubMed] [Google Scholar]
- Kudo Y, Tateishi K, Yamamoto K, Yamamoto S, Asaoka Y, Ijichi H, Nagae G, Yoshida H, Aburatani H, Koike K. Loss of 5-hydroxymethylcytosine is accompanied with malignant cellular transformation. Cancer Science. 2012;103:670–676. doi: 10.1111/j.1349-7006.2012.02213.x. [DOI] [PMC free article] [PubMed] [Google Scholar]
- Laird PW, Jackson-Grusby L, Fazeli A, Dickinson SL, Jung WE, Li E, Weinberg RA, Jaenisch R. Suppression of intestinal neoplasia by DNA hypomethylation. Cell. 1995;81:197–205. doi: 10.1016/0092-8674(95)90329-1. [DOI] [PubMed] [Google Scholar]
- Lian CG, Xu Y, Ceol C, Wu F, Larson A, Dresser K, Xu W, Tan L, Hu Y, Zhan Q, et al. Loss of 5-HydroxymethylcytosineIs an Epigenetic Hallmark of Melanoma. Cell. 2012;150:1135–1146. doi: 10.1016/j.cell.2012.07.033. [DOI] [PMC free article] [PubMed] [Google Scholar]
- Luxen S, Belinsky SA, Knaus UG. Silencing of DUOX NADPH Oxidases by Promoter Hypermethylation in Lung Cancer. Cancer Res. 2008;68:1037–1045. doi: 10.1158/0008-5472.CAN-07-5782. [DOI] [PubMed] [Google Scholar]
- MacLeod AR, Szyf M. Expression of antisense to DNA methyltransferase mRNA induces DNA demethylation and inhibits tumorigenesis. J Biol Chem. 1995;270:8037–8043. doi: 10.1074/jbc.270.14.8037. [DOI] [PubMed] [Google Scholar]
- Pao W, Chmielecki J. Rational, biologically based treatment of EGFR- mutant non-small-cell lung cancer. Nature Publishing Group. 2010;10:760–774. doi: 10.1038/nrc2947. [DOI] [PMC free article] [PubMed] [Google Scholar]
- Pastor WA, Aravind L, Rao A. TETonic shift: biological roles of TET proteins in DNA demethylation and transcription. Nat Rev Mol Cell Biol. 2013;14:341–356. doi: 10.1038/nrm3589. [DOI] [PMC free article] [PubMed] [Google Scholar]
- Patra SK. Ras regulation of DNA-methylation and cancer. Experimental Cell Research. 2008;314:1193–1201. doi: 10.1016/j.yexcr.2008.01.012. [DOI] [PubMed] [Google Scholar]
- Pruitt K, Ulku AS, Frantz K, Rojas RJ, Muniz-Medina VM, Rangnekar VM, Der CJ, Shields JM. Ras-mediated Loss of the Pro-apoptotic Response Protein Par-4 Is Mediated by DNA Hypermethylation through Raf-independent and Raf-dependent Signaling Cascades in Epithelial Cells. J Biol Chem. 2005;280:23363–23370. doi: 10.1074/jbc.M503083200. [DOI] [PubMed] [Google Scholar]
- Pulling LC, Divine KK, Klinge DM, Gilliland FD, Kang T, Schwartz AG, Bocklage TJ, Belinsky SA. Promoter hypermethylation of the O6-methylguanine-DNA methyltransferase gene: more common in lung adenocarcinomas from never-smokers than smokers and associated with tumor progression. Cancer Res. 2003;63:4842–4848. [PubMed] [Google Scholar]
- Pylayeva-Gupta Y, Grabocka E, Bar-Sagi D. RAS oncogenes: weaving a tumorigenic web. Nat Rev Cancer. 2011;11:761–774. doi: 10.1038/nrc3106. [DOI] [PMC free article] [PubMed] [Google Scholar]
- Ramchandani S, MacLeod AR, Pinard M, von Hofe R, Szyf M. Inhibition of tumorigenesis by a cytosine-DNA, methyltransferase, antisense oligodeoxynucleotide. Proc Natl Acad Sci USA. 1997;94:684–689. doi: 10.1073/pnas.94.2.684. [DOI] [PMC free article] [PubMed] [Google Scholar]
- Sato M, Vaughan MB, Girard L, Peyton M, Lee W, Shames DS, Ramirez RD, Sunaga N, Gazdar AF, Shay JW, et al. Multiple oncogenic changes (K-RAS(V12), p53 knockdown, mutant EGFRs, p16 bypass, telomerase) are not sufficient to confer a full malignant phenotype on human bronchial epithelial cells. Cancer Res. 2006;66:2116–2128. doi: 10.1158/0008-5472.CAN-05-2521. [DOI] [PubMed] [Google Scholar]
- Schubbert S, Shannon K, Bollag G. Hyperactive Ras in developmental disorders and cancer. Nat Rev Cancer. 2007;7:295–308. doi: 10.1038/nrc2109. [DOI] [PubMed] [Google Scholar]
- Serra RW, Fang M, Park SM, Hutchinson L, Green MR. A KRAS-directed transcriptional silencing pathway that mediates the CpG island methylator phenotype. eLife. 2014;3:e02313–e02313. doi: 10.7554/eLife.02313. [DOI] [PMC free article] [PubMed] [Google Scholar]
- Sharma SV, Bell DW, Settleman J, Haber DA. Epidermal growth factor receptor mutations in lung cancer. Nat Rev Cancer. 2007;7:169–181. doi: 10.1038/nrc2088. [DOI] [PubMed] [Google Scholar]
- Singh A, Greninger P, Rhodes D, Koopman L, Violette S, Bardeesy N, Settleman J. A gene expression signature associated with “K-Ras addiction” reveals regulators of EMT and tumor cell survival. Cancer Cell. 2009;15:489–500. doi: 10.1016/j.ccr.2009.03.022. [DOI] [PMC free article] [PubMed] [Google Scholar]
- Steenman MJ, Rainier S, Dobry CJ, Grundy P, Horon IL, Feinberg AP. Loss of imprinting of IGF2 is linked to reduced expression and abnormal methylation of H19 in Wilms' tumour. Nature Genetics. 1994;7:433–439. doi: 10.1038/ng0794-433. [DOI] [PubMed] [Google Scholar]
- Sun M, Song CX, Huang H, Frankenberger CA, Sankarasharma D, Gomes S, Chen P, Chen J, Chada KK, He C, et al. HMGA2/TET1/HOXA9 signaling pathway regulates breast cancer growth and metastasis. Proc Natl Acad Sci USA. 2013;110:9920–9925. doi: 10.1073/pnas.1305172110. [DOI] [PMC free article] [PubMed] [Google Scholar]
- Suzuki M, Sunaga N, Shames DS, Toyooka S, Gazdar AF, Minna JD. RNA interference-mediated knockdown of DNA methyltransferase 1 leads to promoter demethylation and gene re-expression in human lung and breast cancer cells. Cancer Res. 2004;64:3137–3143. doi: 10.1158/0008-5472.can-03-3046. [DOI] [PubMed] [Google Scholar]
- Tahiliani M, Koh KP, Shen Y, Pastor WA, Bandukwala H, Brudno Y, Agarwal S, Iyer LM, Liu DR, Aravind L, et al. Conversion of 5-Methylcytosine to 5-Hydroxymethylcytosine in Mammalian DNA by MLL Partner TET1. Science. 2009;324:930–935. doi: 10.1126/science.1170116. [DOI] [PMC free article] [PubMed] [Google Scholar]
- Valinluck V, Sowers LC. Endogenous Cytosine Damage Products Alter the Site Selectivity of Human DNA Maintenance Methyltransferase DNMT1. Cancer Res. 2007;67:946–950. doi: 10.1158/0008-5472.CAN-06-3123. [DOI] [PubMed] [Google Scholar]
- Vlahos CJ, Matter WF, Hui KY, Brown RF. A specific inhibitor of phosphatidylinositol 3-kinase, 2-(4-morpholinyl)-8-phenyl-4H-1-benzopyran-4-one (LY294002) J Biol Chem. 1994;269:5241–5248. [PubMed] [Google Scholar]
- Wajapeyee N, Malonia SK, Palakurthy RK, Green MR. Oncogenic RAS directs silencing of tumor suppressor genes through ordered recruitment of transcriptional repressors. Genes Dev. 2013;27:2221–2226. doi: 10.1101/gad.227413.113. [DOI] [PMC free article] [PubMed] [Google Scholar]
- Weinstein IB. Cancer. Addiction to oncogenes--the Achilles heal of cancer. Science. 2002;297:63–64. doi: 10.1126/science.1073096. [DOI] [PubMed] [Google Scholar]
- Wu BK, Mei SC, Brenner C. RFTS-deleted DNMT1 enhances tumorigenicity with focal hypermethylation and global hypomethylation. Cell Cycle. 2014;13 doi: 10.4161/15384101.2014.950886. Published online Aug 29, 2014. doi:10.4161–15384101.2014.950886. [DOI] [PMC free article] [PubMed] [Google Scholar]
- Wu H, Zhang Y. Reversing DNA Methylation: Mechanisms, Genomics, and Biological Functions. Cell. 2014;156:45–68. doi: 10.1016/j.cell.2013.12.019. [DOI] [PMC free article] [PubMed] [Google Scholar]
- Wu J, Issa JP, Herman J, Bassett DE, Nelkin BD, Baylin SB. Expression of an exogenous eukaryotic DNA methyltransferase gene induces transformation of NIH 3T3 cells. Proc Natl Acad Sci USA. 1993;90:8891–8895. doi: 10.1073/pnas.90.19.8891. [DOI] [PMC free article] [PubMed] [Google Scholar]
- Wu SC, Zhang Y. Active DNA demethylation: many roads lead to Rome. Nat Rev Mol Cell Biol. 2010;11:607–620. doi: 10.1038/nrm2950. [DOI] [PMC free article] [PubMed] [Google Scholar]
- Xu Y, Wu F, Tan L, Kong L, Xiong L, Deng J, Barbera AJ, Zheng L, Zhang H, Huang S, et al. Genome-wide Regulation of 5hmC, 5mC, and Gene Expression by Tet1 Hydroxylase in Mouse Embryonic Stem Cells. Molecular Cell. 2011;42:451–464. doi: 10.1016/j.molcel.2011.04.005. [DOI] [PMC free article] [PubMed] [Google Scholar]
- Yang H, Liu Y, Bai F, Zhang JY, Ma SH, Liu J, Xu ZD, Zhu HG, Ling ZQ, Ye D, et al. Tumor development is associated with decrease of TET gene expression and 5-methylcytosine hydroxylation. Oncogene. 2013;32:663–669. doi: 10.1038/onc.2012.67. [DOI] [PMC free article] [PubMed] [Google Scholar]
- Yarden Y, Sliwkowski MX. Untangling the ErbB signalling network. Nat Rev Mol Cell Biol. 2001;2:127–137. doi: 10.1038/35052073. [DOI] [PubMed] [Google Scholar]
- Yu M, Hon GC, Szulwach KE, Song CX, Jin P, Ren B, He C. Tet-assisted bisulfite sequencing of 5-hydroxymethylcytosine. Nat Protoc. 2012;7:2159–2170. doi: 10.1038/nprot.2012.137. [DOI] [PMC free article] [PubMed] [Google Scholar]
Associated Data
This section collects any data citations, data availability statements, or supplementary materials included in this article.
Supplementary Materials
Figure S1. Oncogenic KRAS Expression Causes Hypermethylation-Mediated Silencing of TSGs and Loss of Imprinting, Related toFigure 2
(A) Genomic 5mC levels in HBEC3-R2 cells treated with DMSO or 5-aza-dC were measured by DNA dot blot.
(B) Methylation levels of promoter-associated CpG islands were analyzed by qPCR.
(C) mRNA levels were analyzed by RT-qPCR and normalized to V1 cells.
(D) 5mC bisulfite sequencing of H19 ICR. White squares represent nonmethylated cytosines and black squares represent methylated cytosines in CpG sites. The percentages of methylated CpG from 20 independent clones are indicated.
(E) mRNA levels were analyzed by RT-qPCR and normalized to V1 cells.
(F) HBEC3-R2 cells were treated with increasing concentrations of 5-aza-dC for 5 days. Cell viability was determined by resazurin and normalized to the DMSO treated control.
(G) After 5-aza-dC treatment, mRNA levels were analyzed by RT-qPCR and normalized to the DMSO treated control. All data are presented as mean ± SD. ns, no significant difference; **, p < 0.01; ***, p < 0.001 in comparison to V1 cells or the DMSO treated control.
Figure S2. ERK Pathway Inhibition Reactivates Silenced H19 Expression in KRAS cells, Related toFigure 3
(A) mRNA levels were determined by RT-qPCR and normalized to V1 cells.
(B) HBEC3-R2 cells were treated with increasing concentrations of PD98059 or LY294002 for 6 days. Cell viability was determined by resazurin and normalized to the DMSO treated control.
(C) After ERK pathway inhibition, mRNA levels were analyzed by RT-qPCR and normalized to the DMSO control.
(D) mRNA levels were determined by RT-qPCR and normalized to V1 cells.
Figure S3. Reduction of 5hmC and TET1-Association are Responsible for KRAS-Mediated DNA Hypermethylation, Related toFigure 4
(A) Genomic 5hmC levels in HBEC3-R2 cells treated with DMSO or 5-aza-dC were measured by DNA dot blot.
(B) Hydroxymethylation levels of promoter-associated CpG islands were analyzed by qPCR.
(C) TET1 chromatin occupancy was analyzed using TET1 ChIP and qPCR.
(D) After TET1 viral transduction for 6 days, mRNA levels were analyzed by RT-qPCR and normalized to V1 cells with vector viral transduction.
(E) After TET1 viral transduction, cell viability was determined by resazurin and normalized to vector viral transduction.
(F) After TET1 viral transduction, mRNA levels were analyzed by RT-qPCR and normalized to the vector viral transduction control. All data are presented as mean ± SD. ns, no significant difference; *, p < 0.05; **, p < 0.01; ***, p < 0.001 in comparison to V1 cells or the vector virus control.
Figure S4. Kras-Mediated Suppression of Tet1 is Associated with Decreased 5hmC and Increased 5mC Levels, Related toFigure 5
(A) mRNA levels were determined by RT-qPCR and normalized to NIH3T3 cells.
(B) Methylation and (C) Hydroxymethylation levels of Sfrp1 and Lox promoters were analyzed by qPCR.
(D) Bisulfite sequencing for 5mC and TAB-seq for 5hmC. The percentages of 5mC or 5hmC are indicated at each promoter without and with Kras transformation.
(E) Tet1 chromatin occupancy was analyzed using Tet1 ChIP and qPCR. All data are presented as mean ± SD. ns, no significant difference; **, p < 0.01; ***, p <0.001 in comparison to NIH3T3 cells.
Figure S5. Erk Pathway Inhibition Increases Tet1 Expression in Kras-Transformed NIH3T3 Cells, while Akt Pathway Inhibition Shows no Effect, Related toFigure 6
(A) After Erk pathway or Akt pathway inhibition, mRNA levels were analyzed by RT-qPCR and normalized to the DMSO control.
(B) Adherent and soft-agar colony formation.
(C) After TET1 viral transduction, cell viability was determined by resazurin and normalized to vector viral transduction. All data were presented as mean ± SD. ns, no significant difference; ***, p < 0.001 in comparison to the DMSO treated control or NIH3T3 cells.
Figure S6. KRAS-Mediated Suppression of TET1 is Found in HepG2 Hepatoma Cancer Cells, Related toFigure 7
(A) After KRAS siRNA treatment, mRNA levels were determined by RT-qPCR and normalized to mock cells. Protein levels of TET1 and DNMT1 were determined by western blotting.
(B) After siRNA treatment, mRNA levels of H1299 cells were determined by RT-qPCR and normalized to siControl treated cells. All data are presented as mean ± SD. ns, no significant difference; **, p < 0.01; ***, p < 0.001 in comparison to mock cells or siControl treated cells.
Table S1. Target list of hypermethylated and silenced lung cancer TSGs, related to experimental procedures.
Table S2. Human primers, related to experimental procedures.
Table S3. Mouse primers, related to experimental procedures.