

Abstract
Genome-wide association studies have identified more than eighty risk variants for prostate cancer, mainly in European or Asian populations. The generalizability of these variants in other racial/ethnic populations needs to be understood before the loci can be utilized widely in risk modeling. In this study, we examined 82 previously reported risk variants in 4,853 prostate cancer cases and 4,678 controls of African ancestry. We performed association testing for each variant using logistic regression adjusted for age, study, and global ancestry. Of the 82 known risk variants, 68 (83%) had effects that were directionally consistent in their association with prostate cancer risk and 30 (37%) were significantly associated with risk at p<0.05, with the most statistically significant variants being rs116041037 (p=3.7×10⁻²⁶) and rs6983561 (p=1.1×10⁻¹⁶) at 8q24, as well as rs7210100 (p=5.4×10⁻⁸) at 17q21. By exploring each locus in search of better markers, the number of variants that captured risk in men of African ancestry (p<0.05) increased from 30 (37%) to 44 (54%). An aggregate score comprised of these 44 markers was strongly associated with prostate cancer risk (per-allele odds ratio (OR)=1.12, p=7.3×10-98). In summary, the consistent directions of effects for the vast majority of variants in men of African ancestry indicate common functional alleles that are shared across populations. Further exploration of these susceptibility loci is needed to identify the underlying biologically relevant variants to improve prostate cancer risk modeling in populations of African ancestry.
Keywords: prostate cancer, genetic risk variant, generalizability, African ancestry
INTRODUCTION
Prostate cancer is the most common non-skin cancer and the second leading cause of cancer death for men in the United States. In African Americans, the incidence rate is 1.6 times that in European Americans and the mortality rate is 2.5 times greater1. Reasons for the greater disease burden, which has also been suggested in Africa2, are not known. However, studies have revealed that some risk variants are more common in men of African ancestry than in other racial/ethnic populations3, 4, suggesting a genetic basis for the greater disease burden. Genome-wide association studies (GWAS) and large-scale collaborative replication efforts have identified more than eighty prostate cancer risk variants, mainly in populations of European or Asian ancestry4-19. Direct testing of these variants in other populations will be required to characterize the risk conveyed by these loci globally. In an earlier study in African Americans (3,425 cases and 3,290 controls) we examined 49 risk variants in 28 regions, and found that 71% of the variants (n=35) had effects that were directionally consistent with the initial reports3. Similar results were also noted in a study by Chang et al.20, which included many of these same participating studies. Although preliminary, these findings suggest that the majority of risk alleles found to date in other populations are also common in African Americans. In the present study, we continue to investigate the question of risk locus generalizability in African-ancestry populations, through testing a more comprehensive set of risk variants (n=82) in a larger sample of prostate cancer cases (n=4,853) and controls (n=4,678) of African ancestry, which includes the subjects from our previous investigation. For each variant, we compared the magnitude of association and risk allele frequency between African and the initial GWAS population. We also modeled prostate cancer risk based on a cumulative score of associated alleles.
MATERIALS AND METHODS
Study Populations
We assembled a consortium of prostate cancer studies that included men of African ancestry and conducted a GWAS to search for additional risk loci that may be more common in men of African descent. Initial findings from the GWAS have been reported in Haiman et al.3, 4. The current study of prostate cancer in men of African ancestry includes 5,096 cases and 4,972 controls (see Supplementary Note), the vast majority of which are African Americans (95%). This sample includes 11 studies that were part of our original investigation (cases/controls: Multiethnic Cohort, 1,094/1,096; The Southern Community Cohort Study, 212/419; The Prostate, Lung, Colorectal, and Ovarian Cancer Screening Trial, 286/269; The Cancer Prevention Study II Nutrition Cohort, 76/152; Prostate Cancer Case-Control Studies at MD Anderson, 543/474; Identifying Prostate Cancer Genes, 368/172; The Los Angeles Study of Aggressive Prostate Cancer, 296/303; Prostate Cancer Genetics Study, 75/85; Case-Control Study of Prostate Cancer among African Americans in Washington, DC, 292/359; King County (Washington) Prostate Cancer Study, 145/81; and The Gene-Environment Interaction in Prostate Cancer Study, 234/92), as well as three additional studies (cases/controls: The North Carolina Prostate Cancer Study, 216/249; Selenium and Vitamin E Cancer Prevention Trial, 223/224; and Prostate Cancer in a Black Population, 238/231) and additional samples from two of the original studies (cases/controls: Multiethnic Cohort, 747/662; and The Southern Community Cohort Study, 51/104). Institutional review board approval was obtained for all participating studies.
Genotyping and Quality Control
Genotyping of the 10,068 samples (7,123 included in our previous report plus 2,945 additional samples) was conducted using the Illumina Infinium Human1M-Duo bead array. Samples (n=537) were removed based on the following exclusion criteria: (i) unknown replicates across studies, (ii) call rates <95%, (iii) >10% mean heterozygosity on the X chromosome and/or <10% mean intensity on the Y chromosome, (iv) ancestry outliers (>4 standard deviations from the mean of eigenvector 1 or 2 as calculated using EIGENSTRAT21), and (v) samples that were related (1 from each group: monozygotic twin, parent-offspring, full- and half-sibling pairs as estimated in PLINK (http://pngu.mgh.harvard.edu/purcell/plink/)). To assess genotyping reproducibility, we included 215 replicate samples; the concordance rate was ≥99.9% for all pairs. The final analysis included 4,853 cases and 4,678 controls (Supplementary Table S1). Of the 82 single-nucleotide polymorphisms (SNP) under investigation, 69 were genotyped and all had call rates >99%.
SNP Imputation
In order to test the established prostate cancer risk variants that were not directly genotyped and to further explore the known risk loci, we performed imputation using the software IMPUTE222. Phased haplotype data from a multiethnic reference panel of 1,092 individuals in 1000 Genomes Project (March 2012 release) were used to infer linkage disequilibrium (LD) patterns in order to impute missing markers. All 13 of the remaining variants were well imputed as indicated by the “info score”, an imputation quality metric22. For these SNPs, the mean info score generated by IMPUTE2 was 0.97 with a range of 0.88 to 1.
Statistical Analysis
We tested 82 prostate cancer risk variants in 54 regions (with some regions having more than one variant associated with risk) that were identified in previous GWAS. All 82 variants were weakly correlated with each other (r2<0.2 in EUR/AFR in 1000 Genomes Project). For some regions, such as 8q24, not all previously reported SNPs were presented because of high correlations with SNPs that were presented. For each SNP, per-allele odds ratio (OR) and 95% confidence interval (CI) was estimated using unconditional logistic regression adjusted for age (i.e. at diagnosis for cases and at blood draw or reference date for controls), study, and the first 10 principal components of global ancestry. We tested for allele dosage effects through a 1-degree of freedom Wald test. In the results and discussion section, “directionally consistent” refers to the direction of the association (OR) and not statistical significance (p-value).
We examined each locus in search of better markers of risk in this population using genotyped and well-imputed (info score≥0.8) common variants (minor allele frequency≥1%). For each known risk variant (referred to as index SNP), we examined all highly correlated variants (r2≥0.8) in the racial/ethnic population in which the original discovery was made. A marker that can better capture risk in men of African ancestry (referred to as AA marker) was defined as p<0.05, more statistically significant than the index SNP and with a larger effect size (OR).
For each index SNP and AA marker, we also examined the association with prostate cancer risk by disease severity and performed a case-only analysis (aggressive versus non-aggressive disease). Aggressive disease was defined as metastatic disease, PSA>100 (ng/mL), Gleason Score ≥8 and/or prostate cancer as a cause of death (n=1,238 cases).
We modeled the cumulative genetic risk of prostate cancer using index SNPs from previous GWAS (n=82). More specifically, we summed the number of risk alleles for each individual as a genetic risk score, which is appropriate for unlinked variants with independent effects of approximately the same magnitude for each allele, and estimated the odds ratio per allele and by quintile for this aggregate score. For individuals missing genotypes for a given SNP, we assigned the average number of risk alleles for that SNP to replace the missing value. The vast majority of subjects (96.4%) had no missing genotype for any SNP, with only two subjects missing ≥5% of the SNPs. We compared the results to a model of risk-associated variants in men of African ancestry (OR>1.0 and p<0.05), with index SNPs substituted by the AA markers when available (n=44). We stratified the analysis by age (>65 versus ≤65 years) and tested for the interaction between genetic risk score and age groups. We also examined the risk score by disease severity.
RESULTS AND DISCUSSION
Of the 82 known risk alleles we examined, 68 (83%) were associated with increased prostate cancer risk (OR>1.0) and 30 (37%) reached nominal statistical significance (p<0.05) in men of African ancestry (Supplementary Table S2). The number of variants with consistent directions of effects (68 out of 82) is statistically significantly more than expected (p=5.7×10⁻¹⁰, one-tailed binomial test). The vast majority of the 82 variants had consistent effects across the 14 study groups, with only 7 variants (9%) exhibiting statistically significant heterogeneity (Phet<0.05; Supplementary Table S2), which is slightly more than expected given the number of comparisons. In contrast to Europeans, one allele at 8q24 (rs12543663, C) was significantly associated with reduced prostate cancer risk (OR=0.86, 95% CI, 0.79-0.94, p=8.6×10⁻⁴), which is consistent with our previous observation in a subset of these samples3. Shown in Figure 1 is a comparison of the effect estimates from previous GWAS and those in men of African ancestry. The marked directional consistency of effects for many variants suggests that they are generalized markers of prostate cancer risk and that a common functional variant is shared across populations at most susceptibility loci.
Figure 1. Effect Size Comparison of Known Risk Variants in Previous GWAS and in Men of African Ancestry.
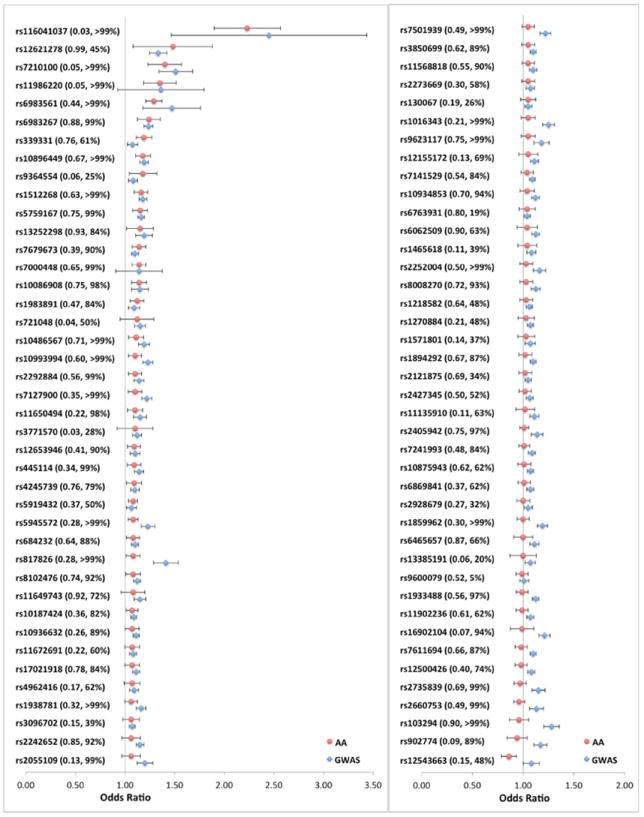
The odds ratio (OR) and 95% confidence interval (CI) for 82 known risk variants in previous GWAS and in men of African ancestry (AA). For SNPs reported in multi-stage GWAS, the OR and 95% CI from the largest replication stage was used for comparison. The red dots represent ORs in this study; the blue diamonds represent ORs in previous GWAS. The horizontal bars represent the corresponding 95% CIs. For each tested allele, frequency and statistical power (%) in AA are provided in the parentheses. The SNPs are sorted based on the ORs in AA. Detailed information for each SNP is provided in Supplementary Table S2.
Among all tested variants, the most associated markers were rs116041037 (OR=2.23, p=3.7×10⁻²⁶) and rs6983561 (OR=1.29, p=1.1×10⁻¹⁶) at 8q24, as well as rs7210100 (OR=1.40, p=5.4×10⁻⁸) at 17q21 (Supplementary Table S2), which are located in the regions that we have shown to be the most significantly associated with prostate cancer risk in our GWAS in men of African ancestry4. Of these, the risk alleles of rs116041037(A)5 and rs7210100(A)4 have only been found in populations of African ancestry with a frequency of 2-3% and 4-5%, respectively.
Our sample size provided ≥80% power to detect the reported effect size (i.e. the OR from the largest replication stage in previous GWAS) for 50 (61%) of the 82 variants at a significance level of α=0.05 (Supplementary Fig. S1, Supplementary Table S2). However, even with ≥80% power, 25 variants (50%) were not replicated at p<0.05, which suggests that these variants might not be adequately correlated with the underlying biologically relevant variant in populations of African descent as demonstrated in our initial study3.
To address this hypothesis, we examined each locus in search of markers that might better capture risk in men of African ancestry (referred to as AA markers; see Methods). An AA marker revealed at 12q13 is demonstrated in Figure 2 as an example. The index SNP (rs902774), originally identified in a European GWAS14, was not significantly associated with risk in men of African ancestry (OR=0.94, p=0.28) given 89% statistical power. The most significant variant (rs55958994; OR=1.17, p=2.5×10⁻⁴) in this region is located 27kb downstream from the index SNP. These two markers are well-correlated in Europeans (r2=0.82) but are uncorrelated in Africans (r2=0.01), which suggests that rs55958994 is a better proxy of the underlying biologically relevant variant in men of African ancestry. Among all loci, an AA marker was identified for 21 index SNPs (Supplementary Table S3). Taking these AA markers into account, 44 (54%) of the 82 known risk signals reached nominal statistical significance (p<0.05).
Figure 2. A Regional Association Plot of the Prostate Cancer Risk Locus at Chromosome 12q13.
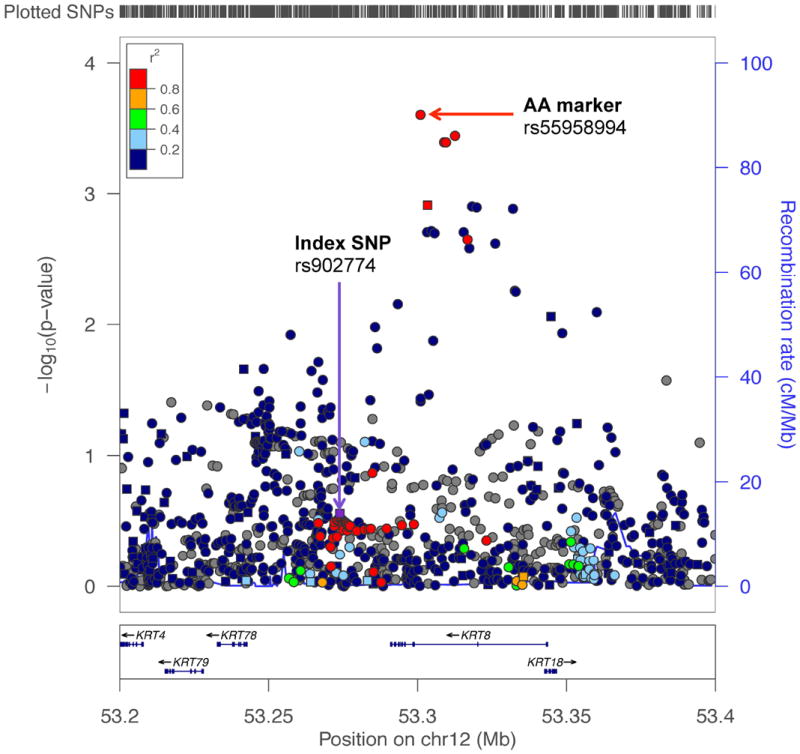
The -log10 p-values are from the association with prostate cancer risk in men of African ancestry (AA). Squares are genotyped SNPs and circles are imputed SNPs. The index SNP (rs902774), originally identified in a European GWAS, is designated by a purple square. The r2 shown is estimated in Europeans from 1000 Genomes Project (1000G EUR) in relation to rs902774. Grey symbols are SNPs not in 1000G EUR (r2 cannot be estimated). The top red circle represents a better marker of risk in AA (rs55958994) at this locus. The plot was generated using LocusZoom (http://csg.sph.umich.edu/locuszoom/).
The frequencies of the index risk alleles were slightly greater, on average, in men of African ancestry than in GWAS populations of European or Asian ancestry (Supplementary Table S4); the two African-specific variants were not considered in the comparisons (rs116041037 and rs7210100). The mean risk allele frequency (RAF) was 4% greater, with 42 (53%) of the 80 index risk alleles being more common in men of African ancestry than in the initial GWAS population. For the nominally significant risk-associated index variants in men of African ancestry (OR>1.0 and p<0.05; n=28), which are likely to be more strongly correlated with the functional alleles in this population, the mean RAF difference was 8%. Similar differences were also observed when evaluating the median RAFs and when incorporating AA markers (Supplementary Table S4). Although based on only a subset of markers that were significantly associated with risk at p<0.05 (n=28 index SNPs or n=42 index plus AA markers), there is a suggestion that the risk alleles for prostate cancer at these loci may be more common in men of African ancestry than in the initial GWAS population. This assertion will need to be reassessed and formally tested once the underlying biologically functional alleles are discovered.
When considering the index SNPs and AA markers, only 5 (6%) of the 82 known risk signals were more associated with aggressive disease based on the case-only analysis (4 expected at α=0.05), with the top three variants being rs7141529 (Phet=0.0087) at 14q24, rs339331 (Phet=0.0093) at 6q22, and rs721048 (Phet=0.018) at 2p15 (Supplementary Table S5). Of these, rs339331 is linked to a non-synonymous variant in the gene GPRC6A23; it has also been suggested to function by regulating RFX6 expression through modulating HOXB13 chromatin binding24.
We further examined the cumulative effect of the risk signals through a composite risk score (see Methods). Using the index SNPs (n=82), the risk per allele was 1.06 (95% CI, 1.05-1.07, p=6.7×10-53) and individuals in the top quintile of the risk score distribution were at 2.7-fold greater risk compared to those in the lowest quintile (Table 1). As expected, the risk modeling was improved when incorporating AA markers and restricting to variants that were significantly associated with risk in men of African ancestry (n=44; Supplementary Table S6). The risk per allele was 1.12 (95% CI, 1.11-1.13, p=7.3×10-98), with the risk comparing the top versus the lowest quintile being 3.7 (Table 1). In aggregate, these variants can stratify men more effectively than the strongest known risk factor, a first-degree family history of prostate cancer, which has a relative risk of ~2.025. Associations of similar strength were observed for aggressive and non-aggressive prostate cancer (Phet=0.05; Table 1). When stratifying by age, risk for younger men (age≤65) in the top quintile was 4.4-times those in the lowest quintile, while the odds ratio for men older than 65 years of age was 2.9 (Pinteraction=0.02; Supplementary Table S6). While these variants are informative for stratifying prostate cancer risk in men of African ancestry, their combined effects in each stratum are modest and they have limited ability to differentiate aggressive versus non-aggressive disease. Thus, their potential for predictive clinical utility remains limited. Together with identifying and directly testing the biologically functional alleles at these known loci, which is likely to improve population risk stratification, efforts are still needed to reveal variants that are of particular importance and potentially unique to men of African ancestry, such as those at 8q245 and 17q214. Larger-scale replication testing of variants from this GWAS in men of African ancestry is underway as part of the NCI GAME-ON Consortium (http://epi.grants.cancer.gov/gameon/), in an attempt to further discover loci that may help us to better understand the higher risk of prostate cancer in this population as well as to develop genetic risk prediction profiles that may be more suitable and tailored for this population.
Table 1.
A genetic risk score for prostate cancer in men of African ancestry.
| Index markers from GWAS (n=82) | Risk-associated markers in men of African ancestry (n=44)
|
||||
|---|---|---|---|---|---|
| Prostate cancer | Overall | Overall | Aggressivea | Non-aggressive | |
| Per alleleb | |||||
| N (cases/controls) | 4,853/4,678 | 4,853/4,678 | 1,238/4,678 | 3,615/4,678 | |
| OR(95% CI)c | 1.06(1.05-1.07) | 1.12(1.11-1.13) | 1.14(1.12-1.16) | 1.12(1.10-1.13) | |
| P-value | 6.7×10-53 | 7.3×10-98 | 7.5×10-50 | 2.6×10-77 | |
| Quintiles of risk allelesd | |||||
| Q1 | N (cases/controls) | 568/934 | 488/936 | 124/936 | 364/936 |
| OR(95% CI)c | 1.0(ref.) | 1.0(ref.) | 1.0(ref.) | 1.0(ref.) | |
| P-value | - | - | - | - | |
| Q2 | N (cases/controls) | 725/937 | 658/935 | 161/935 | 497/935 |
| OR(95% CI)c | 1.26(1.09-1.46) | 1.39(1.19-1.61) | 1.34(1.04-1.74) | 1.41(1.19-1.67) | |
| P-value | 1.9×10⁻³ | 2.5×10⁻⁵ | 2.5×10⁻² | 5.4×10⁻⁵ | |
| Q3 | N (cases/controls) | 993/935 | 893/936 | 220/936 | 673/936 |
| OR(95% CI)c | 1.74(1.51-2.01) | 1.91(1.65-2.22) | 1.85(1.44-2.36) | 1.93(1.64-2.27) | |
| P-value | 1.0×10⁻¹⁴ | 6.0×10⁻¹⁸ | 1.2×10⁻⁶ | 2.3×10⁻¹⁵ | |
| Q4 | N (cases/controls) | 1,061/936 | 1,105/935 | 281/935 | 824/935 |
| OR(95% CI)c | 1.85(1.61-2.13) | 2.39(2.07-2.77) | 2.51(1.98-3.20) | 2.37(2.02-2.78) | |
| P-value | 8.7×10⁻¹⁸ | 4.9×10⁻³² | 6.6×10⁻¹⁴ | 3.1×10⁻²⁶ | |
| Q5 | N (cases/controls) | 1,506/936 | 1,709/936 | 452/936 | 1,257/936 |
| OR(95% CI)c | 2.67(2.33-3.06) | 3.69(3.20-4.26) | 4.07(3.23-5.13) | 3.57(3.06-4.18) | |
| P-value | 1.6×10-44 | 1.9×10-72 | 2.0×10⁻³² | 1.3×10-57 | |
Metastatic disease, PSA>100 (ng/mL), Gleason Score ≥8 and/or prostate cancer as a cause of death.
Among controls, mean and range for the 82 index alleles is 77 (53-97); for the 44 risk-associated alleles the mean and range is 40 (26-56).
Odds ratio and 95% confidence interval adjusted for age, study, and global ancestry (the 1st 10 eigenvectors).
Quintiles based on distribution in controls (cutpoints for 82 SNPs: 72.0, 75.0, 78.0 and 81.2; for 44 SNPs: 36.7, 39.0, 41.1 and 43.7).
Compared to our previous study (case/control: 3,425/3,290)3, the current study has greater power because of increased sample size (case/control: 4,853/4,678). Of the 38 SNPs that we have re-examined in this study, 25 (66%) were more significantly associated with prostate cancer risk than in our previous study due to the greater sample size. Furthermore, we included 44 additional risk variants that have been discovered since our last publication and imputed to 1000 Genomes Project (versus HapMap in our previous study), which allowed for a more comprehensive assessment of common variation at each locus.
To date, this is the largest study of prostate cancer in men of African ancestry to examine the generalizability of risk with the established variants. These findings suggest that the vast majority of currently known variants also contribute to prostate cancer risk in men of African ancestry. Although power was <80% for 32 (39%) of the 82 variants tested, the direction of effect sizes for these variants in men of African ancestry was generally consistent with the previous reports. In exploring each locus, the number of variants that were significantly associated with risk increased from 30 (37%) to 44 (54%). Further fine-mapping of these susceptibility loci in larger multiethnic samples will be required to reveal the underlying biologically relevant variants as well as the best set of genetic markers for prostate cancer risk stratification in men of African ancestry.
Supplementary Material
Novelty & Impact Statements.
In the largest study to date, we found the vast majority of established prostate cancer risk variants also contribute to prostate cancer risk in men of African ancestry. A subset of variants were also found to be informative for prostate cancer risk modeling in this population. These findings motivate further genomic characterization to understand the contribution of these loci to risk in this population which may be influenced by linkage disequilibrium patterns.
Acknowledgments
The MEC and the genotyping in this study were supported by NIH grants CA63464, CA54281, CA1326792, CA148085 and HG004726. Genotyping of the PLCO samples was funded by the Intramural Research Program of the Division of Cancer Epidemiology and Genetics, NCI, NIH. LAAPC was funded by grant 99-00524V-10258 from the Cancer Research Fund, under Interagency Agreement #97-12013 (University of California contract #98-00924V) with the Department of Health Services Cancer Research Program. Cancer incidence data for the MEC and LAAPC studies have been collected by the Los Angeles Cancer Surveillance Program of the University of Southern California with Federal funds from the NCI, NIH, Department of Health and Human Services, under Contract No. N01-PC-35139, and the California Department of Health Services as part of the statewide cancer reporting program mandated by California Health and Safety Code Section 103885, and grant number 1U58DP000807-3 from the Centers for Disease Control and Prevention. KCPCS was supported by NIH grants CA056678, CA082664 and CA092579, with additional support from the Fred Hutchinson Cancer Research Center. MDA was support by grants, CA68578, ES007784, DAMD W81XWH-07-1-0645, and CA140388. GECAP was supported by NIH grant ES011126. CaP Genes was supported by CA88164 and CA127298. IPCG was support by DOD grant W81XWH-07-1-0122. DCPC was supported by NIH grant S06GM08016 and DOD grants DAMD W81XWH-07-1-0203, DAMD W81XWH-06-1-0066 and DOD W81XWH-10-1-0532. SCCS is funded by NIH grant CA092447. SCCS sample preparation was conducted at the Epidemiology Biospecimen Core Lab that is supported in part by the Vanderbilt-Ingram Cancer Center (CA68485). Data on SCCS cancer cases used in this publication were provided by the Alabama Statewide Cancer Registry; Kentucky Cancer Registry; Tennessee Department of Health, Office of Cancer Surveillance; Florida Cancer Data System; North Carolina Central Cancer Registry, North Carolina Division of Public Health; Georgia Comprehensive Cancer Registry; Louisiana Tumor Registry; Mississippi Cancer Registry; South Carolina Central Cancer Registry; Virginia Department of Health, Virginia Cancer Registry; Arkansas Department of Health, Cancer Registry. The Arkansas Central Cancer Registry is fully funded by a grant from National Program of Cancer Registries, Centers for Disease Control and Prevention (CDC). Data on SCCS cancer cases from Mississippi were collected by the Mississippi Cancer Registry which participates in the National Program of Cancer Registries (NPCR) of the Centers for Disease Control and Prevention (CDC). The contents of this publication are solely the responsibility of the authors and do not necessarily represent the official views of the CDC or the Mississippi Cancer Registry. The authors thank Drs. Christine Berg and Philip Prorok, Division of Cancer Prevention, NCI, the screening center investigators and staff of the PLCO Cancer Screening Trial, Mr. Thomas Riley and staff at Information Management Services, Inc., and Ms. Barbara O’Brien and staff at Westat, Inc. for their contributions to the PLCO Cancer Screening Trial. We also acknowledge the technical support of Marta Gielzak and Guifang Yan. CPS-II is supported by the American Cancer Society. This work was also supported by European Commission's Seventh Framework Programme grant agreement No. 223175 (HEALTH-F2-2009-223175), Cancer Research UK Grants C5047/A7357, C1287/A10118, C5047/A3354, C5047/A10692, C16913/A6135, and The National Institute of Health (NIH) Cancer Post-Cancer GWAS initiative grant: No. 1 U19 CA 148537-01 (the GAME-ON initiative).
Footnotes
References
- 1.Brawley OW. Prostate cancer epidemiology in the United States. World J Urol. 2012;30:195–200. doi: 10.1007/s00345-012-0824-2. [DOI] [PubMed] [Google Scholar]
- 2.Jemal A, Bray F, Center MM, Ferlay J, Ward E, Forman D. Global cancer statistics. CA Cancer J Clin. 2011;61:69–90. doi: 10.3322/caac.20107. [DOI] [PubMed] [Google Scholar]
- 3.Haiman CA, Chen GK, Blot WJ, Strom SS, Berndt SI, Kittles RA, Rybicki BA, Isaacs WB, Ingles SA, Stanford JL, Diver WR, Witte JS, et al. Characterizing genetic risk at known prostate cancer susceptibility loci in African Americans. PLoS Genet. 2011;7:e1001387. doi: 10.1371/journal.pgen.1001387. [DOI] [PMC free article] [PubMed] [Google Scholar]
- 4.Haiman CA, Chen GK, Blot WJ, Strom SS, Berndt SI, Kittles RA, Rybicki BA, Isaacs WB, Ingles SA, Stanford JL, Diver WR, Witte JS, et al. Genome-wide association study of prostate cancer in men of African ancestry identifies a susceptibility locus at 17q21. Nat Genet. 2011;43:570–3. doi: 10.1038/ng.839. [DOI] [PMC free article] [PubMed] [Google Scholar]
- 5.Haiman CA, Patterson N, Freedman ML, Myers SR, Pike MC, Waliszewska A, Neubauer J, Tandon A, Schirmer C, McDonald GJ, Greenway SC, Stram DO, et al. Multiple regions within 8q24 independently affect risk for prostate cancer. Nat Genet. 2007;39:638–44. doi: 10.1038/ng2015. [DOI] [PMC free article] [PubMed] [Google Scholar]
- 6.Gudmundsson J, Sulem P, Rafnar T, Bergthorsson JT, Manolescu A, Gudbjartsson D, Agnarsson BA, Sigurdsson A, Benediktsdottir KR, Blondal T, Jakobsdottir M, Stacey SN, et al. Common sequence variants on 2p15 and Xp11.22 confer susceptibility to prostate cancer. Nat Genet. 2008;40:281–3. doi: 10.1038/ng.89. [DOI] [PMC free article] [PubMed] [Google Scholar]
- 7.Al Olama AA, Kote-Jarai Z, Giles GG, Guy M, Morrison J, Severi G, Leongamornlert DA, Tymrakiewicz M, Jhavar S, Saunders E, Hopper JL, Southey MC, et al. Multiple loci on 8q24 associated with prostate cancer susceptibility. Nat Genet. 2009;41:1058–60. doi: 10.1038/ng.452. [DOI] [PubMed] [Google Scholar]
- 8.Eeles RA, Kote-Jarai Z, Al Olama AA, Giles GG, Guy M, Severi G, Muir K, Hopper JL, Henderson BE, Haiman CA, Schleutker J, Hamdy FC, et al. Identification of seven new prostate cancer susceptibility loci through a genome-wide association study. Nat Genet. 2009;41:1116–21. doi: 10.1038/ng.450. [DOI] [PMC free article] [PubMed] [Google Scholar]
- 9.Gudmundsson J, Sulem P, Gudbjartsson DF, Blondal T, Gylfason A, Agnarsson BA, Benediktsdottir KR, Magnusdottir DN, Orlygsdottir G, Jakobsdottir M, Stacey SN, Sigurdsson A, et al. Genome-wide association and replication studies identify four variants associated with prostate cancer susceptibility. Nat Genet. 2009;41:1122–6. doi: 10.1038/ng.448. [DOI] [PMC free article] [PubMed] [Google Scholar]
- 10.Jia L, Landan G, Pomerantz M, Jaschek R, Herman P, Reich D, Yan C, Khalid O, Kantoff P, Oh W, Manak JR, Berman BP, et al. Functional enhancers at the gene-poor 8q24 cancer-linked locus. PLoS Genet. 2009;5:e1000597. doi: 10.1371/journal.pgen.1000597. [DOI] [PMC free article] [PubMed] [Google Scholar]
- 11.Sun J, Zheng SL, Wiklund F, Isaacs SD, Li G, Wiley KE, Kim ST, Zhu Y, Zhang Z, Hsu FC, Turner AR, Stattin P, et al. Sequence variants at 22q13 are associated with prostate cancer risk. Cancer Res. 2009;69:10–5. doi: 10.1158/0008-5472.CAN-08-3464. [DOI] [PMC free article] [PubMed] [Google Scholar]
- 12.Kote-Jarai Z, Olama AA, Giles GG, Severi G, Schleutker J, Weischer M, Campa D, Riboli E, Key T, Gronberg H, Hunter DJ, Kraft P, et al. Seven prostate cancer susceptibility loci identified by a multi-stage genome-wide association study. Nat Genet. 2011;43:785–91. doi: 10.1038/ng.882. [DOI] [PMC free article] [PubMed] [Google Scholar]
- 13.Lindstrom S, Schumacher F, Siddiq A, Travis RC, Campa D, Berndt SI, Diver WR, Severi G, Allen N, Andriole G, Bueno-de-Mesquita B, Chanock SJ, et al. Characterizing associations and SNP-environment interactions for GWAS-identified prostate cancer risk markers--results from BPC3. PLoS One. 2011;6:e17142. doi: 10.1371/journal.pone.0017142. [DOI] [PMC free article] [PubMed] [Google Scholar]
- 14.Schumacher FR, Berndt SI, Siddiq A, Jacobs KB, Wang Z, Lindstrom S, Stevens VL, Chen C, Mondul AM, Travis RC, Stram DO, Eeles RA, et al. Genome-wide association study identifies new prostate cancer susceptibility loci. Hum Mol Genet. 2011;20:3867–75. doi: 10.1093/hmg/ddr295. [DOI] [PMC free article] [PubMed] [Google Scholar]
- 15.Akamatsu S, Takata R, Haiman CA, Takahashi A, Inoue T, Kubo M, Furihata M, Kamatani N, Inazawa J, Chen GK, Le Marchand L, Kolonel LN, et al. Common variants at 11q12, 10q26 and 3p11.2 are associated with prostate cancer susceptibility in Japanese. Nat Genet. 2012;44:426–9, S1. doi: 10.1038/ng.1104. [DOI] [PubMed] [Google Scholar]
- 16.Al Olama AA, Kote-Jarai Z, Schumacher FR, Wiklund F, Berndt SI, Benlloch S, Giles GG, Severi G, Neal DE, Hamdy FC, Donovan JL, Hunter DJ, et al. A meta-analysis of genome-wide association studies to identify prostate cancer susceptibility loci associated with aggressive and non-aggressive disease. Hum Mol Genet. 2012 doi: 10.1093/hmg/dds425. [DOI] [PMC free article] [PubMed] [Google Scholar]
- 17.Lindstrom S, Schumacher FR, Campa D, Albanes D, Andriole G, Berndt SI, Bueno-de-Mesquita HB, Chanock SJ, Diver WR, Ganziano JM, Gapstur SM, Giovannucci E, et al. Replication of five prostate cancer loci identified in an Asian population--results from the NCI Breast and Prostate Cancer Cohort Consortium (BPC3) Cancer Epidemiol Biomarkers Prev. 2012;21:212–6. doi: 10.1158/1055-9965.EPI-11-0870-T. [DOI] [PMC free article] [PubMed] [Google Scholar]
- 18.Xu J, Mo Z, Ye D, Wang M, Liu F, Jin G, Xu C, Wang X, Shao Q, Chen Z, Tao Z, Qi J, et al. Genome-wide association study in Chinese men identifies two new prostate cancer risk loci at 9q31.2 and 19q13.4. Nat Genet. 2012;44:1231–5. doi: 10.1038/ng.2424. [DOI] [PMC free article] [PubMed] [Google Scholar]
- 19.Eeles RA, Olama AA, Benlloch S, Saunders EJ, Leongamornlert DA, Tymrakiewicz M, Ghoussaini M, Luccarini C, Dennis J, Jugurnauth-Little S, Dadaev T, Neal DE, et al. Identification of 23 new prostate cancer susceptibility loci using the iCOGS custom genotyping array. Nat Genet. 2013;45:385–91. 91e1–2. doi: 10.1038/ng.2560. [DOI] [PMC free article] [PubMed] [Google Scholar]
- 20.Chang BL, Spangler E, Gallagher S, Haiman CA, Henderson B, Isaacs W, Benford ML, Kidd LR, Cooney K, Strom S, Ingles SA, Stern MC, et al. Validation of genome-wide prostate cancer associations in men of African descent. Cancer Epidemiol Biomarkers Prev. 2011;20:23–32. doi: 10.1158/1055-9965.EPI-10-0698. [DOI] [PMC free article] [PubMed] [Google Scholar]
- 21.Price AL, Patterson NJ, Plenge RM, Weinblatt ME, Shadick NA, Reich D. Principal components analysis corrects for stratification in genome-wide association studies. Nat Genet. 2006;38:904–9. doi: 10.1038/ng1847. [DOI] [PubMed] [Google Scholar]
- 22.Howie BN, Donnelly P, Marchini J. A flexible and accurate genotype imputation method for the next generation of genome-wide association studies. PLoS Genet. 2009;5:e1000529. doi: 10.1371/journal.pgen.1000529. [DOI] [PMC free article] [PubMed] [Google Scholar]
- 23.Haiman CA, Han Y, Feng Y, Xia L, Hsu C, Sheng X, Pooler LC, Patel Y, Kolonel LN, Carter E, Park K, Le Marchand L, et al. Genome-wide testing of putative functional exonic variants in relationship with breast and prostate cancer risk in a multiethnic population. PLoS Genet. 2013;9:e1003419. doi: 10.1371/journal.pgen.1003419. [DOI] [PMC free article] [PubMed] [Google Scholar]
- 24.Huang Q, Whitington T, Gao P, Lindberg JF, Yang Y, Sun J, Vaisanen MR, Szulkin R, Annala M, Yan J, Egevad LA, Zhang K, et al. A prostate cancer susceptibility allele at 6q22 increases RFX6 expression by modulating HOXB13 chromatin binding. Nat Genet. 2014;46:126–35. doi: 10.1038/ng.2862. [DOI] [PubMed] [Google Scholar]
- 25.Ahn J, Moslehi R, Weinstein SJ, Snyder K, Virtamo J, Albanes D. Family history of prostate cancer and prostate cancer risk in the Alpha-Tocopherol, Beta-Carotene Cancer Prevention (ATBC) Study. Int J Cancer. 2008;123:1154–9. doi: 10.1002/ijc.23591. [DOI] [PubMed] [Google Scholar]
Associated Data
This section collects any data citations, data availability statements, or supplementary materials included in this article.