

Abstract
The superior parietal lobule (SPL) plays a pivotal role in many cognitive, perceptive, and motor‐related processes. This implies that a mosaic of distinct functional and structural subregions may exist in this area. Recent studies have demonstrated that the ongoing spontaneous fluctuations in the brain at rest are highly structured and, like coactivation patterns, reflect the integration of cortical locations into long‐distance networks. This suggests that the internal differentiation of a complex brain region may be revealed by interaction patterns that are reflected in different neuroimaging modalities. On the basis of this perspective, we aimed to identify a convergent functional organization of the SPL using multimodal neuroimaging approaches. The SPL was first parcellated based on its structural connections as well as on its resting‐state connectivity and coactivation patterns. Then, post hoc functional characterizations and connectivity analyses were performed for each subregion. The three types of connectivity‐based parcellations consistently identified five subregions in the SPL of each hemisphere. The two anterior subregions were found to be primarily involved in action processes and in visually guided visuomotor functions, whereas the three posterior subregions were primarily associated with visual perception, spatial cognition, reasoning, working memory, and attention. This parcellation scheme for the SPL was further supported by revealing distinct connectivity patterns for each subregion in all the used modalities. These results thus indicate a convergent functional architecture of the SPL that can be revealed based on different types of connectivity and is reflected by different functions and interactions. Hum Brain Mapp, 36:238–257, 2015. © 2014 Wiley Periodicals, Inc.
Keywords: parcellation, structural connectivity, functional connectivity, coactivation, behavioral domains analyses
INTRODUCTION
The superior parietal lobule (SPL) plays a pivotal role in many sensory and cognitive processes, including somatosensory and visuomotor integration [Culham and Valyear, 2006; Iacoboni, 2006], motor learning [Weiss et al., 2003; Wenderoth et al., 2004], spatial perception [Weiss et al., 2003], mental rotation [Vingerhoets et al., 2002; Wolbers et al., 2003], visuospatial attention [Corbetta et al., 1993; Corbetta et al., 1995], and memory [Lacquaniti et al., 1997; Zago and Tzourio‐Mazoyer, 2002]. The functional diversity of the SPL implies that a mosaic of subregions, which might be both functionally and structurally distinct, may exist in this area. Although recent studies have parcellated the SPL into different component subregions on the basis of receptor distribution patterns [Scheperjans et al., 2005a; Scheperjans et al., 2005b], regional cytoarchitectonic properties [Scheperjans et al., 2008a; Scheperjans et al., 2008b], and anatomical connectivity patterns [Mars et al., 2011], the association between these regions and particular functions and networks has, however, remained a largely open question. Furthermore, although various parcellation schemes have been proposed, the relationships between the structural connections, resting state, and task‐dependent functional connectivity (FC) patterns of the SPL or its subregions are still unknown.
Relating structural connections to functional activity is fundamental for understanding the mechanisms of information processing in the human brain. Emerging evidence suggests that ongoing brain spontaneous fluctuations are highly structured [Damoiseaux and Greicius, 2009; Deco et al., 2013] and are sculpted by the history of task‐evoked coactivation [Deco and Corbetta, 2011; Lewis et al., 2009; Shirer et al., 2012]. Furthermore, correspondence, as well as divergence, between structural connectivity and resting‐state and task‐dependent FC has been demonstrated by many previous studies [Eickhoff et al., 2010; Greicius et al., 2009; Hagmann et al., 2008; Honey et al., 2009; Jakobs et al., 2012; Smith et al., 2009; Toro et al., 2008]. The convergence of structural connections, intrinsic FC, and coactivation suggests that a fundamental functional architecture governs both structure and function [Kelly et al., 2012]. Therefore, whether a consistent topography of the SPL can be revealed using different connectivity patterns needs to be further explored and verified.
The goal of this study was, thus, to identify a potentially convergent functional architecture of the SPL on the basis of its specific structural, resting state, and coactivation patterns and to characterize the cortical network and functional organization of each subregion. The SPL was first parcellated into component subregions based on differences in structural as well as in resting‐state and task‐dependent (coactivation) FC patterns. Then, the whole‐brain connectivity patterns of each subregion were mapped by each modality and the revealed networks were compared between modalities. Finally, using behavioral domain and paradigm analyses, a functional characterization was performed to determine the functions associated with each subregion.
MATERIALS AND METHODS
Definition of Regions of Interest
Both the left and right SPL masks were defined using the automated anatomical labeling template which was obtained from the brain of a single subject in Montreal Neurological Institute (MNI) space [Tzourio‐Mazoyer et al., 2002]. In this template, the superior parietal cortex is divided into two subareas. The lateral superior parietal cortex is defined as the SPL, whereas the medial superior parietal cortex is defined as the precuneus. Based on this template, we extracted the lateral SPLs as the regions of interest in this study. Then, the seed masks in MNI space were transformed into each participant's individual diffusion space using statistical parametric mapping (SPM8) software for fiber tracking. In addition, the SPL seed masks were resampled into 3 mm cubic voxels in MNI space for resting‐state FC analyses. Finally, the SPL seed masks were also resampled into 2 mm cubic voxels in MNI space for whole‐brain coactivation map calculations for each voxel in the SPL.
Subjects
Twenty healthy, right‐handed subjects (10 males and 10 females, mean age = 18.5 years, standard deviation = 0.76) were recruited via advertisement. None of the participants had ever suffered from any psychiatric or neurological disease, and none had any contraindications for MRI scanning. All the subjects signed an informed consent form approved by the local Research Ethics Committee of the University of Electronic Science and Technology of China.
MRI Data Acquisition
All the subjects were scanned using a 3.0 Tesla GE MR Scanner. The DWI data included 64 images with noncollinear diffusion gradients (b = 1000 s/mm2) and three nondiffusion‐weighted images (b = 0 s/mm2). From each participant, 75 slices were collected with the following parameters: acquisition matrix = 128 × 128, flip angle (FA) = 90°, voxel resolution: 2 × 2 × 2 mm3, and no gap. Sagittal 3D T1‐weighted images were also acquired (Repetition time (TR)/echo time (TE) = 8.16/3.18 ms; inversion time = 800 ms; FA = 7°; field of view (FOV) = 256 × 256 mm2; matrix = 256 × 256; slice thickness = 1 mm, no gap; 188 sagittal slices). During the resting‐state fMRI scanning, subjects were instructed to close their eyes and lie still. Cushions were used to reduce head motion. Two hundred and fifty five volumes of echo planar images were acquired (repetition time = 2000 ms, echo time = 30 ms; no gap; 40 axial slices, voxel size, 3.75 × 3.75 × 4 mm3).
DWI Data Preprocessing
The data were preprocessed using FMRIB's Diffusion Toolbox (FSL 4.0; http://www.fmrib.ox.ac.uk/fsl). Eddy currents and head motions were corrected. Skull‐stripped T1‐weighted images for each subject were coregistered to the subject's nondiffusion‐weighted image (b = 0 s/mm2) using a SPM8 package (http://www.fil.ion.ucl.ac.uk/spm). Next, the T1 images (rT1) obtained in diffusion space were transformed to the MNI's Colin27 structural template. Finally, an inverse transformation was performed to transform the seed masks of the left and right SPL into the diffusion space for each subject.
Resting‐State fMRI Data Preprocessing
Preprocessing of the resting‐state functional magnetic resonance imaging (fMRI) data was carried out using scripts provided by the 1000 Functional Connectomes Project (http://www.nitrc.org/projects/fcon_1000) with both FSL and AFNI (http://afni.nimh.nih.gov/afni) software. The preprocessing steps were: (1) discarding the first 10 volumes of each functional time series to allow for magnetization equilibrium, (2) correcting the slice timing for the remaining images and realigning them to the first volume to provide for head motion correction, (3) normalizing the mean‐based intensity and spatial smoothing with a Gaussian kernel of 6‐mm full‐width at half maximum, (4) removing linear and quadratic trends and temporal band‐pass filtering (0.01–0.08Hz), (5) regressing out nuisance signals such as those from white matter and cerebrospinal fluid as well as global signals and six motion parameters, and (6) resampling the functional data into MNI space using the concatenated transformations. In the end, this preprocessing procedure provided a four‐dimensional time series in standard MNI space for each participant.
Structural Connectivity‐Based Parcellation
Diffusion probabilistic tractography was performed using the FSL package. Probability distributions were estimated for two fiber directions at each voxel [Behrens et al., 2007]. Probabilistic tractography was applied by sampling 5000 streamline fibers in each voxel in the seed region to estimate the connectivity probability. Then, a small threshold value was used to threshold the path distribution estimates (10 out of 5000 samples) [Makuuchi et al., 2009]. Using this fixed arbitrary threshold, our goal was both to reduce false‐positive connections (random noise) and retain enough sensitivity to not miss true connections [Heiervang et al., 2006; Johansen‐Berg et al., 2007]. To facilitate data storage and analysis, all of the connectivity profiles for each voxel were down sampled to 5 mm isotropic voxels [Johansen‐Berg et al., 2004]. Cross‐correlations (dimensions: number of seeds × number of seeds) between the connectivity patterns of all voxels in the seed mask were calculated and used for automatic parcellation. The (i, j)th element value of the cross‐correlation was defined by the correlation between the connectivity profile of seed i and the connectivity profile of seed j [Johansen‐Berg et al., 2004].
The cross‐correlation matrix was then permutated using spectral clustering (not spectral reordering) with an edge‐weighted centroidal Voronoi tessellations method for automated clustering to define different clusters [Wang et al., 2012]. Importantly, the number of clusters must be defined by the experimenter when using this method. In this study, the number of clusters was set from 2 to 9. Then, the maximum probability map was created for each solution across all the subjects. To calculate the maximum probability map, we transformed each individual parcellation result from the diffusion space to the Colin27 template in MNI space. The maximum probability map was calculated based on all the subjects' parcellation results in MNI space. The maximum probability map was calculated by assigning each voxel of the reference space to the area in which it was most likely to be located. If two areas showed the same probability at a particular voxel, this voxel was assigned to the area with the higher average probabilities of the 26 voxels directly adjacent [Eickhoff et al., 2005].
FC‐Based Parcellation
In this study, we also applied distinct resting‐state FC patterns to subdivide the SPL into different subregions. First, the SPL seed masks were resampled into 3 mm cubic voxels and the functional connections between each voxel in the seed area and other voxels of the brain were calculated for each subject. Then, these FC maps were converted to z‐score maps using a Fisher transform. Similarity of FC maps for every pair of voxels within the SPL was computed using eta2 [Cohen et al., 2008; Kelly et al., 2012; Nebel et al., 2012], resulting in a correlation matrix which is the fraction of the variance in one FC map accounted for by the variance in a second FC map. Then, spectral clustering with an edge‐weighted centroidal Voronoi tessellations method was applied to parcellate the SPL into different numbers of clusters (2 to 9). Moreover, the maximum probability map was also calculated for each parcel result.
where ai and bi are the values at position i in the FC maps a and b, respectively. mi is the mean value of the two FC maps at position i, and is the grand mean across all locations in both correlation maps.
Coactivation Connectivity‐Based Parcellation
The task‐dependent coactivation connectivity pattern‐based parcellation was also applied to investigate the subdivision of the SPL [Clos et al., 2013] in this study. The whole‐brain coactivation pattern for each voxel of the SPL was obtained based on the BrainMap database [Laird et al., 2011; Laird et al., 2009]. These analyses in our study utilized a database of positron emission tomography and fMRI experiments from normal neuroimaging studies (no interventions, no group comparisons) in healthy subjects that reported results as coordinates in stereotaxic space. Based on these inclusion criteria, approximately 7500 neuroimaging experiments were obtained. To enable a reliable delineation of the task‐based FC, we pooled the voxels in the neighborhood of each seed voxel and identified those experiments that reported activations closest to the current seed voxel, with the extent of this spatial filter ranging from 20 to 200 experiments in steps of five. This was achieved by computing and subsequently sorting the Euclidian distances between a given seed voxel and any reported activation. In the following step, the whole‐brain coactivation pattern for each seed voxel was computed by an activation likelihood estimation (ALE) meta‐analysis of the experiments that were associated with that particular voxel [Eickhoff et al., 2012; Eickhoff et al., 2009; Turkeltaub et al., 2012]. The ALE scores for each voxel in the gray matter were then recorded as the coactivation connectivity pattern for this voxel [Bzdok et al., 2013a; Cieslik et al., 2013]. The whole‐brain coactivation connectivity for all the seed voxels was subsequently combined into a N × M matrix where N was the number of seed voxels in the SPL and M was the number of target voxels throughout the whole brain (resolution: 2 × 2 × 2 mm3). Finally, the parcellation of the SPL was performed in the optimal filter range from 115 to 160 with k = 2, 3 … 9 using one minus the correlation between the connectivity patterns of the individual seed voxels as the correlation distance measure [Clos et al., 2013].
Determining the Cluster Numbers
Knowing how best to determine the number of clusters in brain areas' subdivision studies is difficult. In this study, we used the generalized Dice coefficient as an index to determine the final cluster numbers [Dice, 1945]. In the end, the maximum consistency between the parcellation results that were obtained from the structural, functional, and coactivation connectivities was set as the optimal number of clusters. This analysis revealed a five‐way parcellation of the SPL as the most consistent solution, which was used to guide for further analyses.
Overlap With Cytoarchitectonic Mapping
To test the hypothesis that connectivity‐based parcellation of the SPL might correspond to distinct nuclei defined on the basis of cytoarchitecture [Scheperjans et al., 2008a], the three types of connectivity‐based parcellation results for the SPL were anatomically assigned to cytoarchitectonic maximum probability maps of the SPL using the SPM Anatomy toolbox [Eickhoff et al., 2005]. Finally, the overlap between the SPL subregions obtained from the anatomical, resting state, and coactivation connectivity‐based parcellations and the cytoarchitectonic subregions of the SPL were calculated separately.
Whole‐Brain Structural Connectivity Patterns
To investigate the relationship between structure and function, we mapped the whole‐brain structural, resting‐state functional, and task‐related coactivation connectivity for each of the derived clusters. To map the whole‐brain anatomical connectivity pattern for each subregion of the SPL, we transformed the seed masks to diffusion space, and Probtracking [Behrens et al., 2003] was used to obtain the connectivity probability between each subregion of the SPL and all the other voxels in the brain. We drew 5000 samples from the connectivity distribution for each voxel and calculated the connection probability for each voxel. The identified fiber tracts were transformed into MNI space and all the connection probability maps were averaged to obtain a mean probability connectivity map for each subregion.
Whole‐brain resting‐state FC
To determine the FC for each subregion in MNI space, we first resampled these subregions to 3 mm cubic voxels in MNI space. In this study, the FC was defined by the correlations between the time series. The Pearson correlation coefficients between the mean time series of each seed region and that of each voxel of the whole brain were calculated for each subject and then converted to z‐values using Fisher's z transformation to improve normality. Then, each individual's z‐values were entered into a random effects one‐sample t‐test in a voxel‐wise manner to determine the regions that showed significant correlations with the seed region. Then, the FC map was thresholded at a cluster‐level FWE‐corrected threshold of P < 0.05 (cluster‐forming threshold at voxel‐level P < 0.001).
Whole‐brain coactivation connectivity
The task‐dependent coactivated FC of each subregion was mapped using structure‐based meta‐analysis and meta‐analytic connectivity modeling (MACM) [Eickhoff et al., 2010; Laird et al., 2013; Robinson et al., 2010] approaches in the BrainMap database that featured at least one focus of activation in the particular connectivity‐based parcellation‐yielded subregion. Then, an ALE meta‐analysis was performed on the obtained experiments, and statistical inference calculations were also performed to establish which brain regions were significantly coactivated with a particular subregion, as obtained from the connectivity‐based parcellation. The ALE score for the MACM analysis of each cluster was compared to a null distribution that reflected a random spatial association between experiments with a fixed within‐experiment distribution of foci [Eickhoff et al., 2009]. This random‐effects inference assesses the above‐chance convergence between experiments instead of the clustering of foci within a particular experiment. The observed ALE scores from the actual meta‐analysis of experiments activated within a particular subregion were then tested against the ALE scores obtained under this null‐distribution yielding a P‐value based on the proportion of equal or higher random values [Eickhoff et al., 2012]. These nonparametric P‐values were converted to z‐scores and thresholded at P < 0.05 (cluster‐level FEW‐corrected, cluster‐forming threshold at voxel‐level P < 0.001).
Specific resting‐state FC pattern for each subregion
In this study, we mapped the specific resting‐state FC pattern of each subregion of the SPL to reveal the unique resting‐state FC for each cluster. The specific connectivity was the brain areas that were significantly more coupled with a given subregion than with any of the others.
Specific coactivation connectivity pattern of each subregion
Moreover, we examined the specific coactivation connectivity pattern for each subregion to reveal the unique coactivation connectivity for each cluster. The specific coactivation connectivity was the brain regions which were significantly more coupled with a given subregion than with any of the others.
Overlap networks
We mapped the overlap networks formed by the overlapping the resting‐state functional and coactivation networks. To calculate the conjunction network, we first obtained whole‐brain resting‐state functional and coactivation networks, as described above. Then, the overlap between the two networks was calculated for each subregion.
To quantitatively evaluate the correspondence between the resting‐state and task‐based coactivation network, we calculated the Pearson cross‐correlation coefficient between the resting‐state functional network and the coactivation network for each SPL subregion on the basis of resting‐state fMRI data [Smith et al., 2009]. The cross‐correlation coefficients indicated that the same network that was identified from the resting‐state FC for each SPL subregion is likely to be involved in specific cognitive tasks.
Functional Characterization: Behavioral Domain Analysis
The functional characterization of the connectivity‐based parcellation‐yielded subregions was based on a behavioral domain and paradigm class analyses in the BrainMap database. The behavioral domain analysis results included five behavior domains (Action, Cognition, Emotion, Interoception, and Perception) and 51 behavioral subdomains. The paradigm class analysis primarily categorizes the specific task used. The functional characterization of each subregion yielded by the connectivity‐based parcellation was determined using forward and reverse inferences [Bzdok et al., 2013a; Cieslik et al., 2013; Clos et al., 2013; Rottschy et al., 2013]. Forward inference represents the probability of observing activity in a brain region given knowledge of the psychological process, whereas reverse inference is the probability of a psychological process being present given information about activation in a particular brain region. In the forward inference approach, a subregion's functional profile was determined by identifying the taxonomic labels (domains or subdomains) for which the probability of finding activation in a specific subregion was significantly higher than the overall chance (across the entire database) of finding activation in that particular subregion. Significance was established using a binomial test (P < 0.05 corrected for multiple comparisons using the false discovery rate [FDR] method) [Eickhoff et al., 2011]. In the reverse inference approach, a subregion's functional profile was determined by identifying the most likely behavioral domains and paradigm classes given activation in a particular subregion using Bayes' rule. Significance (P < 0.05 corrected for multiple comparisons using Bonferroni's method) was then assessed by means of a chi‐square test [Clos et al., 2013].
RESULTS
Connectivity‐Based Parcellation of the SPL
In this study, we utilized the structural connectivity pattern, intrinsic FC pattern and coactivation connectivity pattern to parcellate the human SPL into distinct components to establish the functional organization of its subregions. To determine the number of subregions in the SPL, we calculated the degree of overlap between the maximum probability maps from the structural connectivity‐based parcellation, the maximum probability maps from the resting‐state FC‐based parcellation and the coactivated connectivity‐based parcellation results of the SPL. The optimal number of parcels for the left and right SPLs was estimated to be 5, which was the nontrivial (k > 2) clustering solution that resulted in the highest Dice's coefficient between clustering solutions for the three types of parcellation (Fig. 1A, B). Therefore, we selected a five‐way parcellation of the SPL as a guide for further analyses (Fig. 1C). Furthermore, this parcellation scheme for the left and right SPLs was the same for all three types of connectivity‐based parcellation results and showed high consistency with the cytoarchitectonic mapping of the SPL.
Figure 1.

Superior parietal lobule (SPL) parcellation results using multimodal neuroimaging methods and selection of the optimal number of SPL subregions. (A) The degree of overlap between the structural, resting‐state functional, and coactivation connectivity‐based parcellation results of the left (SPL) was calculated for each number of clusters using the generalized Dice coefficient. (B) The degree of overlap between the structural, resting‐state functional, and coactivation connectivity‐based parcellation results of the right SPL was computed as in A. (C) The maximum probability maps for the SPL subregions were obtained using structural and resting‐state functional connectivity‐based parcellation in the first two column. The third and last column showed the SPL parcellation result obtained on the basis of a coactivation connectivity‐based parcellation and the overlap between the parcellation results across the different modalities. [Color figure can be viewed in the online issue, which is available at http://wileyonlinelibrary.com.]
In the final SPL parcellation results, the most anterior clusters were Cluster 1 (blue/label 1) and Cluster 2 (green/label 2), which were behind the postcentral sulcus. Cluster 1 was ventral to Cluster 2 and corresponded with the cytoarchitectonically defined area 7PC [Scheperjans et al., 2008a], whereas the dorsal Cluster 2 was similar in location to the cytoarchitectonically defined area 5L [Scheperjans et al., 2008a]. Cluster 3 (yellow/label 3) was posterior to Cluster 1 and resembled area hIP3, as defined by cytoarchitecture [Scheperjans et al., 2008a]. Cluster 4 (ocher/label 4) was medial to Cluster 3 and posterior to Cluster 2 and was similar in location to the cytoarchitectonically defined area 7A [Scheperjans et al., 2008a]. The most posterior cluster in the SPL was Cluster 5 (red/label 5), which resembled the cytoarchitectonic subdivision 7P [Scheperjans et al., 2008a].
Furthermore, we calculated the overlap to characterize the consistency between the connectivity‐based parcellation of the SPL and the cytoarchitectonic mapping of the SPL. The overlap for each SPL subregion was separately computed between the cytoarchitectonic mapping and the anatomical, resting state, and coactivation connectivity‐based parcellations (Fig. 2). The left subregions of the SPL showed a high level of consistency in Clusters 1, 2, and 5 (Cluster 1: DTI, 79.66%, Resting state, 93.22%, Coactivation, 55.08%; Cluster 2: DTI, 68.63%, Resting state, 77.86%, Coactivation, 85.42%; Cluster 4: DTI, 47.57%, Resting state, 85.11%, Coactivation, 87.15%). However, the overlap between the anatomical connectivity‐based parcellation and the cytoarchitectonic mapping was very low for Clusters 3 and 4 (Cluster 3: DTI, 14.82%, Resting state, 24.91%, Coactivation, 42.11%; Cluster 4: DTI, 12.28%, Resting state, 37.48%, Coactivation, 32.49%). The right subregions of the SPL showed a high level of overlap between the connectivity‐based parcellation and the cytoarchitectonic mapping for all subregions (Cluster 1: DTI, 39.23%, Resting state, 60.39%, Coactivation, 66.77%; Cluster 2: DTI, 43.84%, Resting state, 87.58%, Coactivation, 81.73%; Cluster 3: DTI, 67.06%, Resting state, 64.71%, Coactivation, 55.29%; Cluster 4: DTI, 30.97%, Resting state, 38.45%, Coactivation, 43.31%; Cluster 5: DTI, 56.22%, Resting state, 39.27%, Coactivation, 73.76%).
Figure 2.
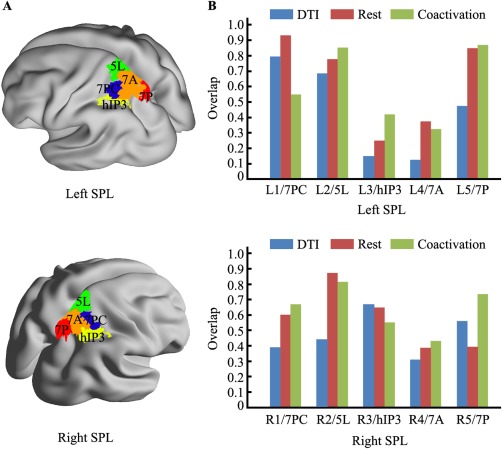
The overlap with the cytoarchitectonic map of the superior parietal lobule (SPL). (A) The maximum probability map for each SPL subregion as defined using cytoarchitecture and extracted using the SPM Anatomy Toolbox. (B) The overlap between the cytoarchitectonic map of each SPL subregion and the corresponding SPL subregion derived using the different neuroimaging modalities of connectivity‐based parcellation as calculated for each hemisphere. [Color figure can be viewed in the online issue, which is available at http://wileyonlinelibrary.com.]
Whole‐Brain Structural Connectivity
We mapped the whole‐brain structural connectivity of each subregion of the SPL. The whole‐brain structural connectivity revealed different whole‐brain connectivity patterns for each subregion. The primary anatomical connections for the first left and right subregions (L1, R1) were in the postcentral gyrus, inferior parietal lobule (IPL), insula, and inferior frontal gyrus via the superior longitudinal fasciculus (SLF) ІІ and extreme capsule (EmC) [Makris et al., 2005; Makris and Pandya, 2009]. The structural connectivity patterns of L2 and R2 were primarily to the insula, inferior frontal gyrus, contralateral parietal cortex, and brainstem through the EmC, corpus callosum (CC), and corticospinal tract. L3 and R3 primarily connected with the IPL, inferior frontal gyrus, insula, and contralateral posterior parietal cortex through the EmC and CC. Unlike the R3, the most significant white matter pathway for L3 was the CC connected to the contralateral posterior parietal cortex. The connectivity patterns of L4 and R4 were similar to those of L2 and R2, except that L4 and R4 showed more connections with the contralateral superior temporal gyrus (STG) and fewer connections with the contralateral posterior parietal cortex via the CC. The most posterior subregions, L5 and R5, predominantly connected with the STG, inferior frontal gyrus, insula, posterior hippocampus, and contralateral posterior parietal cortex via the EmC and CC (Fig. 3).
Figure 3.

Whole‐brain structural, resting‐state functional, and coactivation connectivity patterns for each subregion. Whole‐brain population maps of the probabilistic tractography results for each subregion of the SPL. The main tract pathways include the SLF, extreme capsule (EmC), and corpus callosum (CC). Whole‐brain resting‐state functional connectivity patterns for each cluster were obtained using one sample t‐tests (thresholded at P < 0.05, cluster‐level FEW‐corrected, cluster‐forming threshold at voxel‐level P < 0.001). The whole‐brain coactivation connectivity pattern for each subregion of the SPL was obtained using meta‐analytical connectivity modeling (MACM) analyses (thresholded at P < 0.05, cluster‐level FEW‐corrected, cluster‐forming threshold at voxel‐level P < 0.001). [Color figure can be viewed in the online issue, which is available at http://wileyonlinelibrary.com.]
Whole‐Brain Resting‐State FC
The whole‐brain resting‐state FC of each subregion, as identified by connectivity‐based parcellation, was mapped to reveal its intrinsic functional organization (Fig. 3). The resting‐state FC patterns of the SPL subregions were very similar to those of the structural connectivity patterns. For L1 and R1, the primary functional connections were in the precentral gyrus, postcentral gyrus, IPL, posterior inferior temporal gyrus (ITG), and cerebellum. L2 and R2 were primarily correlated with the postcentral gyrus, dorsal premotor cortex (PMd), anterior STG, posterior ITG, and cerebellum. L3 and R3 were primarily functionally connected with the anterior inferior frontal gyrus, frontal eye field, PMd, and posterior ITG. The functional correlated brain areas for L4 and R4 were found in the PMd, supramarginal gyrus, posterior ITG, and cerebellum. L5 and R5 primarily connected with the frontal eye field, middle frontal gyrus, anterior inferior frontal gyrus, and posterior ITG. Comparing L5 and R5, we found that R5 had additional contralateral connections with the frontal eye field, middle frontal gyrus, but, unlike L5, no connection was found with the cerebellum (Fig. 3).
Whole‐Brain Coactivation Connectivity
The whole‐brain coactivation connectivity pattern for each subregion was obtained using MACM analysis. The coactivation connectivity pattern for each subregion was very consistent with each resting‐state FC pattern (Fig. 2). For L1 and R1, the coactivation connectivity was primarily found in the postcentral gyrus, PMd and PMv, inferior frontal gyrus, middle frontal gyrus, posterior ITG, supplementary motor area (SMA), and IPL. For L2 and R2, the primary coactivation connectivity was observed in the PMd and PMv, SMA, superior temporal sulcus, and cerebellum. L3 and R3 primarily coactivated with the ventral and PMd, inferior frontal gyrus, middle frontal gyrus, frontal eye field, SMA, posterior ITG, and visual cortex. The coactivated brain areas for L4 and R4 were similar to those of the third subregions (L3 and R3), but L4 and R4 did not connect with the visual cortex but had additional connectivity with the anterior middle frontal gyrus. Moreover, different coactivation patterns were found for L4 and R4, in that L4 additionally coactivated with the superior temporal sulcus and cerebellum, whereas R4 additionally coactivated with the visual cortex. The brain areas that coactivated with L5 and R5 were primarily in the frontal eye field, middle and inferior frontal gyrus, SMA, posterior ITG, and visual cortex.
Specific resting‐state FC pattern for each subregion
We calculated the specific resting‐state FC pattern for each subregion to identify the unique connectivity of each cluster Figure 4. L1 and R1 particularly connected with the bilateral ventral and PMd, supramarginal gyrus, and postcentral gyrus. L1 has additional connections with the left anterior STG, whereas R1 has additional connections with the bilateral posterior ITG. L2 and R2 were particularly connected with the bilateral STG, postcentral gyrus, and SMA. L3 and R3 had connections with the frontal pole and posterior parietal cortex. L3 had additional connections with the left posterior ITG, left cerebellum, right dorsolateral prefrontal cortex, and frontal polo. L4 had connections with the bilateral posterior ITG and superior occipital gyrus, whereas R4 particularly connected with the bilateral cerebellum and PMd. L5 particularly connected with the left PMd, bilateral SPL, and tempoparietal junction area. R5 particularly connected with the left inferior frontal sulcus (IFS), dorsolateral prefrontal cortex, frontal polo, IPL, middle ITG, and bilateral cerebellum.
Figure 4.

Specific resting‐state functional connectivity pattern of each SPL subregion. Regions show significantly more resting‐state connectivity with a given cluster than with any of the other four clusters. [Color figure can be viewed in the online issue, which is available at http://wileyonlinelibrary.com.]
Specific coactivation connectivity patterns of each subregion
We also mapped the specific coactivation connectivities of each SPL subregion Figure 5. The specific connections for L1 were in the bilateral posterior superior/IPL, right superior occipital gyrus, and posterior ITG, whereas R1 was specifically connected with the left posterior STG, anterior middle temporal (MT) gyrus, and right supramarginal gyrus. L2 particularly connected with the left PMv and PMd, supramarginal gyrus, and right intraparietal sulcus, whereas R2 particularly connected with the left PMv and posterior SPL. L3 and R3 specifically connected with the left PMd, whereas R3 additionally connected with the left posterior angular gyrus. L4 particularly connected with bilateral inferior frontal gyrus, PMv, right supramarginal gyrus, and posterior ITG, whereas R4 specifically connected with the supplementary motor cortex, bilateral intraparietal sulcus, left PMd, and right supramarginal gyrus. L5 had connections with the left PMd, cerebellum, and bilateral posterior ITG. R5 connected with the supplementary motor cortex, bilateral inferior frontal gyrus, PMv, IFS, posterior ITG, middle occipital gyrus, and right PMd.
Figure 5.

Specific coactivation connectivity pattern of each SPL subregion. Regions significantly more coactivated with a given subregion than with any of the other subregions. [Color figure can be viewed in the online issue, which is available at http://wileyonlinelibrary.com.]
Overlap Network
We mapped the intersection of the resting‐state functional and coactivation connectivity patterns to characterize the correspondence between the resting‐state and task functional networks. This intersection was mapped by determining the connectivity shared by both types of networks (Fig. 6). Subregion 1 (L1 and R1) showed this shared connectivity in the PMd and PMv, posterior MT gyrus, IPL, and SMA. For L2 and R2, the shared connectivity was primarily observed in the PMd and SMA. R2 additionally connected with the PMv, STG, and posterior ITG. The conjunction between the two types of connectivity for L3 and R3 was found in the PMd, PMv, posterior IFS, and posterior ITG. The overlap between the functional and coactivation connectivities of L4 and R4 was primarily in the PMd. R4 had a shared connected with the PMv, V3, and posterior ITG. The shared functional and coactivation connectivity for L5 and R5 was predominantly in the PMd and PMv, and connectivity with the MT and IFS was also observed for R5 (Fig. 6).
Figure 6.

Overlapping connectivity between resting‐state functional and coactivation connectivities. The intersection connectivity was calculated with whole‐brain resting‐state functional and coactivation connectivities. We first obtained thresholded whole‐brain resting‐state functional connectivity and coactivation connectivity maps for each SPL subregion and then computed the intersection connectivity between the two modalities. [Color figure can be viewed in the online issue, which is available at http://wileyonlinelibrary.com.]
Quantitative analyses were performed between the resting‐state functional network and the coactivation‐derived network (Fig. 7). High correlation coefficients were obtained between the two networks, further demonstrating the correspondence between the resting‐state and task conditions (Left: L1, r = 0.7422, L2, r = 0.8529, L3, r = 0.5253, L4, r = 0.6441, L5, r = 0.8048; Right: R1, r = 0.9166, R2, r = 0.8609, R3, r = 0.8099, R4, r = 0.8018, R5, r = 0.6677).
Figure 7.

The Pearson cross‐correlation analyses between the resting‐state network and the coactivation network for each SPL subregion on the basis of resting‐state fMRI data. First, the resting‐state functional network and the coactivation network of each SPL subregion were established. Then, the Pearson correlation coefficient between the resting‐state network and coactivation network was calculated.
Functional Characterization: Behavioral Domain and Paradigm Analysis
In addition, we used quantitative forward and reverse inferences on the behavioral domains and paradigm classes to determine the functional organization of all the subregions in the SPL. The significant activation probabilities within a subregion given a certain taxonomic label (forward inference) and the significant probability of domain and paradigm occurrences given activation in a certain subregion (reverse inference) were recorded (Figs. 8 and 9). Functional characterization revealed that the two anterior subregions primarily participated in action processes, whereas the posterior three subregions primarily participated in visual perception and spatial cognition. In summary, the functions that were significantly associated with L1 and R1 were vision motion, observation, space, and execution. L1 was additionally associated with imagination, whereas R1 was additionally associated with vision shape, language orthography, sexuality, and working memory. L2 and R2 were significantly associated with execution. In addition, R2 was associated with motor learning. For L3 and R3, the significantly associated functions were vision shape and space. L3 additionally participated in reasoning, whereas R3 additionally participated in vision motion and execution. L4 and R4 were significantly associated with space, vision motion, working memory, vision shape, and execution. L4 was also associated with attention and reasoning, whereas R4 was also related to imagination and observation. L5 was significantly associated with vision motion, space, vision shape, attention, and working memory, whereas R5 was significantly associated with vision motion, space, vision shape, working memory, motor learning, execution, and attention (Figs. 8 and 9).
Figure 8.

Behavioral domains and paradigm classes of the left SPL subregions. Forward inference and reverse inference were used to determine the functional organization of each subregion. The significant activation probabilities for each subregion with respect to a given domain or paradigm and the significant probability of a domain's or paradigm's occurrence given activation in a cluster are depicted separately. [Color figure can be viewed in the online issue, which is available at http://wileyonlinelibrary.com.]
Figure 9.

Behavioral domains and paradigm classes of the right SPL subregions. Forward inference and reverse inference were used to determine the functional organization of each subregion. The significant activation probabilities for each subregion with respect to a given domain or paradigm and the significant probability of a domain's or paradigm's occurrence given activation in a cluster are depicted separately. [Color figure can be viewed in the online issue, which is available at http://wileyonlinelibrary.com.]
DISCUSSION
A convergent functional architecture of the SPL was revealed on the basis of different connectivity patterns characterized using different neuroimaging modalities. Furthermore, the function of each SPL subregion was also determined using forward and reverse inference. Previous studies have demonstrated correspondence between large‐scale networks defined by resting‐state FC, task‐related coactivation [Cieslik et al., 2013; Eickhoff et al., 2011; Jakobs et al., 2012; Laird et al., 2013; Smith et al., 2009; Toro et al., 2008], and brain structural connectivity [Greicius et al., 2009; Mars et al., 2011]. This correspondence was also found in the SPL subregions. In addition, our findings also supported the hypothesis that the fundamental topographical organization of the brain can be revealed using different connectivity patterns.
Connectivity‐Based Parcellation
It has been well established that the functional segregation of the brain can be characterized by its external connectivity patterns [Passingham et al., 2002]. Recently, connectivity pattern‐based parcellation has been widely used to define the functional subregions of the brain. On the basis of different structural connectivity patterns, Behrens et al. [2003] first parcellated the thalamus into component subregions and found that the different subregions connected with different cortical lobes. Subsequently, many cortical areas have been parcellated to define the functional subregions and showed consistency with cytoarchitectonic mapping [Anwander et al., 2007; Fan et al., 2013; Li et al., 2013; Liu et al., 2013; Mars et al., 2011; Wang et al., 2012; Zhang et al., 2014]. In addition to structural connectivity‐based parcellation, resting‐state FC [Cohen et al., 2008; Kelly et al., 2012; Kim et al., 2010] and task‐dependent coactivation have also been used to identify the subregions of the brain [Bzdok et al., 2013b; Cauda et al., 2012; Cieslik et al., 2013; Clos et al., 2013; Eickhoff et al., 2011]. But this is the first time that any research has explored the relationship between structural, functional, and coactivation connectivity based on connectivity‐based parcellation using different neuroimaging modalities. Based on different types of connectivity patterns, we obtained the structural, functional, and coactivation topography of a brain area. This approach provides a new way to explore the relationship between structure and function. This, together with evidence of a strong correspondence between the networks defined by resting‐state FC, structural connectivity, and coactivation connectivity, suggests that the fundamental brain architecture can be detectable across multiple neuroimaging techniques. Despite considerable methodological variations, this convergent functional architecture suggests that the large‐scale connectivity patterns detected by these different methods and modalities share a common basis [Kelly et al., 2012]. Parcellation of the SPL consistently identified five subregions using different structural, resting‐state functional, and coactivation connectivity patterns. The intersection between the three types of whole‐brain connectivity for each subregion suggested that a common basis exists for the different connectivities. This common connectivity of each subregion may underlie the consistent parcellation of the SPL using different modalities.
Convergence and Divergence of Connectivity Patterns
The observed connectivity patterns for the SPL subregions are quite consistent across different modalities. The presence of a consistent connectivity pattern between the structural and functional connectivities indicates that functional networks are implemented by anatomical connectivity [Eickhoff et al., 2011; Honey et al., 2009]. This concordance may also indicate that FC is structured by anatomical connectivity and that neuronal activity reflects direct physical connectivity [Deco et al., 2013; Zhang et al., 2010]. Moreover, the concordance between the task‐independent resting‐state and the task‐dependent coactivation functional networks for the SPL subregions may support the hypothesis that task‐independent connectivity contributes to keeping functional systems in an active state, thereby improving performance and control whenever FC is needed [van den Heuvel and Hulshoff Pol, 2010]. The presence of such convergent evidence between the two different states strongly suggests that functional coupling with this area along with the coordinated activation of cortical networks during behavior shapes the organized pattern of correlated spontaneous activity at rest [Deco and Corbetta, 2011; Eickhoff and Grefkes, 2011; Shirer et al., 2012]. In spite of the close congruence between the anatomical and FC, some divergences were observed. The observed discrepancies might have resulted from different causes, such as systematic or unsystematic measurement errors and noise or conceptual differences between anatomical and FC [Eickhoff et al., 2011; Eickhoff et al., 2010]. Anatomical and FC assess different properties of the brain network. The former primarily show the direct axonal connections, whereas the latter serve to characterize the interacting nodes in the brain networks. Functionally connected brain areas might not necessary link to each other by direct axonal connections but via a relay structure. Relay connectivity, however, might also be transmitted through cascades of several intermediates or via cortical‐subcortical loops [Eickhoff et al., 2010], such as attentional top‐down modulation from the parietal cortex to the primary visual cortex through the superior colliculus [Gilbert and Li, 2013]. In addition, divergence between the task‐independent rest‐state and the task‐dependent coactivation connectivity was also noted. This divergence may relate to fundamental differences between the two states. Coactivation primarily delineates networks which are concurrently recruited by a broad range of tasks and should, therefore, be able to reflect robust patterns of coordinated activity in response to external task‐demands, whereas the resting‐state function mainly reflects spontaneous networks related to self‐initiated behavior [Eickhoff and Grefkes, 2011]. Hence, the resting‐state functional network cannot be completely mirrored by coactivation networks.
Parcellation of the SPL
Structural heterogeneity of the SPL has been demonstrated in many previous studies, many of which proposed different parcellation schemes for the SPL to characterize its heterogeneity (Fig. 10). The SPL was first defined in the Brodmann atlas as including two anteriorly to posteriorly arranged subareas, BA 5 and BA 7 [Brodmann, 1909]. The anterior BA5 has been described as primarily integrating information from the somatosensory cortex and providing the PMd with a spatial representation of the body parts [Jones et al., 1978; Lacquaniti et al., 1995; Mountcastle et al., 1975; Pandya and Seltzer, 1982]. The posterior BA7, in contrast, was considered to receive input from the visual cortex and provide visual information for the PMd in the context of visually guided reaching movements [Battaglia‐Mayer and Caminiti, 2002; Caminiti et al., 1996; Marconi et al., 2001; Pandya and Seltzer, 1982]. Subsequently, receptor distribution patterns and observer‐independent cytoarchitectonic mapping were also applied to explore the subdivisions of the SPL, and five subregions were identified [Scheperjans et al., 2008a; Scheperjans et al., 2005a; Scheperjans et al., 2008b; Scheperjans et al., 2005b]. Recently, tractography‐based parcellation was also applied to parcellate the SPL into different regions, which showed similar functional and anatomical connectivity [Mars et al., 2011]. Each subregion possessed different functions. These researchers found that the two anterior subregions, that were approximately located on BA 5, primarily participated in visual and somatosensory stimulation, motion processing, and reaching movements, whereas the three posterior subregions primarily participated in visually guided movement, guiding for the location of attention, visuospatial attention, and oculomotor intention. However, none of these studies directly investigated whether the functional topography of the SPL would be consistent between different neuroimaging modalities. Such an investigation could provide important insights into ways to identify brain function. Although all the aforementioned studies parcellated the SPL using cytoarchitecture, receptor distribution patterns, or different anatomical connectivity patterns, the cortical network and functional organization of each SPL subregion remained unknown. In addition, given the asymmetry of the structure, anatomical connections, and functions of the SPL [Corbetta et al., 1993; Koch et al., 2011; Scheperjans et al., 2008a], although Mars et al. [2011] parcellated the right SPL based on different anatomical connectivity patterns, whether this parcellation scheme for the right SPL could be directly extrapolated to the left SPL was still unknown. Nelson et al. [2010] used resting‐state FC to parcellate the left lateral parietal cortex and identified the SPL, but they did not further explore the more fine‐grained subdivisions of the SPL. In a subsequent study, Barnes et al. [2012] subdivided the SPL into two subregions from anterior to posterior in both adults and children, but this parcellation of the SPL cannot well characterize the heterogeneity of the SPL.
Figure 10.
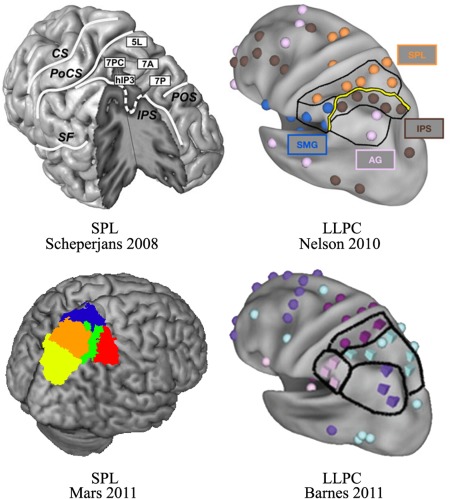
Summary of the parcellation schemes for the superior parietal lobule (SPL). Scheperjans et al. [2008] parcellated the SPL into different subregions on the basis of different cytoarchitectonic properties. Nelson et al. [2010] applied resting‐state functional connectivity to subdivide the left lateral parietal cortex (LLPC) into different parts and identified the SPL. Subsequently, Barnes et al. [2010] used similar procedures to parcellate the LLPC and identified two similar subregions in the SPL in both adults and children. Mars et al. [2011] parcellated the right parietal cortex into subregions, identifying five subregions in the SPL. With permission. [Color figure can be viewed in the online issue, which is available at http://wileyonlinelibrary.com.]
To identify a consistent and symmetrical topographical organization of the left and right SPLs, we used different patterns of structural, resting‐state functional, and coactivation connectivity to parcellate the SPL into subregions in each hemisphere. The resting‐state and task‐related cortical network and their corresponding anatomical basis were established. The two anterior subregions (Clusters 1 and 2) resemble cytoarchitectonic subregions 7PC and 5L, respectively. Visually guided visuomotor and observational processes were primarily associated with the anterior Subregion 1, but the dorsal Subregion 2 was only related to execution function, findings which matched previous functional concepts about the two areas [Buccino et al., 2001; Calvo‐Merino et al., 2005; Calvo‐Merino et al., 2006; Culham et al., 2006]. This indicated that Subregion 2 was involved in motor functions, per se. The functional characterization of the two subregions may suggest that the ventral Subregion 1 receives visual signals for action and the dorsal Subregion 2 takes charge of the corresponding motor output. This functional characterization for Subregions 1 and 2 is furthermore in agreement with the specific coactivation connectivity. The specific coactivation connectivity for Subregion 1 was observed to be to the posterior BA 44 and the IPL, which are related to action observation [Caspers et al., 2010]. The specific coactivation connectivity for Subregion 2 was observed to be with the cerebellum, which is associated with motor function [Stoodley et al., 2012]. The three posterior subregions (Clusters 3, 4, and 5) resemble hIP3, 7A, and 7P, respectively [Scheperjans et al., 2008a]. These three subregions were primarily associated with the functions of reasoning, attention, and working memory. Reasoning was primarily related to Subregions 3 and 4, whereas attention and working memory were primarily related to Subregions 4 and 5. The paradigm analyses results indicated that reasoning and working memory were more likely to be associated with Subregions 3 and 4, respectively. The functional characteristics for the two subregions were also reflected in their connectivity patterns with the anterior inferior frontal gyrus and IFS. The anterior inferior frontal gyrus was primarily associated with reasoning, and the IFS was primarily related to working memory [Goel and Dolan, 2003; Nee et al., 2013]. The paradigm analyses results indicated that Subregion 5 is more likely to participate in visual attention, especially attention shifting [Corbetta et al., 1995; Rushworth et al., 2001; Vandenberghe et al., 2001; Wager et al., 2004]. This functional characterization for this area was also supported by its connectivity with the visual cortex and bilateral frontal eye fields.
SUMMARY AND CONCLUSIONS
In conclusion, we demonstrated that the SPL is a highly heterogeneous region and that the convergent functional architecture of this area can be revealed based on different anatomical, resting‐state functional, and coactivation connectivity patterns. The resulting subregions feature different functional and connectivity profiles which suggest a particular role for them in visually guided visuomotor and observational processes, execution, reasoning, attention, and working memory. In addition, our parcellation results were highly consistent with the cytoarchitectonic mapping findings, thus showing the feasibility of defining the anatomical and functional subregions of brain areas using noninvasive MRI techniques.
ACKNOWLEDGMENT
The authors thank Rhoda E. and Edmund F. Perozzi for editing assistance.
REFERENCES
- Anwander A, Tittgemeyer M, von Cramon DY, Friederici AD, Knosche TR (2007): Connectivity‐based parcellation of Broca's area. Cereb Cortex 17:816–825. [DOI] [PubMed] [Google Scholar]
- Barnes KA, Nelson SM, Cohen AL, Power JD, Coalson RS, Miezin FM, Vogel AC, Dubis JW, Church JA, Petersen SE, Schlaggar BL (2012): Parcellation in left lateral parietal cortex is similar in adults and children. Cereb Cortex 22:1148–1158. [DOI] [PMC free article] [PubMed] [Google Scholar]
- Battaglia‐Mayer A, Caminiti R (2002): Optic ataxia as a result of the breakdown of the global tuning fields of parietal neurones. Brain 125:225–237. [DOI] [PubMed] [Google Scholar]
- Behrens TE, Johansen‐Berg H, Woolrich MW, Smith SM, Wheeler‐Kingshott CA, Boulby PA, Barker GJ, Sillery EL, Sheehan K, Ciccarelli O, Thompson AJ, Brady JM, Matthews PM (2003): Non‐invasive mapping of connections between human thalamus and cortex using diffusion imaging. Nat Neurosci 6:750–757. [DOI] [PubMed] [Google Scholar]
- Behrens TE, Berg HJ, Jbabdi S, Rushworth MF, Woolrich MW (2007): Probabilistic diffusion tractography with multiple fibre orientations: What can we gain? NeuroImage 34:144–155. [DOI] [PMC free article] [PubMed] [Google Scholar]
- Brodmann K (1909): Vergleichende Lokalisationslehre der Groβhirnrinde‐in ihren Prinzipien dargestellt auf Grund des Zellenbaues. Leipzig (Germany): Verlag von Johann Ambrosius Barth.
- Buccino G, Binkofski F, Fink GR, Fadiga L, Fogassi L, Gallese V, Seitz RJ, Zilles K, Rizzolatti G, Freund HJ (2001): Action observation activates premotor and parietal areas in a somatotopic manner: An fMRI study. Eur J Neurosci 13:400–404. [PubMed] [Google Scholar]
- Bzdok D, Laird AR, Zilles K, Fox PT, Eickhoff SB (2013a): An investigation of the structural, connectional, and functional subspecialization in the human amygdala. Hum Brain Mapp 34:3247–3266. [DOI] [PMC free article] [PubMed] [Google Scholar]
- Bzdok D, Langner R, Schilbach L, Jakobs O, Roski C, Caspers S, Laird AR, Fox PT, Zilles K, Eickhoff SB (2013b): Characterization of the temporo‐parietal junction by combining data‐driven parcellation, complementary connectivity analyses, and functional decoding. NeuroImage 81:381–392. [DOI] [PMC free article] [PubMed] [Google Scholar]
- Calvo‐Merino B, Glaser DE, Grezes J, Passingham RE, Haggard P (2005): Action observation and acquired motor skills: An FMRI study with expert dancers. Cereb cortex 15:1243–1249. [DOI] [PubMed] [Google Scholar]
- Calvo‐Merino B, Grezes J, Glaser DE, Passingham RE, Haggard P (2006): Seeing or doing? Influence of visual and motor familiarity in action observation. Curr Biol 16:1905–1910. [DOI] [PubMed] [Google Scholar]
- Caminiti R, Ferraina S, Johnson PB (1996): The sources of visual information to the primate frontal lobe: A novel role for the superior parietal lobule. Cereb Cortex 6:319–328. [DOI] [PubMed] [Google Scholar]
- Caspers S, Zilles K, Laird AR, Eickhoff SB (2010): ALE meta‐analysis of action observation and imitation in the human brain. NeuroImage 50:1148–1167. [DOI] [PMC free article] [PubMed] [Google Scholar]
- Cauda F, Costa T, Torta DM, Sacco K, D'Agata F, Duca S, Geminiani G, Fox PT, Vercelli A (2012): Meta‐analytic clustering of the insular cortex: Characterizing the meta‐analytic connectivity of the insula when involved in active tasks. NeuroImage 62:343–355. [DOI] [PMC free article] [PubMed] [Google Scholar]
- Cieslik EC, Zilles K, Caspers S, Roski C, Kellermann TS, Jakobs O, Langner R, Laird AR, Fox PT, Eickhoff SB (2013): Is there “one” DLPFC in cognitive action control? Evidence for heterogeneity from co‐activation‐based parcellation. Cereb Cortex 23:2677–2689. [DOI] [PMC free article] [PubMed] [Google Scholar]
- Clos M, Amunts K, Laird AR, Fox PT, Eickhoff SB (2013): Tackling the multifunctional nature of Broca's region meta‐analytically: Co‐activation‐based parcellation of area 44. NeuroImage 83:174–188. [DOI] [PMC free article] [PubMed] [Google Scholar]
- Cohen AL, Fair DA, Dosenbach NU, Miezin FM, Dierker D, Van Essen DC, Schlaggar BL, Petersen SE (2008): Defining functional areas in individual human brains using resting functional connectivity MRI. NeuroImage 41:45–57. [DOI] [PMC free article] [PubMed] [Google Scholar]
- Corbetta M, Miezin FM, Shulman GL, Petersen SE (1993): A PET study of visuospatial attention. J Neurosci 13:1202–1226. [DOI] [PMC free article] [PubMed] [Google Scholar]
- Corbetta M, Shulman GL, Miezin FM, Petersen SE (1995): Superior parietal cortex activation during spatial attention shifts and visual feature conjunction. Science 270:802–805. [DOI] [PubMed] [Google Scholar]
- Culham JC, Valyear KF (2006): Human parietal cortex in action. Curr Opin Neurobiol 16:205–212. [DOI] [PubMed] [Google Scholar]
- Culham JC, Cavina‐Pratesi C, Singhal A (2006): The role of parietal cortex in visuomotor control: What have we learned from neuroimaging? Neuropsychologia 44:2668–2684. [DOI] [PubMed] [Google Scholar]
- Damoiseaux JS, Greicius MD (2009): Greater than the sum of its parts: A review of studies combining structural connectivity and resting‐state functional connectivity. Brain Struct Funct 213:525–533. [DOI] [PubMed] [Google Scholar]
- Deco G, Corbetta M (2011): The dynamical balance of the brain at rest. Neuroscientist 17:107–123. [DOI] [PMC free article] [PubMed] [Google Scholar]
- Deco G, Ponce‐Alvarez A, Mantini D, Romani GL, Hagmann P, Corbetta M (2013): Resting‐state functional connectivity emerges from structurally and dynamically shaped slow linear fluctuations. J Neurosci 33:11239–11252. [DOI] [PMC free article] [PubMed] [Google Scholar]
- Dice LR (1945): Measures of the amount of ecologic association between species. Ecology 26:297–302. [Google Scholar]
- Eickhoff SB, Grefkes C (2011): Approaches for the integrated analysis of structure, function and connectivity of the human brain. Clin EEG Neurosci 42:107–121. [DOI] [PMC free article] [PubMed] [Google Scholar]
- Eickhoff SB, Stephan KE, Mohlberg H, Grefkes C, Fink GR, Amunts K, Zilles K (2005): A new SPM toolbox for combining probabilistic cytoarchitectonic maps and functional imaging data. NeuroImage 25:1325–1335. [DOI] [PubMed] [Google Scholar]
- Eickhoff SB, Laird AR, Grefkes C, Wang LE, Zilles K, Fox PT (2009): Coordinate‐based activation likelihood estimation meta‐analysis of neuroimaging data: A random‐effects approach based on empirical estimates of spatial uncertainty. Hum Brain Mapp 30:2907–2926. [DOI] [PMC free article] [PubMed] [Google Scholar]
- Eickhoff SB, Jbabdi S, Caspers S, Laird AR, Fox PT, Zilles K, Behrens TE (2010): Anatomical and functional connectivity of cytoarchitectonic areas within the human parietal operculum. J Neurosci 30:6409–6421. [DOI] [PMC free article] [PubMed] [Google Scholar]
- Eickhoff SB, Bzdok D, Laird AR, Roski C, Caspers S, Zilles K, Fox PT (2011): Co‐activation patterns distinguish cortical modules, their connectivity and functional differentiation. NeuroImage 57:938–949. [DOI] [PMC free article] [PubMed] [Google Scholar]
- Eickhoff SB, Bzdok D, Laird AR, Kurth F, Fox PT (2012): Activation likelihood estimation meta‐analysis revisited. NeuroImage 59:2349–2361. [DOI] [PMC free article] [PubMed] [Google Scholar]
- Fan L, Wang J, Zhang Y, Han W, Yu C, Jiang T (2013): Connectivity‐Based Parcellation of the Human Temporal Pole Using Diffusion Tensor Imaging. Cerebral cortex (in press). [DOI] [PubMed]
- Gilbert CD, Li W (2013): Top‐down influences on visual processing. Nature reviews. Neuroscience 14:350–363. [DOI] [PMC free article] [PubMed] [Google Scholar]
- Goel V, Dolan RJ (2003): Explaining modulation of reasoning by belief. Cognition 87:B11–B22. [DOI] [PubMed] [Google Scholar]
- Greicius MD, Supekar K, Menon V, Dougherty RF (2009): Resting‐state functional connectivity reflects structural connectivity in the default mode network. Cereb Cortex 19:72–78. [DOI] [PMC free article] [PubMed] [Google Scholar]
- Hagmann P, Cammoun L, Gigandet X, Meuli R, Honey CJ, Wedeen VJ, Sporns O (2008): Mapping the structural core of human cerebral cortex. PLoS Biol 6:e159. [DOI] [PMC free article] [PubMed] [Google Scholar]
- Heiervang E, Behrens TE, Mackay CE, Robson MD, Johansen‐Berg H (2006): Between session reproducibility and between subject variability of diffusion MR and tractography measures. NeuroImage 33:867–877. [DOI] [PubMed] [Google Scholar]
- Honey CJ, Sporns O, Cammoun L, Gigandet X, Thiran JP, Meuli R, Hagmann P (2009): Predicting human resting‐state functional connectivity from structural connectivity. Proc Natl Acad Sci USA 106:2035–2040. [DOI] [PMC free article] [PubMed] [Google Scholar]
- Iacoboni M (2006): Visuo‐motor integration and control in the human posterior parietal cortex: Evidence from TMS and fMRI. Neuropsychologia 44:2691–2699. [DOI] [PubMed] [Google Scholar]
- Jakobs O, Langner R, Caspers S, Roski C, Cieslik EC, Zilles K, Laird AR, Fox PT, Eickhoff SB (2012): Across‐study and within‐subject functional connectivity of a right temporo‐parietal junction subregion involved in stimulus‐context integration. NeuroImage 60:2389–2398. [DOI] [PMC free article] [PubMed] [Google Scholar]
- Johansen‐Berg H, Behrens TE, Robson MD, Drobnjak I, Rushworth MF, Brady JM, Smith SM, Higham DJ, Matthews PM (2004): Changes in connectivity profiles define functionally distinct regions in human medial frontal cortex. Proc Natl Acad Sci USA 101:13335–13340. [DOI] [PMC free article] [PubMed] [Google Scholar]
- Johansen‐Berg H, Della‐Maggiore V, Behrens TE, Smith SM, Paus T (2007): Integrity of white matter in the corpus callosum correlates with bimanual co‐ordination skills. NeuroImage 36(Suppl 2):T16–T21. [DOI] [PMC free article] [PubMed] [Google Scholar]
- Jones EG, Coulter JD, Hendry SH (1978): Intracortical connectivity of architectonic fields in the somatic sensory, motor and parietal cortex of monkeys. J Comp Neurol 181:291–347. [DOI] [PubMed] [Google Scholar]
- Kelly C, Toro R, Di Martino A, Cox CL, Bellec P, Castellanos FX, Milham MP (2012): A convergent functional architecture of the insula emerges across imaging modalities. NeuroImage 61:1129–1142. [DOI] [PMC free article] [PubMed] [Google Scholar]
- Kim JH, Lee JM, Jo HJ, Kim SH, Lee JH, Kim ST, Seo SW, Cox RW, Na DL, Kim SI, Saad ZS (2010): Defining functional SMA and pre‐SMA subregions in human MFC using resting state fMRI: Functional connectivity‐based parcellation method. NeuroImage 49:2375–2386. [DOI] [PMC free article] [PubMed] [Google Scholar]
- Koch G, Cercignani M, Bonni S, Giacobbe V, Bucchi G, Versace V, Caltagirone C, Bozzali M (2011): Asymmetry of parietal interhemispheric connections in humans. J Neurosci 31:8967–8975. [DOI] [PMC free article] [PubMed] [Google Scholar]
- Lacquaniti F, Guigon E, Bianchi L, Ferraina S, Caminiti R (1995): Representing spatial information for limb movement: Role of area 5 in the monkey. Cereb Cortex 5:391–409. [DOI] [PubMed] [Google Scholar]
- Lacquaniti F, Perani D, Guigon E, Bettinardi V, Carrozzo M, Grassi F, Rossetti Y, Fazio F (1997): Visuomotor transformations for reaching to memorized targets: A PET study. NeuroImage 5:129–146. [DOI] [PubMed] [Google Scholar]
- Laird AR, Eickhoff SB, Kurth F, Fox PM, Uecker AM, Turner JA, Robinson JL, Lancaster JL, Fox PT (2009): ALE Meta‐Analysis Workflows Via the Brainmap Database: Progress Towards A Probabilistic Functional Brain Atlas. Front Neuroinform 3:23. [DOI] [PMC free article] [PubMed] [Google Scholar]
- Laird AR, Eickhoff SB, Fox PM, Uecker AM, Ray KL, Saenz JJ Jr., McKay DR, Bzdok D, Laird RW, Robinson JL, Turner JA, Turkeltaub PE, Lancaster JL, Fox PT (2011): The BrainMap strategy for standardization, sharing, and meta‐analysis of neuroimaging data. BMC Res Notes 4:349. [DOI] [PMC free article] [PubMed] [Google Scholar]
- Laird AR, Eickhoff SB, Rottschy C, Bzdok D, Ray KL, Fox PT (2013): Networks of task co‐activations. NeuroImage 80:505–14. [DOI] [PMC free article] [PubMed] [Google Scholar]
- Lewis CM, Baldassarre A, Committeri G, Romani GL, Corbetta M (2009): Learning sculpts the spontaneous activity of the resting human brain. Proc Natl Acad Sci USA 106:17558–17563. [DOI] [PMC free article] [PubMed] [Google Scholar]
- Li W, Qin W, Liu H, Fan L, Wang J, Jiang T, Yu C (2013): Subregions of the human superior frontal gyrus and their connections. NeuroImage 78:46–58. [DOI] [PubMed] [Google Scholar]
- Liu H, Qin W, Li W, Fan L, Wang J, Jiang T, Yu C (2013): Connectivity‐based parcellation of the human frontal pole with diffusion tensor imaging. J Neurosci 33:6782–6790. [DOI] [PMC free article] [PubMed] [Google Scholar]
- Makris N, Pandya DN (2009): The extreme capsule in humans and rethinking of the language circuitry. Brain Struct Funct 213:343–358. [DOI] [PMC free article] [PubMed] [Google Scholar]
- Makris N, Kennedy DN, McInerney S, Sorensen AG, Wang R, Caviness VS Jr., Pandya DN (2005): Segmentation of subcomponents within the superior longitudinal fascicle in humans: A quantitative, in vivo, DT‐MRI study. Cereb Cortex 15:854–869. [DOI] [PubMed] [Google Scholar]
- Makuuchi M, Bahlmann J, Anwander A, Friederici AD (2009): Segregating the core computational faculty of human language from working memory. Proc Natl Acad Sci USA 106:8362–8367. [DOI] [PMC free article] [PubMed] [Google Scholar]
- Marconi B, Genovesio A, Battaglia‐Mayer A, Ferraina S, Squatrito S, Molinari M, Lacquaniti F, Caminiti R (2001): Eye‐hand coordination during reaching. I. Anatomical relationships between parietal and frontal cortex. Cereb Cortex 11:513–527. [DOI] [PubMed] [Google Scholar]
- Mars RB, Jbabdi S, Sallet J, O'Reilly JX, Croxson PL, Olivier E, Noonan MP, Bergmann C, Mitchell AS, Baxter MG, Behrens TE, Johansen‐Berg H, Tomassini V, Miller KL, Rushworth MF (2011): Diffusion‐weighted imaging tractography‐based parcellation of the human parietal cortex and comparison with human and macaque resting‐state functional connectivity. J Neurosci 31:4087–4100. [DOI] [PMC free article] [PubMed] [Google Scholar]
- Mountcastle VB, Lynch JC, Georgopoulos A, Sakata H, Acuna C (1975): Posterior parietal association cortex of the monkey: Command functions for operations within extrapersonal space. J Neurophysiol 38:871–908. [DOI] [PubMed] [Google Scholar]
- Nebel MB, Joel SE, Muschelli J, Barber AD, Caffo BS, Pekar JJ, Mostofsky SH (2012): Disruption of functional organization within the primary motor cortex in children with autism. Hum Brain Mapp 35:567–580. [DOI] [PMC free article] [PubMed] [Google Scholar]
- Nee DE, Brown JW, Askren MK, Berman MG, Demiralp E, Krawitz A, Jonides J (2013): A meta‐analysis of executive components of working memory. Cereb Cortex 23:264–282. [DOI] [PMC free article] [PubMed] [Google Scholar]
- Nelson SM, Cohen AL, Power JD, Wig GS, Miezin FM, Wheeler ME, Velanova K, Donaldson DI, Phillips JS, Schlaggar BL, Petersen SE (2010): A parcellation scheme for human left lateral parietal cortex. Neuron 67:156–170. [DOI] [PMC free article] [PubMed] [Google Scholar]
- Pandya DN, Seltzer B (1982): Intrinsic connections and architectonics of posterior parietal cortex in the rhesus monkey. J Comp Neurol 204:196–210. [DOI] [PubMed] [Google Scholar]
- Passingham RE, Stephan KE, Kotter R (2002): The anatomical basis of functional localization in the cortex. Nature reviews. Neuroscience 3:606–616. [DOI] [PubMed] [Google Scholar]
- Robinson JL, Laird AR, Glahn DC, Lovallo WR, Fox PT (2010): Metaanalytic connectivity modeling: Delineating the functional connectivity of the human amygdala. Hum Brain Mapp 31:173–184. [DOI] [PMC free article] [PubMed] [Google Scholar]
- Rottschy C, Caspers S, Roski C, Reetz K, Dogan I, Schulz JB, Zilles K, Laird AR, Fox PT, Eickhoff SB (2013): Differentiated parietal connectivity of frontal regions for “what” and “where” memory. Brain Struct Funct 218:1551–1567. [DOI] [PMC free article] [PubMed] [Google Scholar]
- Rushworth MF, Paus T, Sipila PK (2001): Attention systems and the organization of the human parietal cortex. J Neurosci 21:5262–5271. [DOI] [PMC free article] [PubMed] [Google Scholar]
- Scheperjans F, Grefkes C, Palomero‐Gallagher N, Schleicher A, Zilles K (2005a): Subdivisions of human parietal area 5 revealed by quantitative receptor autoradiography: A parietal region between motor, somatosensory, and cingulate cortical areas. NeuroImage 25:975–992. [DOI] [PubMed] [Google Scholar]
- Scheperjans F, Palomero‐Gallagher N, Grefkes C, Schleicher A, Zilles K (2005b): Transmitter receptors reveal segregation of cortical areas in the human superior parietal cortex: Relations to visual and somatosensory regions. NeuroImage 28:362–379. [DOI] [PubMed] [Google Scholar]
- Scheperjans F, Eickhoff SB, Homke L, Mohlberg H, Hermann K, Amunts K, Zilles K (2008a): Probabilistic maps, morphometry, and variability of cytoarchitectonic areas in the human superior parietal cortex. Cereb Cortex 18:2141–2157. [DOI] [PMC free article] [PubMed] [Google Scholar]
- Scheperjans F, Hermann K, Eickhoff SB, Amunts K, Schleicher A, Zilles K (2008b): Observer‐independent cytoarchitectonic mapping of the human superior parietal cortex. Cereb Cortex 18:846–867. [DOI] [PubMed] [Google Scholar]
- Shirer WR, Ryali S, Rykhlevskaia E, Menon V, Greicius MD (2012): Decoding subject‐driven cognitive states with whole‐brain connectivity patterns. Cereb Cortex 22:158–165. [DOI] [PMC free article] [PubMed] [Google Scholar]
- Smith SM, Fox PT, Miller KL, Glahn DC, Fox PM, Mackay CE, Filippini N, Watkins KE, Toro R, Laird AR, Beckmann CF (2009): Correspondence of the brain's functional architecture during activation and rest. Proc Natl Acad Sci USA 106:13040–13045. [DOI] [PMC free article] [PubMed] [Google Scholar]
- Stoodley CJ, Valera EM, Schmahmann JD (2012): Functional topography of the cerebellum for motor and cognitive tasks: An fMRI study. NeuroImage 59:1560–1570. [DOI] [PMC free article] [PubMed] [Google Scholar]
- Toro R, Fox PT, Paus T (2008): Functional coactivation map of the human brain. Cereb Cortex 18:2553–2559. [DOI] [PMC free article] [PubMed] [Google Scholar]
- Turkeltaub PE, Eickhoff SB, Laird AR, Fox M, Wiener M, Fox P (2012): Minimizing within‐experiment and within‐group effects in Activation Likelihood Estimation meta‐analyses. Hum Brain Mapp 33:1–13. [DOI] [PMC free article] [PubMed] [Google Scholar]
- Tzourio‐Mazoyer N, Landeau B, Papathanassiou D, Crivello F, Etard O, Delcroix N, Mazoyer B, Joliot M (2002): Automated anatomical labeling of activations in SPM using a macroscopic anatomical parcellation of the MNI MRI single‐subject brain. NeuroImage 15:273–289. [DOI] [PubMed] [Google Scholar]
- van den Heuvel MP, Hulshoff Pol HE (2010): Exploring the brain network: A review on resting‐state fMRI functional connectivity. Eur Neuropsychopharmacol 20:519–534. [DOI] [PubMed] [Google Scholar]
- Vandenberghe R, Gitelman DR, Parrish TB, Mesulam MM (2001): Functional specificity of superior parietal mediation of spatial shifting. NeuroImage 14:661–673. [DOI] [PubMed] [Google Scholar]
- Vingerhoets G, de Lange FP, Vandemaele P, Deblaere K, Achten E (2002): Motor imagery in mental rotation: An fMRI study. NeuroImage 17:1623–1633. [DOI] [PubMed] [Google Scholar]
- Wager TD, Jonides J, Reading S (2004): Neuroimaging studies of shifting attention: A meta‐analysis. NeuroImage 22:1679–1693. [DOI] [PubMed] [Google Scholar]
- Wang J, Fan L, Zhang Y, Liu Y, Jiang D, Zhang Y, Yu C, Jiang T (2012): Tractography‐based parcellation of the human left inferior parietal lobule. NeuroImage 63:641–652. [DOI] [PubMed] [Google Scholar]
- Weiss PH, Marshall JC, Zilles K, Fink GR (2003): Are action and perception in near and far space additive or interactive factors? NeuroImage 18:837–846. [DOI] [PubMed] [Google Scholar]
- Wenderoth N, Debaere F, Sunaert S, van Hecke P, Swinnen SP (2004): Parieto‐premotor areas mediate directional interference during bimanual movements. Cereb Cortex 14:1153–1163. [DOI] [PubMed] [Google Scholar]
- Wolbers T, Weiller C, Buchel C (2003): Contralateral coding of imagined body parts in the superior parietal lobe. Cereb Cortex 13:392–399. [DOI] [PubMed] [Google Scholar]
- Zago L, Tzourio‐Mazoyer N (2002): Distinguishing visuospatial working memory and complex mental calculation areas within the parietal lobes. Neurosci Lett 331:45–49. [DOI] [PubMed] [Google Scholar]
- Zhang D, Snyder AZ, Shimony JS, Fox MD, Raichle ME (2010): Noninvasive functional and structural connectivity mapping of the human thalamocortical system. Cereb Cortex 20:1187–1194. [DOI] [PMC free article] [PubMed] [Google Scholar]
- Zhang Y, Fan L, Zhang Y, Wang J, Zhu M, Zhang Y, Yu C, Jiang T (2014): Connectivity‐based parcellation of the human posteromedial cortex. Cereb Cortex 24:719–727. [DOI] [PubMed] [Google Scholar]