Abstract
Background
Advances in small animal imaging have improved the detection and monitoring of cancer in vivo, although with orthotopic models precise localization of tumors remains a challenge. In this study, we evaluated multispectral optoacoustic tomography (MSOT) as an imaging modality to detect pancreatic adenocarcinoma in an orthotopic murine model.
Methods
In vitro binding of syndecan-1 probe to the human pancreatic cancer cell line S2VP10 was evaluated on flow cytometry. For in vivo testing, S2VP10 cells were orthotopically implanted into the pancreas of SCID mice. At 7 days post-implantation, the mice were intravenously injected with syndecan-1 probe and tumor uptake was evaluated with multispectral optoacoustic tomography (MSOT) at multiple time points. Comparison was made to a free-dye control, indocyanine green (ICG). Probe uptake was verified ex vivo with fluorescent imaging.
Results
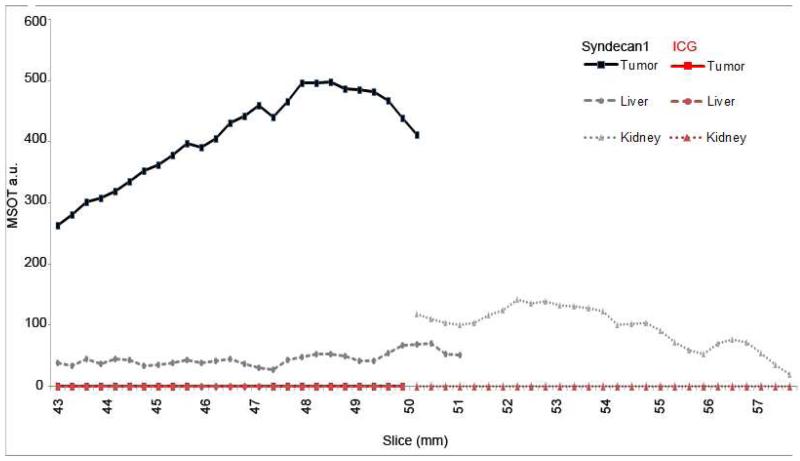
Syndecan-1 probe demonstrated partial binding to S2VP10 cells in vitro. In vivo, syndecan-1 probe preferentially accumulated in the pancreas tumor (480 MSOT a.u.) compared to off-target organs, including the liver (67 MSOT a.u.) and kidney (96 MSOT a.u.). Syndecan-1 probe accumulation peaked at 6 hours (480 MSOT a.u.), while the ICG control dye failed to demonstrate similar retention within the tumor bed (0.0003 MSOT a.u.). At peak accumulation, signal intensity was 480 MSOT a.u., resulting in several times greater signal in the tumor bed than in the kidney or liver. Ex vivo fluorescent imaging comparing tumor signal to that within off-target organs confirmed the in vivo results.
Conclusion
MSOT demonstrates successful accumulation of syndecan-1 probe within pancreatic tumors, and provides high resolution images which allow non-invasive, real time comparison of signal within individual organs. Syndecan-1 probe preferentially accumulates within a pancreatic adenocarcinoma model, with minimal off-target effects.
Keywords: pancreatic adenocarcinoma, targeted therapy, syndecan-1, multispectral optoacoustic tomography
INTRODUCTION
Improving the diagnosis, treatment, and monitoring of cancer remains a primary focus of research today, and significant breakthroughs have been made with new developments in targeted therapy and pre-clinical molecular imaging. Advances in imaging have contributed by providing real-time information with a high degree of spatial resolution and anatomic detail in vivo.(1, 2) The addition of targeted fluorescent probes allows visualization of individual tissues or cellular processes, including tumors.(3) By conjugating fluorescent proteins to tumor specific ligands, fluorescent probes can specifically bind and identify tumor tissue.(4)
However, depending upon the imaging modality, precise characterization of a tumor’s location and features can be difficult using fluorescent probes in vivo. In particular, two-dimensional planar imaging is limited by light scattering and signal attenuation, which results in a lack of specificity between fluorescent signal and the internal anatomy.(5) Multispectral optoacoustic tomography (MSOT) is an emerging technology that offers high resolution in vivo imaging of tumors that addresses the limitations inherent in the traditional planar imaging.(6) MSOT takes advantage of the photoacoustic effect, a process whereby particles excited by pulsed light emit an acoustic signal detectable by ultrasound. Using a 5MHz tomographic ultrasound array, the MSOT system detects a wide spectrum of sound waves that are emitted after tissue becomes excited by wavelengths of pulsed near-infrared light. Individual tissues will absorb light and emit sound waves best at different wavelengths, and integrating the acoustic signals that result from multiple excitation wavelengths yields a high-resolution ultrasound image. Cross-sectional images with resolution up to 100-150 μm can be obtained, and the distribution of fluorescent molecules can be isolated from background signal.(7) In this way fluorescent probes serve as contrast agents, and tumor-targeted probes can give precise images that relate the tumor to the surrounding internal anatomy.(8) Prior studies have used MSOT and fluorescent markers to evaluate subcutaneous tumors, glioblastoma, and renal perfusion in small animals.(8-10)
While MSOT has been used pre-clinically for several tumor models, there is little experience with its use to identify abdominal tumors at depth, such as orthotopic pancreatic cancer xenografts. For this study, we used both MSOT and traditional planar imaging to evaluate the in vivo binding of a fluorescent probe targeted to a murine orthotopic pancreatic tumor. Our primary goal was to compare imaging modalities and evaluate probe accumulation, including distribution within off-target organs, with the underlying hypothesis that MSOT would provide superior tumor imaging. As a secondary goal, we evaluated recombinant syndecan-1 as the ligand of a targeted probe for pancreatic tumors. Syndecan-1 is up-regulated in pancreatic adenocarcinoma, and recombinant syndecan-1 has been shown to bind overexpressed αvβ3 integrin on tumor cells.(11, 12) To demonstrate tumor targeting, we compared syndecan-1 to a non-targeted indocyanine green (ICG) reference dye. Syndecan-1 probe binding within the pancreas tumor compared to off-target organs was further confirmed using ex vivo imaging.
METHODS
1) Cell Culture
The human pancreatic cancer cell line S2VP10 was a gift from M. Hollingsworth (University of Nebraska). The human glioma cell line U251-MG was originally obtained from Dr. D.D. Bigner (Duke University, Durham, NC) to serve as the positive control for Syndecan-1 binding.(13) Cells were grown at 37° C and 5% CO2 in Dulbecco’s modified Eagle medium (Life Technologies, Grand Island, NY) supplemented with 10% fetal bovine serum (Atlanta Biologicals, Lawrenceville, GA) and 1% L-glutamine (Life Technologies). S2VP10L cells containing fire-fly luciferase were used for in vivo experiments as previously described.(14)
2) Labelling Syndecan-1 with NIR dye
Syndecan-1 ligand (Prospec Protein Specialists, Rehovat, Israel) and water-soluble CF750 succinyl ester dye (Biotium, Hayward, CA) were conjugated together to form the syndecan-1 probe. Syndecan-1 (1 μg/μL) was added to CF750 dye, and diluted to a final concentration of 1 μM using nuclease-free water. Sodium bicarbonate was added as buffer. Samples then underwent 30 minutes of sonication to ensure thorough mixing. Labeled syndecan-1 was then purified from unlabeled dye using dialysis cassettes (Pierce, Rockford, IL). A 10,000 MW pore size was used to separate unbound dye from probe. The absorption spectrum for the syndecan-1 750 probe was then obtained using a Cary Spectrophotometer (Agilent, Santa Clara, CA).
3) In vitro analysis of Syndecan-1 binding
The human pancreatic cell line S2VP10 and glioma cell line U251 were plated in 6-well plates at 3.0 × 10⁵ per well. Cells were harvested and centrifuged into pellets in 2ml tubes. Pellets were then re-suspended with 30 μL PBS or 30μL syndecan-1 probe. Samples were then incubated for 30 minutes at 4°C. Cellular uptake of syndecan-1 probe was measured via flow cytometry with a cut-off of 50,000 events using the BD FACSCanto flow cytometer (BD Biosciences, San Jose, CA). Subsequent data analysis was performed using FlowJo software (TreeStar Inc, Ashland, OR).
4) Human pancreatic cancer xenograft mouse models
Female severe combined immunodeficient mice 4 weeks of age were used for this study in strict adherence to a University of Louisville Institutional Animal Care and Use Committee (IACUC) approved protocol. Mice were placed on 2920X alfalfa free-rodent diet (Harlan Laboratories, Indianapolis, IN) to reduce background signal during imaging. An established model for orthotopic cell implantation into the mouse pancreas was followed as previously described.(14, 15) Briefly, 10 mice were anesthetized with isoflurane and hair was removed from the abdomen using Nair with Aloe followed by washing with warm water. The abdomen was then prepped with betadine. A 1-cm incision was made in the left upper quadrant, with the pancreas exposed by retraction of the spleen. Luciferase-cloned S2VP10 cells (S2VP10L) were suspended in serum-free RPMI medium at 4°C in a sterile tube. A solution of 1.5 × 10⁵ cells/30μL was drawn up using a 28-gauge needle and injected into the tail of the pancreas. A sterile cotton tipped applicator was held over the injection site for 30s to prevent peritoneal leakage. The organs were returned to the abdomen with the skin and peritoneum closed in a single layer using 5-0 nylon sutures. Mice recovered underneath a warming blanket and were returned to their cages with food and water ad libitum after regaining full mobility.
5) Tumor monitoring with bioluminescence imaging
Bioluminescence imaging was used immediately following surgery to assess potential leakage of cells from orthotopic implantation with the AMI-1000-X instrument (Spectral Imaging Instruments, Tucson, AZ). Mice received i.p. injection of 2.5 mg luciferin 10 min prior to imaging. Mice with signs of peritoneal leakage were excluded from further study. Sutures were removed after 5 days to prevent artifacts for subsequent imaging studies. Tumor size was assessed again at 7 days post-op and prior to injection of syndecan-1 probe. Ultimately, 5 mice were selected for in vivo imaging with the MSOT based on mean bioluminescent signal from pancreatic tumors.
6) Evaluation of probe binding with fluorescent imaging
Using a tail vein injection technique, 200 μL of syndecan-1 probe was administered intravenously at a concentration of 100 nM. Mice were also injected with 200 μL Cardiogreen (ICG) at a concentration of 260 μM as an ICG control (Sigma Aldrich, St. Louis, MO).(16) Systemic injection was confirmed with near-infrared fluorescent imaging by AMI. Fluorescent imaging was then repeated prior to MSOT imaging up to the 6 h time point.
7) Evaluation of probe binding with Multispectral Optoacoustic Tomography
After IV injection of probe, mice were imaged at 3, 6, and 24 h using inVision 256TF MSOT (iThera Medical, Munich, Germany). Hair was removed on both the dorsal and ventral sides of the mice using a combination of shaving and Nair with Aloe. Excess Nair was removed with warm distilled water and gauze. Mice were imaged ventral side up within the animal holder and positioned in a nose cone for anesthesia delivery. Anesthesia was maintained at 1.5% isoflurane in 0.8L medical air and 0.1L O2 throughout imaging. Imaging was performed using axial slices with a 0.3-mm step through the liver-tumor-kidney region, at wavelengths of 680, 710, 730, 740, 750, 760,770, 780, 800, 850, 900 nm for each position. For each wavelength, 25 frames were obtained and averaged. In order to minimize the influence of animal movement in the images, an acquisition time of 10 μsec per frame was used.(7) Respiration rate and signs of distress were monitored through all stages of the imaging procedure. After the last imaging time point of 24h, animals were euthanized via carbon dioxide overdose and cervical dislocation. Pancreas tumor, liver, and spleen were removed and imaged using the AMI-1000X as described below to confirm probe accumulation.
8) Image reconstruction and analysis
Raw data obtained with MSOT was reconstructed with multispectral analysis performed as previously described.(7, 8) Separate spectral analysis was performed at wavelengths corresponding to both ICG and the CF-750 dye. Reconstruction was conducted using backprojection at a resolution of 75μm using ViewMSOT software version 3.2 (Ithera Medical). The Multispectral Processing was conducted using Linear Regression with MATLAB software (Mathworks, Natick, MA). A region of interest (ROI) method was applied to determine signal strength in tumor, liver, and kidney using ViewMSOT software and reported as MSOT a.u.. The ROI area included for anaysis was plotted over each organ according to its location as observed on MSOT and was kept constant for all image slices. The ROI analysis of syndecan-1 probe was compared among organs using ANOVA and with ICG using Wilcoxon, respectively. Statistical test were conducted using SAS 9.3 (Cary, NC). Syndecan-1 probe signal was homogenized using 3-dimensional Gaussian filter (size 9×9×3) in MATLAB. Maximum intensity projections were obtained using MATLAB after reconstruction. Image stacks were imported into ImageJ for further evaluation of the 3D characteristics of probe binding within the tumor using orthogonal views.
9) Ex-vivo organ analysis
After the 6h imaging time point, several control and probe mice were euthanized and evaluation of signal accumulation within the tumor was compared to off-target organs using fluorescent imaging by AMI. ROI analysis of syndecan-1-750 probe and ICG accumulation was used to verify MSOT data in the liver, spleen, and pancreas tumor.
RESULTS
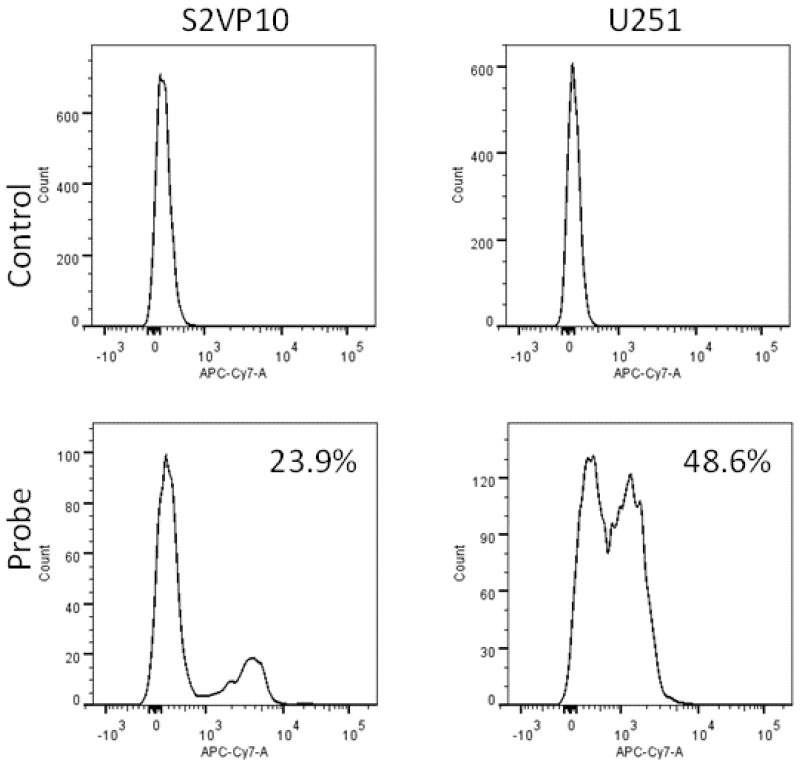
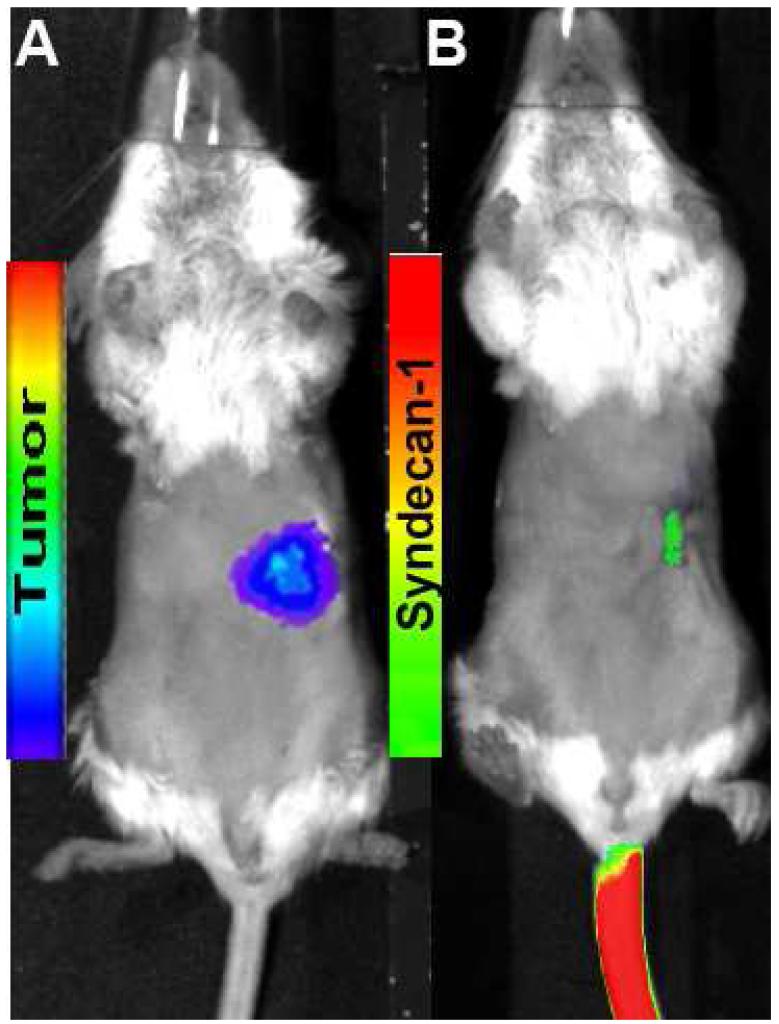
Successful in vitro probe binding was assessed via flow cytometry. Probe demonstrated partial binding over control cells, and the 100nM probe concentration yielded 23.9% binding in vitro. Partial in vitro binding (48.6%) was also observed with the positive control U251 cells, which are known to express high levels of αvβ3 (Figure 1).(13) In vivo binding was then assessed with traditional fluorescent imaging. Focal accumulation of syndecan-1 probe was evident early after injection, but was largely undetectable by 6h (Figure 2).
Figure 1.
Flow cytometry demonstrates partial binding of syndecan-1 labelled with CF-750 NIR dye to S2VP10 cells and positive control (U251). A 100nM probe concentration yielded 23.9% binding in S2VP10 cells.
Figure 2.
Orthotopic pancreatic tumor was identified using bioluminescence (A) and Syndecan-1 probe (B). At 6h, post injection, syndecan-1 probe is largely undetectable using fluorescence imaging.
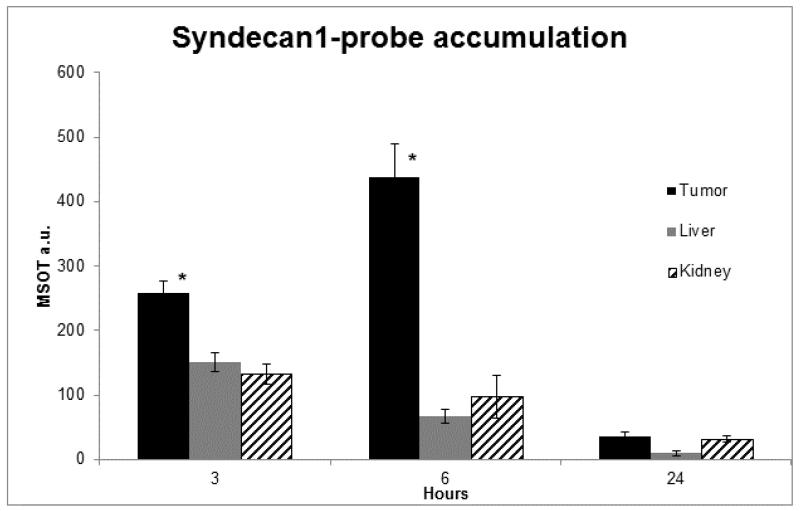
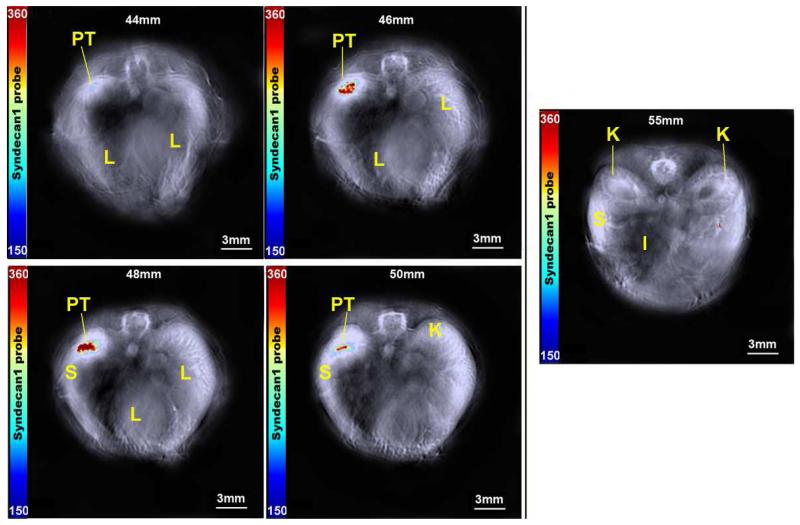
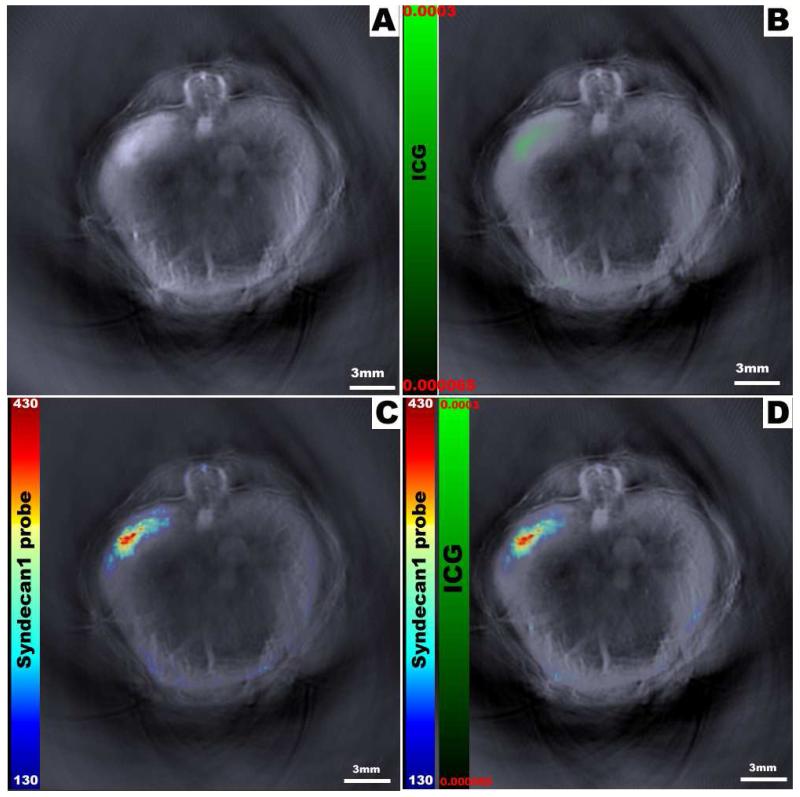
Using MSOT, in vivo accumulation of probe was then assessed at 3, 6, and 24h intervals. Peak intensity of probe signal was seen at 6h, with probe elimination evident by 24h. Furthermore, while probe signal increased in the tumor through six hours, levels decreased within off-target organs (Figure 3). In order to precisely localize probe signal and assess its relationship with adjacent structures, cross sectional images were obtained with 0.3 mm slices that included the tumor bed, liver and kidneys (Figure 4). Progressing through these slices, increasing signal intensity occurs as the tumor enlarges, with limited signal seen in the liver and kidney. Region of interest analysis was performed across all stacked slices, generating comparisons of signal intensity in each organ through the length of the mouse (Figure 5). With peak accumulation at 6 hours, maximum signal intensity in the tumor was 6.4 times that seen in the kidney (430.3 au vs 67.6 au, p=0.00152), and 4.4 times that seen in the liver (430.3 au vs 97.0 au, p=0.0019). Within the tumor, syndecan-1 probe demonstrated a signal intensity 2.1 ×10⁵ greater than ICG at 6 hours (430.3 au vs 2.3×10⁻², p=0.000016).
Figure 3.
Syndecan-1 probe accumulation was measured at 3, 6, and 24 hours using MSOT. Signal intensity significantly increases in the tumor bed 3 - 6 hours (p<0.05*), while it decreases within off-target organs. Bars represent the mean pixel accumulation within the designated organ as measured using a region of interest method. The syndecan-1 probe was eliminated by 24 hours.
Figure 4.
Serial axial slices demonstrating probe accumulation within the tumor at 2 mm intervals. Tumor (PT) can be seen from 44-50mm. Reference organ locations of spleen (S), liver (L), kidney (K), and intestine (I) are indicated. Minimal signal was seen outside of the tumor bed, and no signal was evident within the kidneys at 55mm. The right lobe of the liver is prominent on images 46-50mm, with no accumulation of probe. The color bar represents syndecan-1 probe from 150-360 MSOT a.u.
Figure 5.
Multispectral processing allows simultaneous comparison of distinct probes within the mouse. Here we seen the reconstructed optoacoustic image without exogenous contrast (A); image with free control dye (ICG) only (B); image with syndecan-1 probe only (C); and both syndecan-1 probe and ICG overlaid onto the original image (D). While the green color bar represents ICG dye from 0.000065-0.0003 MSOT a.u., the rainbow color bar represents syndecan-1 probe from 130-430 MSOT a.u.
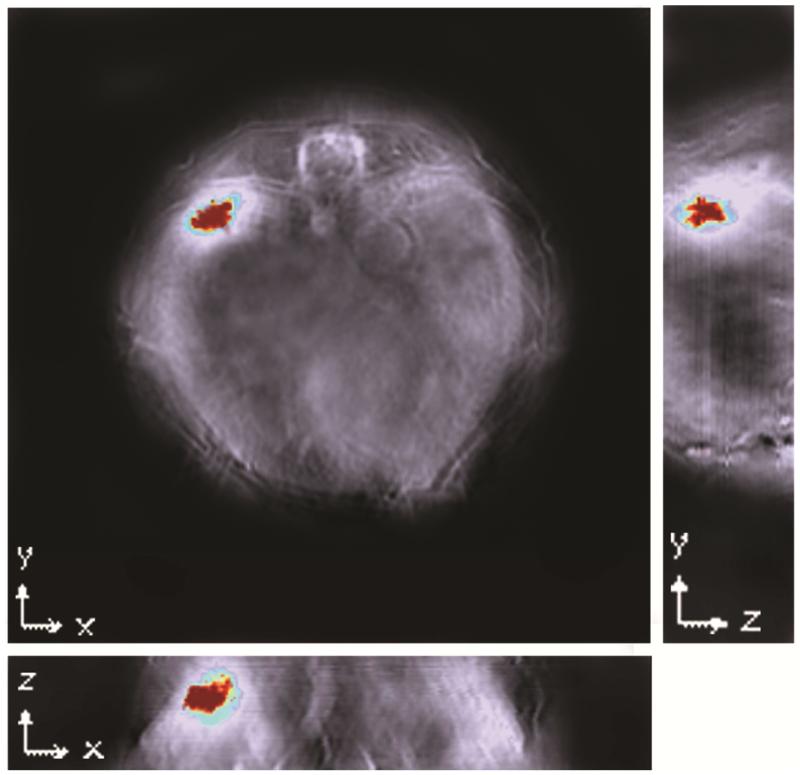
In addition to comparisons of signal strength, the spatial relationship of probe accumulation in regards to internal organs was also evident. Stacked images consisting of all slices were analyzed to create orthogonal views of the tumor (Figure 6). These yield a three-dimensional view that demonstrates syndecan-1 probe distribution throughout the tumor bed, with signal strength increasing towards the center of the tumor. Furthermore, multispectral imaging allowed the simultaneous comparison of two distinct probes within an individual mouse. In this manner, distribution patterns of both syndecan-1 probe and ICG could be represented (Figure 7). While ICG appears more diffuse, probe was localized largely within the tumor bed.
Figure 6.
Region of interest analysis for maximum signal intensity of each slice at 6 hours. Maximum syndecan-1 probe signals occurred within slices 48-49 mm and reach 480 MSOT a.u (Black lines). ICG signal was minimal and reached 0.0003 MSOT a.u. (Red lines).
Figure 7.
Orthogonal views of the tumor demonstrate signal distribution throughout the tumor along all three coordinates, indicating good distribution of probe into the tumor bed. Reconstruction was conducted using backprojection at a resolution of 75μm. Signal was homogenised using 3-dimensional Gaussian filter (size 9×9×3) in MATLAB. The Multispectral Processing was conducted using Linear Regression [MATLAB]. Orthogonal view was created using Image J software.
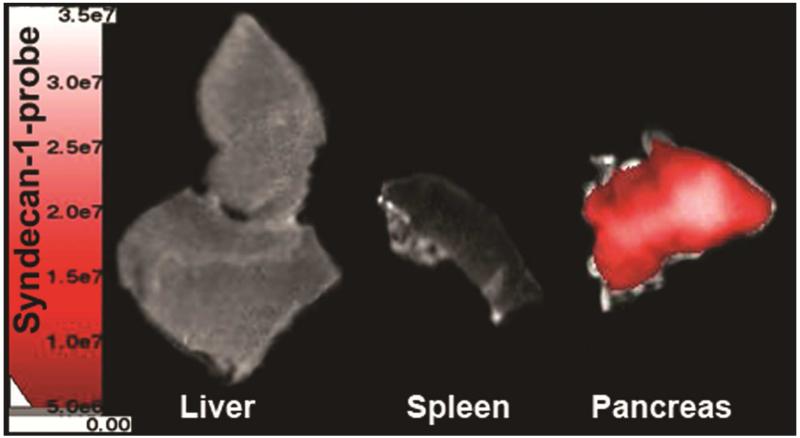
After imaging, several mice were sacrificed at 6h post-injection and ex-vivo near-infrared fluorescent imaging was performed to verify probe and/or ICG signal within organs. The spleen’s close proximity to the tumor made it difficult to analyze in vivo; therefore, it was included for ex vivo analysis. The ex vivo images confirmed preferential accumulation of syndecan-1 probe within the pancreatic tumor (Figure 8). Comparing signal intensity by ROI analysis demonstrated a signal of 1.55 ×10⁸ photons/s in the tumor, compared to 3.47 ×10⁷ photons/s in the liver and 9.12 ×10⁶ photons/s in the spleen.
Figure 8.
Ex-vivo imaging demonstrates increased probe accumulation within the pancreas compared to the liver and spleen at 6 hours. NIR-fluorescence evaluation of liver, spleen, and tumor using the AMI system indicated syndecan-1 probe within the pancreas tumor.
DISCUSSION
This study is one of the first to demonstrate the feasibility of using MSOT for the detection and monitoring of orthotopic pancreatic tumors in vivo. MSOT offers sufficient resolution at greater depth to overcome traditional imaging limitations, and distinguishes accumulation within the tumor bed from off-target organs.(17) As our orthogonal images suggest, accumulation throughout the tumor parenchyma (Figure 6) could be seen despite the intra-abdominal location of the tumor, allowing for precise determination of signal origin and intensity. Compared to planar imaging, MSOT was also more sensitive in tumor detection; while no focal accumulation was seen with fluorescent imaging at 6 hours, tumors were detectable using MSOT at this time point. Furthermore, relationships to off-target organs were well characterized.
The utility of in vivo fluorescent imaging has been limited by both imaging technology, inherent photon scattering within tissue, and murine tumor models. In fluorescent imaging, tissues and their constituent molecules absorb and emit light at different wavelengths within the electromagnetic spectrum. By using particular excitation wavelengths, specific tissues or fluorescent probes can be stimulated to emit a detectable fluorescent signal.(3) However, emitted light is subject to several limitations. As light from deeper structures has further distance to travel through tissue, it becomes absorbed and scattered along the pathway. This is particularly true in imaging intra-cavity or deep tumors, where the resulting signal attenuation often decreases the overall accuracy and sensitivity of imaging.(5) This was evident in our study, where light emitted from fluorescent probes was largely undetectable at 6 hours. Furthermore, even when detected, light emitted from fluorophores within deep tissues can appear diffusely smeared on planar imaging (Figure 2).(5) In contrast, sound waves are less likely to be deflected or absorbed as they pass through tissue.(18) As such, acoustic signals detectable by MSOT provided more sensitive and localized tumor information.
Furthermore, MSOT characterized distribution of multiple probes simultaneously. Syndecan-1 labelled fluorescent probes appeared to accumulate within tumors, while similar patterns of distribution were not seen with the ICG reference dye. ICG can either leak through the permeable tumor vasculature and become retained within the tumor microenvironment, or will persist in tumors due to physiologic uptake by malignant cells.(19) As such, ICG has previously been used as reference dye or as an agent in comparison to targeted probes.(19-21) We did not see any pronounced extravasation and retention of ICG in this study, and most dye was readily cleared from circulation. In contrast, syndecan-1 probe continued to accumulate within the tumor through 6 hours (430.3 au vs 2.3×10⁻², p=0.000016), despite an initial injection at much lower concentrations than ICG. Ex vivo fluorescent imaging confirmed the in vivo finding that probe preferentially accumulated within the tumor (Figure 8).
Orthotopic models that directly implant tumor cells into the primary site are increasing in popularity. These models offer multiple advantages over subcutaneous models, including improved tumor-host interactions, a complex tumor microenvironment, and the development of relevant metastases.(22) However, given their deeper location, monitoring tumors in these models becomes complicated by the problems of signal scattering, attenuation, and lack of anatomic detail. While these problems are reduced when using subcutaneous xenografts, these models do not simulate the tumor microenvironment of a primary tumor and can be poorly predictive of tumor behavior and response to therapy.(22, 23) Furthermore, although subcutaneous tumors have historically been the most widely-used murine tumor model, fluorescent signal from these tumors can be misleading. Although imaging may show homogenous signal throughout tumors, subsequent histology or tomographic images demonstrate poor penetration of probe into tumors, with accumulation limited largely to the periphery.(20)
Given the increasing role that orthotopic pancreatic cancer models play in small animal research, effective means of monitoring tumor development, location, and response to therapy will be needed. For instance, while subcutaneous tumors can be readily palpated and precisely measured, orthotopic tumors may require necroscopy.(23) Not only does this increase the number of mice needed for a study, but it makes it difficult to perform repeated measures on an individual mouse. Using MSOT in conjuction with targeted NIR-fluorescent probes reliably detects pancreatic adenocarcinoma in vivo, and offers non-invasive comparisons between tumor signal and that of the surrounding internal anatomy. Additionally, repeating these measurements over time demonstrates potential as a technique to monitor probe distribution and kinetics.(17)
While our findings offer proof that MSOT can successfully detect pancreatic tumors in vivo using fluorescent probes, there are some limitations. While the syndecan-1 one probe used in this study preferentially accumulated in the tumor bed, this was only tested in vivo in a single S2VP10 cell line. Additional testing of this probe with other cell lines would be necessary to validate its potential as a targeted probe for pancreatic cancer in general. In terms of our primary goal, high resolution imaging with MSOT successfully detects and characterizes accumulation of a fluorescent probe in pancreatic tumors. Moving forward, this modality appears to be a valid option to monitor orthotopic tumors in future in vivo studies.
Syndecan-1 probe specifically targeted pancreatic cancer
MSOT imaging detects orthotopic pancreatic tumors in 3D
MSOT provides superior resolution at depth compared to fluorescence imaging
Acknowledgements
This work was supported by NIH grant CA139050.
Footnotes
Publisher's Disclaimer: This is a PDF file of an unedited manuscript that has been accepted for publication. As a service to our customers we are providing this early version of the manuscript. The manuscript will undergo copyediting, typesetting, and review of the resulting proof before it is published in its final citable form. Please note that during the production process errors may be discovered which could affect the content, and all legal disclaimers that apply to the journal pertain.
CWK contributed to the data collection and writing of the article; SH contributed to data collection; AK contributed to data collection; MEE contributed to the design and revision of the article; LRM contributed to the concept and revision of the article.
Literature Cited
- 1.Massoud TF, Gambhir SS. Molecular imaging in living subjects: seeing fundamental biological processes in a new light. Genes & development. 2003;17(5):545–80. doi: 10.1101/gad.1047403. [DOI] [PubMed] [Google Scholar]
- 2.Kaijzel EL, van der Pluijm G, Lowik CW. Whole-body optical imaging in animal models to assess cancer development and progression. Clinical cancer research: an official journal of the American Association for Cancer Research. 2007;13(12):3490–7. doi: 10.1158/1078-0432.CCR-07-0402. [DOI] [PubMed] [Google Scholar]
- 3.Ntziachristos V, Bremer C, Weissleder R. Fluorescence imaging with near-infrared light: new technological advances that enable in vivo molecular imaging. European radiology. 2003;13(1):195–208. doi: 10.1007/s00330-002-1524-x. [DOI] [PubMed] [Google Scholar]
- 4.Bai M, Bornhop DJ. Recent advances in receptor-targeted fluorescent probes for in vivo cancer imaging. Current medicinal chemistry. 2012;19(28):4742–58. doi: 10.2174/092986712803341467. [DOI] [PubMed] [Google Scholar]
- 5.Leblond F, Davis SC, Valdes PA, Pogue BW. Pre-clinical whole-body fluorescence imaging: Review of instruments, methods and applications. Journal of photochemistry and photobiology B, Biology. 2010;98(1):77–94. doi: 10.1016/j.jphotobiol.2009.11.007. [DOI] [PMC free article] [PubMed] [Google Scholar]
- 6.Ntziachristos V. Going deeper than microscopy: the optical imaging frontier in biology. Nature methods. 2010;7(8):603–14. doi: 10.1038/nmeth.1483. [DOI] [PubMed] [Google Scholar]
- 7.Razansky D, Buehler A, Ntziachristos V. Volumetric real-time multispectral optoacoustic tomography of biomarkers. Nature protocols. 2011;6(8):1121–9. doi: 10.1038/nprot.2011.351. [DOI] [PubMed] [Google Scholar]
- 8.Buehler A, Herzog E, Ale A, Smith BD, Ntziachristos V, Razansky D. High resolution tumor targeting in living mice by means of multispectral optoacoustic tomography. EJNMMI research. 2012;2:14. doi: 10.1186/2191-219X-2-14. [DOI] [PMC free article] [PubMed] [Google Scholar]
- 9.Razansky D, Vinegoni C, Ntziachristos V. Multispectral photoacoustic imaging of fluorochromes in small animals. Optics letters. 2007;32(19):2891–3. doi: 10.1364/ol.32.002891. [DOI] [PubMed] [Google Scholar]
- 10.Buehler A, Herzog E, Razansky D, Ntziachristos V. Video rate optoacoustic tomography of mouse kidney perfusion. Optics letters. 2010;35(14):2475–7. doi: 10.1364/OL.35.002475. [DOI] [PubMed] [Google Scholar]
- 11.Beauvais DM, Burbach BJ, Rapraeger AC. The syndecan-1 ectodomain regulates alphavbeta3 integrin activity in human mammary carcinoma cells. The Journal of cell biology. 2004;167(1):171–81. doi: 10.1083/jcb.200404171. [DOI] [PMC free article] [PubMed] [Google Scholar]
- 12.Beauvais DM, Ell BJ, McWhorter AR, Rapraeger AC. Syndecan-1 regulates alphavbeta3 and alphavbeta5 integrin activation during angiogenesis and is blocked by synstatin, a novel peptide inhibitor. The Journal of experimental medicine. 2009;206(3):691–705. doi: 10.1084/jem.20081278. [DOI] [PMC free article] [PubMed] [Google Scholar]
- 13.Naganuma H, Satoh E, Asahara T, Amagasaki K, Watanabe A, Satoh H, et al. Quantification of thrombospondin-1 secretion and expression of alphavbeta3 and alpha3beta1 integrins and syndecan-1 as cell-surface receptors for thrombospondin-1 in malignant glioma cells. Journal of neuro-oncology. 2004;70(3):309–17. doi: 10.1007/s11060-004-9167-1. [DOI] [PubMed] [Google Scholar]
- 14.McNally LR, Welch DR, Beck BH, Stafford LJ, Long JW, Sellers JC, et al. KISS1 over-expression suppresses metastasis of pancreatic adenocarcinoma in a xenograft mouse model. Clinical & experimental metastasis. 2010;27(8):591–600. doi: 10.1007/s10585-010-9349-5. [DOI] [PMC free article] [PubMed] [Google Scholar]
- 15.DeRosier LC, Buchsbaum DJ, Oliver PG, Huang ZQ, Sellers JC, Grizzle WE, et al. Combination treatment with TRA-8 anti death receptor 5 antibody and CPT-11 induces tumor regression in an orthotopic model of pancreatic cancer. Clinical cancer research: an official journal of the American Association for Cancer Research. 2007;13(18 Pt 2):5535s–43s. doi: 10.1158/1078-0432.CCR-07-1075. [DOI] [PMC free article] [PubMed] [Google Scholar]
- 16.Hillman EM, Moore A. All-optical anatomical co-registration for molecular imaging of small animals using dynamic contrast. Nature photonics. 2007;1(9):526–30. doi: 10.1038/nphoton.2007.146. [DOI] [PMC free article] [PubMed] [Google Scholar]
- 17.Razansky D, Deliolanis NC, Vinegoni C, Ntziachristos V. Deep tissue optical and optoacoustic molecular imaging technologies for pre-clinical research and drug discovery. Current pharmaceutical biotechnology. 2012;13(4):504–22. doi: 10.2174/138920112799436258. [DOI] [PubMed] [Google Scholar]
- 18.Ntziachristos V, Ripoll J, Wang LV, Weissleder R. Looking and listening to light: the evolution of whole-body photonic imaging. Nature biotechnology. 2005;23(3):313–20. doi: 10.1038/nbt1074. [DOI] [PubMed] [Google Scholar]
- 19.Schaafsma BE, Mieog JS, Hutteman M, van der Vorst JR, Kuppen PJ, Lowik CW, et al. The clinical use of indocyanine green as a near-infrared fluorescent contrast agent for image-guided oncologic surgery. Journal of surgical oncology. 2011;104(3):323–32. doi: 10.1002/jso.21943. [DOI] [PMC free article] [PubMed] [Google Scholar]
- 20.Herzog E, Taruttis A, Beziere N, Lutich AA, Razansky D, Ntziachristos V. Optical imaging of cancer heterogeneity with multispectral optoacoustic tomography. Radiology. 2012;263(2):461–8. doi: 10.1148/radiol.11111646. [DOI] [PubMed] [Google Scholar]
- 21.Xu C, Kumavor PD, Alqasemi U, Li H, Xu Y, Zanganeh S, et al. Indocyanine green enhanced co-registered diffuse optical tomography and photoacoustic tomography. Journal of biomedical optics. 2013;18(12):126006. doi: 10.1117/1.JBO.18.12.126006. [DOI] [PMC free article] [PubMed] [Google Scholar]
- 22.Huynh AS, Abrahams DF, Torres MS, Baldwin MK, Gillies RJ, Morse DL. Development of an orthotopic human pancreatic cancer xenograft model using ultrasound guided injection of cells. PloS one. 2011;6(5):e20330. doi: 10.1371/journal.pone.0020330. [DOI] [PMC free article] [PubMed] [Google Scholar]
- 23.Reynolds CP, Sun BC, DeClerck YA, Moats RA. Assessing growth and response to therapy in murine tumor models. Methods in molecular medicine. 2005;111:335–50. doi: 10.1385/1-59259-889-7:335. [DOI] [PubMed] [Google Scholar]


