

Abstract
Due to the intensive commercial application of silver nanoparticles (Ag-NPs), their health risk assessment is of great importance. For acute toxicity evaluation of orally administered Ag-NPs, induction of reactive oxygen species (ROS), activity of liver function enzymes [(Alanine (ALT/GPT), Aspartate (AST/GOT), Alkaline Phosphatase (ALP)], concentration of lipid hydroperoxide (LHP), comet assay and histopathology of liver in the rat model were performed. Four groups of five male rats were orally administered Ag-NPs, once a day for five days with doses of 5, 25, 50, 100, mg/Kg, body weight. A control group was also made of five rats. Blood and liver were collected 24 hours after the last treatment following standard protocols. Ag-NPs exposure increased the induction of ROS, activities of the liver enzymes (ALT, AST, ALP), concentration of Lipid hydroperoxide (LHP), tail migration and morphological alterations of the liver tissue in exposed groups compared to control. The highest two doses, 50 mg/kg and 100 mg/kg showed statistically significant (p<0.05) increases in ROS induction, ALT, AST, ALP activity, LHP concentration, DNA damage and morphological alterations of liver compared to control. Based on these results, it is suggested that short-term administration of high doses of Ag-NP may cause organ toxicity and oxidative stress.
Keywords: silver nanoparticles, hepatotoxicity, reactive oxygen species, serum aminotransferases (alanine, aspartate), alkaline phosphatase, lipid hydroperoxide, histopathology, comet assay and Sprague-Dawley rats
Introduction
Silver nanoparticles (Ag-NPs) are among the most commercialized nanomaterial worldwide. Due to their strong antibacterial activity, Ag-NPs can be found in many consumer products including textiles, cosmetics, deodorants, bandages, contraceptives, cleaning products, sprays as well as life sciences and biotechnology applications [1–3]. Exposure to nanoparticles can occur via water, food, cosmetics, drugs, and drug delivery devices and can lead to a wide variety of toxicological effects [4]. Nanometer-sized particles have shown special toxicity and are usually more toxic than the bulk material of larger size. With the increasing utilization of Ag-NPs, the general population has a greater risk of exposure through occupational environment and consumer products in daily life [5]. Additionally, the adverse effects of Ag-NPs on human health and the environment are of increasing concern. There is currently, insufficient knowledge about the toxicity of nanomaterial and a need for more in vivo studies. For the safe and proper implementation of the nanomaterials for biological applications, it is necessary to expand nanotoxicology research in various animal models [6].
To date, the studies that report on toxic effects of Ag-NPs either in vivo [4, 6–12] or in vitro [1, 13–27] provide initial data indicating adverse health effects of cells exposed to Ag-NPs. However, those available, peer-reviewed toxicological data for Ag-NPs are rather divergent and insufficient to assess the toxic effects in humans and laboratory animals. The reason for these discrepancies is not immediately evident but may depend on experimental protocols and/or interferences with test system used [28]
Engineered nanomaterials have the ability to interact with biological tissues and generate reactive oxygen species (ROS) that has been proposed as possible mechanism of toxicity [29]. ROS are well known to play both a deleterious and beneficial role in biological interactions. Generally, harmful effects of reactive oxygen species on the cell include damage of DNA, oxidation of polydesaturated fatty acids in lipids (lipid hydroperoxidation), oxidation of amino acids in proteins and inactivation of specific enzymes by oxidation of co-factors. The increased generation of ROS has been shown to result from exposure to many different forms of fine, ultrafine, and nanoscale particles, including Ag-NPs.
The oxidative catabolism of polyunsaturated fatty acids, known as lipid hydroperoxidation (LHP), is a widely accepted mechanism of cellular injury and death [30–31]. LHP and free radical generation are complex and deleterious processes that closely correlate to toxicity [32]. LHP has been implicated in diverse pathological conditions. The extension of the oxidative catabolism of lipid membranes can be evaluated by several endpoints, but the most widely used method is the quantification of lipid hydroperoxide (LHP), a stable aldehydic product of lipid peroxidation, present in biological samples [33].
Since most chemicals are metabolized in the liver, hepatocytes are targets for ROS. A free radical attack results in lipid peroxidation, which can be linked to the electron transport chain of chemical metabolism and potentially hepatotoxicity. Normally hepatotoxicity detections methods vary with the circumstances of their use. In this case, demonstrating a physiologically significant adverse effect requires in vivo studies. Biochemically, serum enzyme analyses have become the standard measure of hepatotoxicity during the past 25 years [34]. Measurement of enzyme activities in serum permit detection of hepatotoxicity with far less labor than that required for other tests. The rationale for the use of serum transaminases and other enzymes is that these enzymes, normally contained in the hepatocytes, gain entry into the general circulation after cellular injury [35].
This study assesses the effects of oral administrated Ag-NPs on ROS induction, DNA damage, histopathology and various hepatotoxicity markers in a rat model. The literature is dominated by studies involving intra peritoneal (ip) or intra venous (iv) administration of Ag-NPs. The few studies that do observe the effect of oral administration are focused on long-term effects of distribution, elimination [36], and inflammatory responses of different size [37]. Thus, the acute effects of Ag-NPs are not well understood. This study is the first step towards understanding the effects of Ag-NPs in this acute phase Liver is one of the recurrent target organ found after intra venous (iv) or intra peritoneal (ip) injection of Ag-NPs in diverse populations and even sometimes the dominant site of accumulation [6,8–10]. Therefore, the results presented here are of importance for health risk assessment.
Material and Methods
Chemicals
Silver nanoparticles (Ag-NPs) in water (10nm diameter) were purchased from Ocean NanoTech, LLC. (Fayetteville, Arkansas, USA). Xylene, ethyl alcohol, paraffin wax, hematoxylin-eosin stain, Diagnostic kits for serum aminotransferase and alkaline phosphatase were also obtained from Sigma-Aldrich (St. Louis, MO, USA). Lipid peroxidation kits were purchased from Calbiochem (La, Jolla, CA, USA), Comet assay kit was purchased from Trevigen, Inc. (Gaithersburg MD, USA) 2′,7′-dichlorofluorescin diacetate (DCFH-DA) from Molecular Probes, Inc. USA.
Test system and Treatment
The Ag-NPs were suspended directly in deionized water (DI water) and dispersed by ultrasonic vibration (100 W, 30 KHz) for 30 min to produce four different concentrations at 5 mg/Kg, 25 mg/Kg, 50 mg/Kg and 100 mg/Kg.
Characterization of Silver nanoparticles (Ag-NP)
The size of Ag-NPs was characterized using transmission electron microscopy (TEM). The Ag-NPs were homogeneously dispersed in water, placing a drop of homogeneous suspension on a copper grid with a lacey carbon film and allowing it to dry in air. Images (Figure 1) were collected using a field emission JEOL-JEM-2100F, TEM, operating at 200 KV (JEOL, Tokyo, Japan).
Figure 1.

A: Transmission Electron Microscope Image of silver nanoparticle. Diameter size of 10 nm
Nanostructure size and zeta potential were measured in deionized water (DI water) using a Zetasizer (Malvern, Worcestershire, UK) (Figure 2). Briefly, the nanoparticle samples were measured after dilution of an Ag-NP stock solution of 50 μg/ml in water. These dilutions were vortexed and sonicated for 5 min to provide a homogenous dispersion. For the size measurement, 1 ml of the diluted dispersion Ag-NPs was transferred to a 1 cm2 cuvette for dynamic size measurement (Fig 2A, B). For zeta potential measurement, a Malvern zeta potential cell was washed 3–4 times with ultrapure water followed by transferring 850 μl of diluted dispersion Ag-NPs to this cell to measure the zeta potential (Fig 2C). To assure the quality of the data the concentration of the samples and experimental methods were optimized. Sixty nm NIST standard gold nanoparticles were used in the validation of the instrument. Both size and zeta potential were measured at least three times. The data were calculated as the average size or zeta potential of Ag-NPs.
Figure 2.

(A) Ag-NPs size by intensity, (B) Raw correlation data (C) Zeta Potential.
Animal Maintenance
Healthy adult male Sprague-Dawley rats (8–10 weeks of age, with average body weight (BW) of 125±2 g) were used in this study. They were obtained from Harlan-Sprague-Dawley Breeding Laboratories in Indianapolis, Indiana, USA. The rats were randomly selected and housed in polycarbonate cages (three rats per cage) with steel wire tops and corn-cob bedding. They were maintained in a controlled atmosphere with a cyclic 12h dark/12h light cycle, a temperature of 22 ± 2 °C and 50–70% humidity and also with free access to pelleted feed and fresh tap water. The rats were allowed to acclimate for 10 days before treatment.
Doses of Silver Nanoparticles
Groups of five rats each were treated with four different silver nanoparticle (Ag-NP) dose levels. Silver Nanoparticles were diluted with deionized water, as required, and orally administered using feeding needles to the rats at the doses of 5, 25, 50, and 100 mg/Kg BW, one dose per 24 h given for 5 days. Each rat received a total of five doses at 24 h intervals. Deionized water was used as negative control and was administered in the same manner as in the treatment groups.
The local Ethics committee for animal experiments [Institutional Animal Care and Use Committee] at Jackson State University, Jackson MS, (USA) approved this study. Procedures involving the animals and their care conformed to the institutional guidelines, in compliance with national and international laws and guidelines for the use of animals in biomedical research [38].
Preparation of Homogenates
At the end of the 5 days exposure to Ag-NPs, liver was excised under anesthesia. The organs were washed thoroughly in ice-cold physiological saline and weighed. 10% homogenate of each tissue was prepared separately in 0.05 M phosphate buffer (pH 7.4) containing 0.1 mM EDTA using a motor driven Teflon-pestle homogenizer (Fischer), followed by sonication (Branson Sonifer), and centrifugation at 500 × g for 10 min at 4° C. The supernatant was decanted and centrifuged at 2000 × g for 60 min at 4° C. The cellular fraction obtained was called ‘homogenate’ and used for the assays.
Reactive Oxygen Species (ROS) Detection
ROS production was quantified by the 2′,7′-Dichlorodihydrofluorescin Diacetate (DCFH-DA) method with slight modification [39] based on the ROS-dependent oxidation of DCFH-DA to DCF. An aliquot of liver homogenates from each exposed group and controls were centrifuged at 1000 × g for 10 min (4° C). The supernatants were re-centrifuged at 1000 × g for 20 min at 4° C, and then the pellet was re-suspended. The DCFH-DA solution with the final concentration of 50 μM and re-suspension were incubated for 30 min at 37° C. Fluorescence of the samples was monitored at an excitation wavelength of 485 nm and an emission wavelength of 538 nm after 5 days. The positive control, hydrogen peroxide (30% H2O2), was used to assess the reactivity of the probe.
Serum Biochemical Analysis
Following anesthetization, blood specimens were immediately collected using heparinized syringes, and transferred into polypropylene tubes. Each sample was allowed to clot for a minimum of 30 min (maximum 60 min). After clotting, the sample was centrifuged at 750 × g for 10 min. The serum then was pipetted from the cellular elements (erythrocytes, platelets, leucocytes) and transferred to an acid-washed polypropylene tube, properly labeled, and stored at 4° C until ready for analysis. The activities of certain liver enzymes such as alanine (GPT) and aspartate (GOT) aminotransferases, alkaline (ALP) phosphatase in the serum samples were determined using colorimetric assay kits.
Enzyme Analysis
Serum Aminotransferases
A method by Reitman and Frankel [40] was followed to determine the activities of alanine or glutamate pyruvate transaminase (ALT/GPT) and aspartate or glutamate oxaloacetate transaminase (AST/GOT) in serum with slight modifications. Human serum contains many different transaminases. The two most commonly determined are ALT/GPT and AST/GOT. These enzymes catalyze transfer of alpha amino groups from specific amino acids to alpha-ketoglutaric acid [AKG] to yield glutamic acid and oxaloacetic or pyruvic acid. The keto acids are then determined colorimetrically after their reaction 2, 4-dinitrophenyl hydrazine [DNP]. The absorbance of the resulting color is then measured at wavelength of approximately 505 nm to take advantage in the absorption that exists between the hydrazones of AKG and the hydrazones of oxaloacetic acid or pyruvic acid.
The reaction for GOT is as follows:
The reaction for GPT is as follows:
Determination of GPT or Alanine Transaminases
1.0 ml of prepared alanine α-KG substrate is pipetted out into test tubes for exposed and control samples and placed in 37° C water bath to warm. Next, 0.2 ml serum is added and gently shaken to mix and left in the water bath. Exactly 30 minutes after adding serum, 1.0 ml Sigma color reagent is added, gently agitated, and left at room temperature for 20 minutes. 10 ml of 0.40 N (Normal) sodium hydroxide solution is added to the reaction mixture after 20 minutes, mixed by inversion, and left at room temperature for an additional 5 minutes. The absorbance was read and recorded at the same wavelength (505 nm) as used in preparing the calibration curve using water as a reference. The GPT activity is determined in Sigma Frankel (SF) units/ml from corresponding readings on the calibration curve.
Determination of GOT or Aspartate Transaminases
1.0 ml of prepared aspartate substrate is pipetted out into test tubes for exposed and control samples and placed in 37° C water bath to warm. Next, 0.2 ml serum is added, gently shaken to mix, and left in the water bath. Exactly 60 minutes after adding serum, 1.0 ml color reagent is added, gently agitated, and left at room temperature for 20 minutes. 10 ml of 0.40 N (Normal) sodium hydroxide solution is added to the reaction mixture after 20 minutes, mixed by inversion, and left it at room temperature for additional 5 minutes. The absorbance was read and recorded at the same wavelength (505 nm) as used in preparing the calibration curve, using water as a reference. GOT activity is determined in Sigma Frankel (SF) units/ml from corresponding readings on the calibration curve.
Alkaline Phosphatases
To determine the activity of alkaline phosphatase in serum a method by Kay et al [41] was followed with slight modification. Alkaline phosphatase is also known as orthhophosphoric monoester phosphohydrolase, ALP. It is a prototype of those enzymes that reflect pathological reductions in bile flow. This enzyme has been extensively employed in experimentally induced hepatic dysfunction. Alkaline phosphatase refers, not to a single enzyme, but to a family of enzymes with different physico-chemical properties and broad overlapping substrate specificities.
The procedure for alkaline phosphatase depends upon the hydrolysis of p-nitrophenyl phosphate by the enzyme, yielding p-nitrophenol and inorganic phosphate. When made alkaline, p-nitrophenol is converted to a yellow complex readily measured at 400–420 nm. The intensity of color formed is proportional to phosphatase activity.
The reaction for ALP is as follows:
Determination of serum alkaline phosphatases
In order to determine the activity of serum alkaline phosphatases, 15 ml test tubes are taken with one labeled as “Blank” and another set as “TEST” which contains the exposed and control samples. Into each of the test tubes, 0.5 ml alkaline buffer solution and 0.5 ml of stock substrate solution is pipetted out and placed in 37° C water bath to equilibrate. Into the test tube labeled “Blank”, 0.1 ml water is added and 0.1ml serum of exposed group into respective tubes labeled “Test.” Time is recorded, and samples are mixed gently and promptly replaced in 37° C water bath. After 15 minutes, 10.0 ml of 0.05 N (Normal) sodium hydroxide (NaOH) is added to all of the test tubes and mixed by inversion. The absorbance of “Test” versus “Blank” is read as a reference at a wavelength of 420 nm in a visible spectrophotometer (BIO-RAD). The first absorbance of the reaction mixture is the initial readings of the activity of alkaline phosphatase in serum. The units of alkaline phosphatases are determined from the corresponding calibration curve. To each of the test tubes four drops of (approximately 0.2 ml) concentrated hydrochloric acid (HCl) is added and mixed. The absorbance of the “Test” versus “Blank” is read again. These recorded absorbances are the final readings of the reaction mixture. The alkaline phosphatase activity is obtained by subtracting the final absorbance reading of the corresponding group from the initial absorbance reading.
Lipid Hydroperoxide Assay (LHP)
The tissues were homogenized (1:8, w/v) in cold HPLC-grade water. Five hundred microliter (500 μl) of the each tissue homogenate was taken in a glass test tube and equal volume of Calbiochem supplied Extract R saturated methanol was added. The mixture was vortexed for few minutes and 1 ml of cold deoxygenated chloroform was added to the sample mixture, vortexed it thoroughly. The mixture was centrifuged at 1500 × g for 5 min at 0°C (Beckman XL-100K, USA) and bottom chloroform layer was collected. Five hundred μl of the bottom chloroform was mixed with 450μl of chloroform:methanol (2:1) mixture and 50μl of Calbiochem supplied chromogen (thiocyanate ion). Then the mixture was incubated for 5 min and the absorbance of each sample was recorded at 500 nm wavelength using spectrophotometer (2800 Unico spectrophotometer USA). This method directly measures the lipid hydro-peroxides utilizing redox reactions with ferrous ions, the produced hydroperoxides are highly unstable and react readily with ferrous ions to produce ferric ions. The produced ferric ions were detected using thiocyanate ion as chromogen. Calbiochem supplied lipid hydroperoxides solution was used as reference standard.
Comet Assay
Single Cell gel electrophoresis (SCGE) or comet assay was performed using Singh et al [42] method with slight modifications. Liver homogenate of rats were used and re-suspended in phosphate buffer saline. Following isolation the cells were mixed with 0.4% Trypan blue solution. After 15–20 min cells were counted and checked for viability. The remaining cells were immediately used for single-cell gel electrophoresis. In a 2 ml centrifuge tube, 50 μl of the lymphocyte suspension and 500 μl of low melting agarose were mixed and 75 μl of the suspension pipetted onto a pre-warmed comet-slide. The slides were placed flat in the dark at 4° C for 10 min for the mixture to solidify. The slides were then placed in pre-chilled lysing solution at 4° C for 1 hr. Slides were removed from lysing solution, tapped on a paper towel to remove any excess lysis solution and immersed in alkaline solution (pH =13) for 45 min at room temperature in the dark. The slides were washed twice for 5 min with Tris-Borate (TBE) buffer. Next the slides were electrophoresed at low voltage (300 mA, 25V) for 20 min. Slides were removed from the electrophoresis unit after the designated time, tapped to remove excess tris-borate buffer and immediately placed in 70% ethanol for 5 min and air-dried overnight at room-temperature. After overnight drying the slides were stained with SYBR-Green designed for comet assay and allowed to dry overnight. All the steps of the comet assay were conducted under yellow lamp in the dark to prevent additional DNA damage. The slides were read using an automated epifluorescence microscope and computer based DNA damage analysis software from Loats & Associates (Westminster, MD). The data were based on 100 randomly selected cells per sample, i.e., 50 cells were from each of the two replicate slides. Percent DNA in the tail was selected as an indicator of DNA damage.
Histopathological Analysis
Liver was surgically removed from rats under diethyl ether anesthesia. Portions of liver were taken and washed with ice-cold normal saline (0.9% NaCl) and 20 mM EDTA to remove blood, cut into small pieces, and fixed immediately in 10 percent phosphate-buffered formalin for 48 hrs. The tissues were then transferred to 70% ethyl alcohol and stored until processed. The tissue specimens (liver) were processed, embedded in paraffin, sectioned at 0.1 μm, and stained with hematoxylin and eosin (H & E) for histological examination under a light microscope. The extent of tissue injury was estimated semi-quantitatively and lesions scored as multi-focal fibrosis/necrosis. At least 20 slides of each sample were scored for liver histology. The liver morphology scored as follows: 0= normal, 1 = mild cellular disruption in less than 25% of field area, 2 = moderate cellular disruption and hepato cellular vacuolation greater than 50% of field area, 3 = extensive cell disruption, hepato cellular vacuolation and condensed nuclei (pycknotic) of hepatocytes in greater than 50% of field area, 4 = extensive cell disruption, hepato cellular vacuolation, pycknotic and occasional central vein injury and 5= extensive cell disruption, multi central vein necrosis and degenerating of liver in more than 50% of field area.
Statistical Analysis
Statistical analysis was performed with SAS 9.1 software for Windows XP. Data was presented as Means ± SDs. One-way analysis of variance (ANOVA) with p-values less than 0.05 were considered as statistically significant. Dunnett T-Test was used for post hoc evaluation of the data.
Results
Nanomaterial Characterization
Nanoparticles were characterized by TEM with respect to morphology, diameter, tendency of aggregation and cellular distribution. Ag NPs were mainly spherical shaped (Figure 1). To understand the state of dispersion of the particles when placed into deionized water (DI-water), the Ag NPs sample was analyzed by dynamic light scattering (DLS). The results from DLS showed agglomeration of Ag NPs more than its primary size, and the zeta potential value of Ag NPs was shown to be −33.2 mV Figure 2. A solution is considered stable if the zeta potential value is more negative than −30 mV or more positive than + 30 mV. Figure 3 showing a TEM of liver tissue showing uptake of Ag-NPs. The release of Ag+ ions is demonstrated in Table 1.
Figure 3.
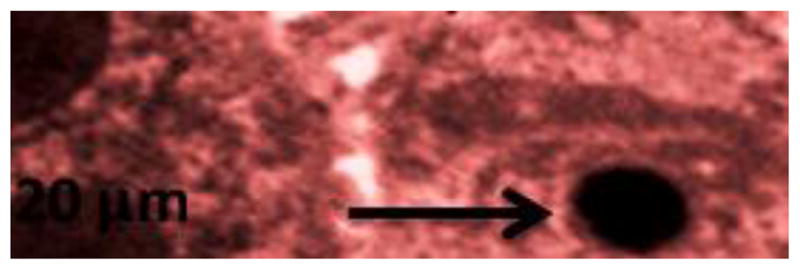
Transmission Electron Microscope Image of Liver Tissue showing uptake of Ag-NP.
Table 1.
Mean release of Ag+ ions (mg/Kg) to the DI-water: n=not measurable
| Concentration (mg/Kg) | Relaease of Ag+ ion
|
|
|---|---|---|
| Exposure to Ag | Exposure to Ag NPs | |
| Control | n | n |
| 5 | 3.4 | 3.6 |
| 25 | 40.2 | 59.4 |
| 50 | 80.5 | 221.6 |
| 100 | 428.2 | 604.8 |
ROS Detection
The administration of Ag-NPs to rats significantly enhanced the ROS level at four tested doses as compared to the control animals. Figure 4 summarizes the detection of intracellular production of ROS in Sprague-Dawley rats exposed to Ag-NPs and controls. The results yielded fluorescence of 11.32± 2.75, 19.33 ± 5.84, 21.83 ± 5.47, 30.48 ± 6.60 and 34.31 ± 10.70 for control, 5, 25, 50 and 100 mg/Kg Ag-NPs respectively. The highest two doses of Ag-NPs showed statistically significant effect in increasing the induction of ROS when compared to control. However, comparing the two highest doses, there was no statistically significant effect in induction of ROS.
Figure 4.

Effect of silver nanoparticles on the induction of reactive oxygen species in liver homogenate of Sprague-Dawley rats. Each experiment was done in triplicate. Data represents mean ± SD. Statistical significance (p<0.05) is depicted as (*).
Enzyme Analysis
Alanine aminotransferase
Figure 5 presents the experimental data obtained from the analysis of alanine aminotansferases (ALT/GPT). The results yielded optical density readings of 0.263 ± 0.01, 0.399 ± 0.03, 0.406 ± 0.01, 0.586 ± 0.05, 0.612 ± 0.03 for 0, 5, 25, 50 and 100 mg/Kg Bwt. of silver nanoparticles respectively were observed. As shown in this figure there was an increase in the activity of alanine (ALT/GPT) in the serum of Sprague-Dawley rats. The highest doses 50 and 100 mg/kg were found to show statistically significant effect in elevating the activity of ALT/GPT when compared to control. However, comparing the two highest doses, there was no statistically significant effect in elevating enzyme activity.
Figure 5.
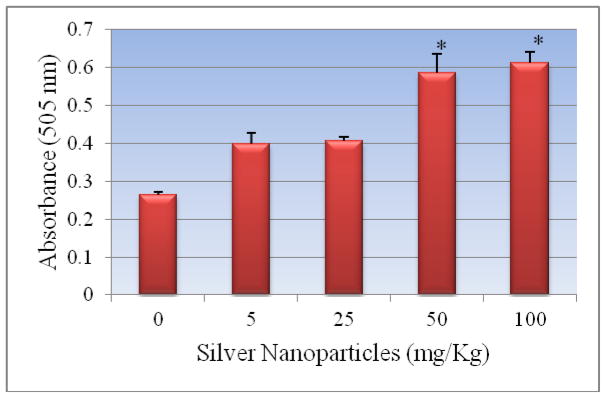
Effect of silver nanoparticles on the activity of serum alanine transferases in Sprague-Dawley rats Each experiment was done in triplicate. Data represents mean ± SD. Statistical significance (p<0.05) is depicted as (*).
Aspartate Aminotransferase
Figure 6 presents the experimental data obtained from the analysis of aspartate aminotransferases. Silver nanoparticle exposure resulted in elevating the activity of AST/GOT in dose-dependent manner. Optical density readings of 0.297 ± 0.011, 0.309 ± 0.04, 0.565 ± 0.011, 0.723 ± 0.013, 0.746 ± 0.04 for 0, 5, 25, 50 and 100 mg/Kg Bwt. of silver nanoparticles respectively were obtained. The highest two doses 50 and 100 mg/Kg of Ag-NPs showed significant elevation in the activity of the enzyme. However, comparing the two highest doses, there was no statistically significant effect in elevating enzyme activity.
Figure 6.

Effect of silver nanoparticles on the activity of serum aspartate transferases in Sprague-Dawley rats. Each experiment was done in triplicate. Data represents mean ± SD. Statistical significance (p<0.05) is depicted as (*).
Alkaline Phosphatases
The activity of alkaline phosphatase exposed to silver nanoparticle is represented in Figure 7. As shown in the figure there was an increase in the activity of alkaline phosphatases in rats treated with silver nanoparticles compared to control. The highest two doses 50 mg/Kg and 100 mg/Kg was found to show statistically significant effect in elevating the activity of alkaline phosphatases in serum of Sprague-Dawley rats. However, comparing the two highest doses, there was no statistically significant effect in elevating enzyme activity. Optical density readings of 0.113 ± 0.019, 0.165 ± 0.032, 0.203 ± 0.019, 0.220 ± 0.013 and 0.312 ± 0.027 for 0, 5, 25, 50 and 100 mg/Kg Bwt silver nanoparticles respectively were obtained.
Figure 7.
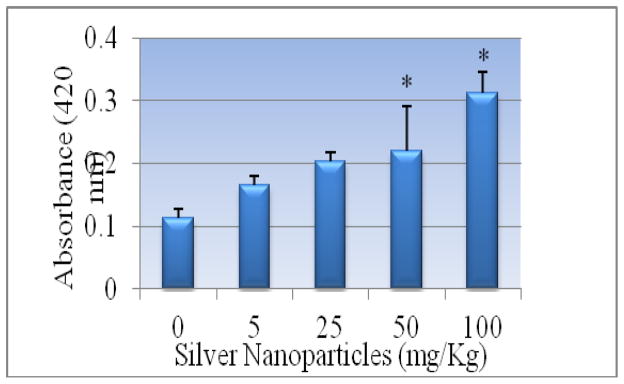
Effect of silver nanoparticles on the activity of serum alkaline phosphatase in Sprague-Dawley rats. Each experiment was done in triplicate. Data represents mean ± SD. Statistical significance (p<0.05) is depicted as (*).
Lipid Hydroperoxides (LHP)
Lipid hydroperoxides assay was performed to determine the hydroperoxides levels in serum of rats exposed to silver nanoparticle and controls. The LHP standard curve is presented in Figure 8a. The LHP level of the serum was significantly increased in dose-dependent manner compared to the control groups. The LHP levels in serum were 7.84 ± 2.03, 20.7 ± 3.11, 27.9 ± 4.62, 31.68 ± 3.74 and 55.78 ± 4.62 μM for 0, 5, 25, 50 and 100 mg/Kg BWt silver nanoparticles, respectively (Figure 8b).
Figure 8.

Figure 8a: Standard curve for Lipid hydro peroxides (LPO) assay where y-axis represents absorbance at 500nm whereas x-axis represents the concentrations of reference standard (nmol).
Figure 8b: Effect of silver nanoparticles on the level of lipid hydroperoxides in liver homogenate of Sprague-Dawley rats. Each experiment was done in triplicate. Data represents mean ± SD. Statistical significance (p<0.05) is depicted as (*).
Comet Assay (DNA damage)
Percent tail DNA is an important parameter in evaluating the DNA damage. All the doses of Ag-NPs showed an increase in percent tail DNA [19.33 ± 5.84, 24.69 ± 6.06, 30.48 ± 6.60 and 34.31 ± 10.70] indicating DNA damage when compared with control [13.58 ± 4.66]. Maximum increase in mean comet tail-length was observed at 100 mg/kg (BW) of Ag-NPs after 5 days post-treatment [34.31%]. The highest two doses (50mg/Kg and 100mg/Kg) of Ag-NPs showed a statistical significant increase in percent tail DNA compared to control. However, comparing the two highest doses, there was no statistically significant effect in elevating percent tail DNA. The results of DNA damage are illustrated in Figures 9a and 9b, respectively.
Figure 9.
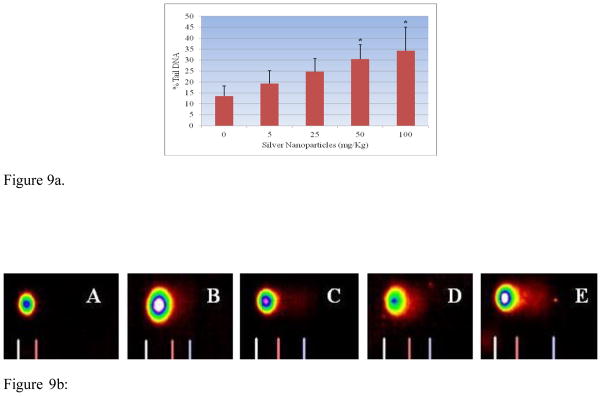
Figure 9a. Effect of silver nanoparticles on the tail migration in comet assay of liver homogenate in Sprague-Dawley rats. Each experiment was done in triplicate. Data represents mean ± SD. Statistical significance (p<0.05) is depicted as (*).
Figure 9b: Representative Images of comets of liver tissue exposed to silver nanoparticle A-Deionized water (control); B-5 mg/Kg; C- 25 mg/kg; D – 50 mg/kg; E-100 mg/kg.
Histopathological Evalution of Liver
Figure 10 summarizes the histological score for each group. Indices of liver (liver wet weight/body weight) were apparently increased in rats after oral injection of Ag-NPs compared with normal animals. Microscopic examination of the control liver had normal structure and compactly arranged hepatocytes. Sinusoids were scattered randomly all over the hepatocytes and they had uniform morphology along with central vein. However, the rats exposed to 25, 50 and 100 mg/Kg of Ag-NPs had remarkable morphological alterations. Hepatocytes disruption and hepatocellular vacuolation was observed in microscopic examination of 25 mg/Kg Ag-NPs exposed rat liver. In addition to the 25 mg/Kg Ag-NPs alterations, pycknotic or karyomegaly (condensed nuclei) of hepatocytes and partial disruption of central vein was observed in 50 mg/Kg Ag-NPs exposed rat liver. In addition to the above alterations, degeneration of liver (atrophy) and central vein injury was observed in 100 mg/Kg exposed rat liver. The results indicated that hepatic injury was successfully induced in rats treated with Ag-NPs.
Figure 10.
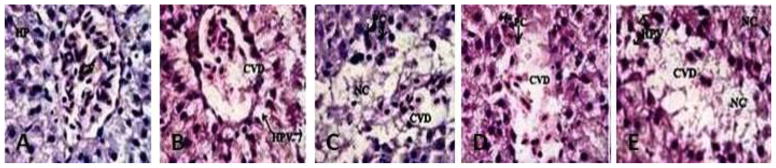
Histopathological Characterization (H & E Staining 1000 X) of liver in Spargue-Dawley rats exposed to silver nanoparticles (Ag-NPs). A= Negative Control Deionized water (CV= Central vein, HP=Hepatocytes), B= 5 mg/kg exposed liver (CVD= Central vein damage, HPV= Hepato cellular vacuolation, NC=Necrosis), C= 25 mg/kg (CVD= Central vein damage and NC= Necrosis), D= 50 mg/kg (CVD= Central vein damage, HPV= Hepato cellular vacuolation and PC=Pycknotic) and E= 100 mg/kg (C= Central vein damage, HPV=Hepato cellular vacuolation, NC=Necrosis and PC=Pycknotic). Each point represents a mean value and standard deviation of twenty values.
Discussion
In the present study oxidative stress and hepatotoxicity biomarkers were investigated using measurement of reactive oxygen species (ROS), concentration of lipid hydroperoxide (LHP), activities of certain liver enzymes (ALT/GPT, AST/GOT, ALP), DNA damage and histopathology of liver in Sprague-Dawley rats exposed to Ag-NPs. Hepatic function was evaluated by measuring the activities of serum ALT, AST and ALP. The results with serum aminotransferases were found to show an increase in the activity of ALT/GPT and AST/GOT with increasing concentration of Ag-NPs; however, only the highest doses 50 mg/Kg and 100 mg/Kg were found to show a statistically significant increase in the activity of ALT/GPT and AST/GOT compared to control. The fact reveals that serum ALT and AST levels were both elevated indicating that liver tissues were damaged following Ag-NPs administration. Liver is an important site for nanoparticle deposition [10], and may cause changes in the blood serum enzymatic composition. Serum proteins and the level of particular enzymes in blood serum is a good indicator of hepatocellular injury, hepatic inflammation, kidney function impairment and cholestesis [34]. Our results are in agreement with the study of Lee et al., [8] and Tiwari et al., [6] with serum suspended Ag-NPs showing higher toxicity in rats. The study clearly shows that highest doses, 50 and 100 mg/Kg, of Ag-NPs have significantly increased the activity of serum alkaline phosphatases compared to control. Alkaline phosphatase of the liver is produced by the cells lining the small bile ducts (ductoles) in the liver. If the liver disease is primarily of an obstructive nature (cholestatic), i.e. involving the biliary drainage system, the alkaline phosphatase will be the first and foremost enzyme that is found to increase. Serum activity of the enzyme has been reported to increase and is indicative of an impaired hepatic clearance (cholestasis). However, comparing the two highest doses, there was no statistically significant effect in elevating the ALT, AST and ALP activity.
To establish the role of oxidative stress as a decisive factor in Ag-NPs-induced toxicity, the level of lipid hydroperoxides in liver homogenates was measured. Lipid hydroperoxides (LHPs) are prominent non-radical intermediates of lipid peroxidation whose identification can often provide valuable mechanistic information (e.g. whether a primary reaction is mediated by a single oxygen or oxyradicals). The results in the present investigation demonstrated that a dose-dependent increase in the level of lipid hydroperoxides was observed; however, the highest doses of 50 and 100 mg/Kg bwt Ag-NP were found to be statistically significant in increasing the level of lipid hydroperoxidase. Our data is also in accordance with several other reports [43–45] indicating the influence of nanoparticles in implicating lipid hydroperoxides in Ag-NPs toxicity.
Reactive oxygen species (ROS) has been implicated in the toxicity of Ag-NPs by several authors [16, 26, 46]. Similar trends in the toxicity of various nanoparticles have been reported and that non-specific oxidative stress is one of the largest concerns in nanoparticle-induced toxicity [47]. In our study the highest two doses of Ag-NPs 50 mg/Kg and 100 mg/Kg showed statistically significant effect in increasing the induction of ROS when compared to control. However, comparing the two highest doses, there was no statistically significant effect in induction of ROS. In our results, an increase in ROS level with an increase in dose of nanoparticles shows that it is responsible for oxidative stress. This supports the molecular mechanism that proposes ROS formation with subsequent cellular damage to be the source of nanoparticle-induced toxicity. Silver and other nanoparticles bind with the organ tissues and cause potential toxic effects like cell activation, ROS production, inflammation and finally cell death [46]. Increased ROS produce a high amount of H2O2 in the cellular environment which can damage DNA and oxidize cellular proteins. Single gel-electrophoresis from liver sample showed comet formation in the 50 mg/Kg and 100 mg/Kg groups. Tail length and tail migration consequently increased from 25 mg/Kg to the 100 mg/Kg group and showed damage at the DNA level (Figure 9b). This damage can be explained due to ROS production because the level of ROS was also higher in 100 mg/Kg group than the 5 mg/Kg group (Figure 4).
Various nanomaterials have been demonstrated to accumulate on organs [48]. Among the organs affected, liver is the main target of Ag-NPs in addition to all blood derived antigens. Our histological observation reveals that Ag-NPs mainly displayed around the blood vessels, which were absorbed through the mesenteric vein via portal system and then distributed into hepatic tissues. In our study, the evaluation of liver exposed to Ag-NPs showed remarkable morphological alterations such as hepatocytes disruption, hepatocellular vacuolation, pycknotic or karyomegaly of hepatocytes and atrophy when compared to control. Kupffer cells are resident macrophages of the liver and play an important role in its normal physiology and homeostasis as well as participating in the acute and chronic responses of the liver to toxic compounds. Activation of Kupffer cells directly or indirectly by toxic agents results in the release of an array of inflammatory mediators, growth factors, and reactive oxygen species. This activation appears to modulate acute hepatocyte injury as well as chronic liver responses including hepatic cancer. Understanding the role Kupffer cells play in these diverse responses is a key in understanding mechanisms of liver injury [49]. In our study, we have also observed Ag-NPs deposited in Kupffer cells while hepatocytes exhibited mild infiltration of inflammatory cells in portal vein area. These findings indicate that Kupffer cells were involved in the process of inflammation following Ag-NPs exposure.
Ag-NPs dispersed in aqueous medium release Ag ions. It is important to differentiate toxic effects between Ag-NPs and the dissolved Ag ions. Ag-NPs and the released ions readily bind to proteins and DNA, thereby causing cell damage. In our study, we have quantified the amount of silver ions released during dispersion (Table 1), because the toxicity may be also arising from the released silver ions. If ionic silver that is released from the particle surface is responsible for the toxicity of silver nanoparticles (colloidal silver), then it is likely that smaller particles are more toxic than larger particles due to a larger surface area per weight unit. Regarding oral in vivo studies, only limited numbers of head-to-head comparisons using different particle sizes exist [18, 37, 50]. Other findings point towards smaller silver nanoparticles being more toxic than larger particles. Hadrup et al [51] in their review have summarized reports of several authors determining distribution of Ag-NPs in rodents. Orally administered silver has been described to be absorbed in a range of 0.4–18% in mammals with a human value of 18%. The following dose-dependent animal toxicity findings have been reported: death, weight loss, hyperactivity, altered neurotransmitter levels, altered liver enzymes, altered blood values, enlarged hearts and immunological effects. The observed toxicity was a function of nanoparticle size and amount injected. The clearance of small size silver particles was very high and remaining was phagocitized and persisted in other organs. However, intracellular agglomeration of Ag-NPs cannot be excluded. Agglomeration of Ag-NPs maybe diminishes its total surface area. It is however unclear how agglomeration affects the toxicity of Ag-NPs. Although it is most likely that this impairment in hepatotoxicity and oxidative stress biomarkers is associated with Ag-NPs toxicity, it may be due to smaller particles are more likely than larger particles to release silver ions from the surface. Further experiments are needed to elucidate as to whether small nanoparticle size are more toxic than large ones following oral administration. With current data regarding toxicity of Ag-NPs and its implications for policy makers, it’s under a lot of scrutiny. Nowack et al [52] reported 120 years of nanosilver history, where they quoted that nanosilver in the form of colloidal silver has been used since 1954, until very recently, did not use “nano” nomenclature. Regardless of what nomenclature is used, any concept of risk must ultimately derive from chemical and physical characteristics of a specific material.
Conclusions
In summary, short-term and high doses of Ag-NPs in rats causing hepatotoxicity and oxidative stress are reported. Serum biochemical changes, ROS induction, increase in the level of LHP, damage to DNA and damage to the liver tissue were observed. The proposed main toxicological mechanism is oxidative stress aroused in liver. The high toxicity of Ag-NPs does not implicate that they should be banned for biomedical applications; however, further toxicological studies in vivo have to be developed for evaluating hazards of occupational or environmental exposure to nanomaterials.
Acknowledgments
This research was supported in part by grants from U.S. DOD through the Engineer, Research and Development Center #W912HZ-10-2-0045 (CMCM) and in part by NIH-Center for Environmental Health (Grant No. 2G12MD007581-16) at Jackson State University.
References
- 1.Lee YH, Cheng FY, Chiu HW, Tsai JC, Fang CY, Chen CW, Wang YJ. Cytotoxicity, oxidative stress, apoptosis and the autophagic effects of silver nanoparticles in mouse embryonic fibroblasts. Biomaterials. 2014;35(16):4706–4715. doi: 10.1016/j.biomaterials.2014.02.021. [DOI] [PubMed] [Google Scholar]
- 2.Chen X, Schluesener HJ. Nanosilver: A product in medical application. Toxicol Letters. 2008;176:1–12. doi: 10.1016/j.toxlet.2007.10.004. [DOI] [PubMed] [Google Scholar]
- 3.Tripathy A, Chandrasekran N, Raichur AM, Mukherjee A. Antibacterial applications of silver nanoparticles synthesized by aqueous extract of Azadirachta indica (Neem) leaves. J Biomed Nanotech. 2008;4:1–6. doi: 10.1166/jbn.2009.038. [DOI] [PubMed] [Google Scholar]
- 4.Kim HR, Kim MJ, Lee SY, Oh SM, Chung KH. Genotoxic effects of silver nanoparticles stimulated by oxidative stress in human normal bronchial epithelial (BEAS-2B) cells. Mutat Res. 2011;726(2):129–135. doi: 10.1016/j.mrgentox.2011.08.008. [DOI] [PubMed] [Google Scholar]
- 5.Stebounova LV, Adamcakova-Dodd A, Kim JS, Park H, O’Shaughnessy PT, Grassain VH, Thorne PS. Nanosilver induces minimal lung toxicity or inflammation in a subacute murine inhalation model. Part and Fibre Toxicol. 2011;8(5) doi: 10.1186/1743-8977-8-5. [DOI] [PMC free article] [PubMed] [Google Scholar]
- 6.Tiwari DK, Jin T, Behari J. Dose-dependent in-vivo toxicity assessment of silver nanoparticle in Wistar rats. Toxicol Mech Methods. 2011;21(1):13–24. doi: 10.3109/15376516.2010.529184. [DOI] [PubMed] [Google Scholar]
- 7.Gliga AR, Skoglund S, Wallinder IO, Fadeel B, Karlsson HL. Size-dependent cytotoxicity of silver nanoparticles in human lung cells: the role of cellular uptake, agglomeration and Ag release. Part Fibre Toxicol. 2014;11:11. doi: 10.1186/1743-8977-11-11. [DOI] [PMC free article] [PubMed] [Google Scholar]
- 8.Lee TY, Liu MS, Huang LJ, Lue SI, Lin LC, Kwan AL, Yang RC. Bioenergetic failure correlates with autophagy and apoptosis in rat liver following silver nanoparticle intraperitoneally administration. Part Fibre Toxicol. 2013;10(1):40. doi: 10.1186/1743-8977-10-40. [DOI] [PMC free article] [PubMed] [Google Scholar]
- 9.Xue Y, Zhang S, Huang Y, Zhang T, Liu X, Hu Y, Zhang Z, Tang M. Acute toxic effects and gender-related biokinetics of silver nanoparticles following an intravenous injection in mice. J Appl Toxicol. 2012;32:890–899. doi: 10.1002/jat.2742. [DOI] [PubMed] [Google Scholar]
- 10.Kim YS, Kim JS, Cho HS, Rha DS, Park JD, Choi BS, Lim R, Chang HK, Chung YH, Kwon IH, Jeong J, Han BS, Yu IJ. Twenty-eight day oral toxicity, genotoxicity, and gender-related tissue distribution of silver nanoparticles in Sprague-Dawley rats. Inhal Toxicol. 2008;20:575–583. doi: 10.1080/08958370701874663. [DOI] [PubMed] [Google Scholar]
- 11.AshaRani PV, Mun GLK, Hande MP, Valiyaveettil S. Cytotoxicity and genotoxicity of silver nanoparticles in human cells. ACS Nano. 2009;3:279–290. doi: 10.1021/nn800596w. [DOI] [PubMed] [Google Scholar]
- 12.Rahman MF, Wang J, Patterson TA, Saini UT, Robinson BL, Newport GD, Murdock RC, Schlager JJ, Hussain SM, Ali SF. Expression of genes related to oxidative stress in mouse brain after exposure to silver-25 nanoparticles. Toxicol Letters. 2009;187:15–21. doi: 10.1016/j.toxlet.2009.01.020. [DOI] [PubMed] [Google Scholar]
- 13.Shi J, Sun X, Lin Y, Zou X, Li Z, Liao Y, Du M, Zhang H. Endothelial cell injury and dysfunction induced by silver nanoparticles through oxidative stress via IKK/NF-κB pathways. Biomaterials. 2014 doi: 10.1016/j.biomaterials.2014.04.093. S0142-9612(14)00491-8. [DOI] [PubMed] [Google Scholar]
- 14.Gaiser BK, Hirn S, Kermanizadeh A, Kanase N, Fytianos K, Wenk A, Haberl N, Brunelli A, Kreyling WG, Stone V. Effects of silver nanoparticles on the liver and hepatocytes in vitro. Toxicol Sci. 2013;131(2):537–47. doi: 10.1093/toxsci/kfs306. [DOI] [PubMed] [Google Scholar]
- 15.Mukherjee SG, O’Claonadh N, Casey A, Chambers G. Comparative in vitro cytotoxicity study of silver nanoparticle on two mammalian cell lines. Toxicol In Vitro. 2012;26(2):238–251. doi: 10.1016/j.tiv.2011.12.004. [DOI] [PubMed] [Google Scholar]
- 16.Kawata K, Osawa M, Okabe S. In vitro toxicity of silver nanoparticles at noncytotoxic doses to HepG2 human hepatoma cells. Environ Sci Technol. 2009;43:6046–6051. doi: 10.1021/es900754q. [DOI] [PubMed] [Google Scholar]
- 17.Hussain SM, Hess KL, Gearhart JM, Geiss KT, Schlager JJ. In vitro toxicity of nanoparticles in BRL 3A rat liver cells. Toxicol in Vitro. 2005;19:975–983. doi: 10.1016/j.tiv.2005.06.034. [DOI] [PubMed] [Google Scholar]
- 18.Carlson C, Hussain SM, Schrand AM, Brandich-Stolle LK, Hess KL, Jones RL, Schlager JJ. Unique cellular interaction of silver nanoparticles: size-dependent generation of reactive oxygen species. J Phys Chem. 2008;112:13608–13619. doi: 10.1021/jp712087m. [DOI] [PubMed] [Google Scholar]
- 19.Vinardell MP. In vitro cytotoxicity of nanoparticles in mammalian germ-line stem cell. Toxicol Sci. 2005;88:285–286. [Google Scholar]
- 20.Hsin Y, Chen C, Huang S, Shih T, Lai P, Chueh PJ. The apoptotic effect of nanosilver is mediated by a ROS- and JNK-dependent mechanism involving the mitochondrial pathway in NIH3T3 cells. Toxicol Lett. 2008;179:130–139. doi: 10.1016/j.toxlet.2008.04.015. [DOI] [PubMed] [Google Scholar]
- 21.Rogers EJ, Hsief SF, Organti N, Schmidt D, Bello D. A high throughput in vitro analytical approach to screen for oxidative stress potential exerted by nanomaterials using a biologically relevant matrix: Human blood serum. Toxicol In Vitro. 2008;22:1639–1647. doi: 10.1016/j.tiv.2008.06.001. [DOI] [PubMed] [Google Scholar]
- 22.Arora S, Jain J, Rajwade J, Paknikar K. Interactions of silver nanoparticles with primary mouse fibroblast cells. Toxicol Appl Pharmacol. 2008;236(3):310–18. doi: 10.1016/j.taap.2009.02.020. [DOI] [PubMed] [Google Scholar]
- 23.Arora S, Jain J, Rajwade J, Paknikar K. Cellular responses induced by silver nanoparticles: in vitro studies. Toxicol Lett. 2009;179(2):93–100. doi: 10.1016/j.toxlet.2008.04.009. [DOI] [PubMed] [Google Scholar]
- 24.Ahamed M, Karns M, Goodson M, Rowe J, Hussain SM, Schlager JJ, Hong Y. DNA damage response to different surface chemistry of silver nanoparticles in mammalian cells. Toxicol Appl Pharm. 2008;233:404–410. doi: 10.1016/j.taap.2008.09.015. [DOI] [PubMed] [Google Scholar]
- 25.Ahamed M, Posgai R, Gorey TJ, Nielsen M, Hussain SM, Rowe JJ. Silver nanoparticles induced heat shock protein 70, oxidative stress and apoptosis in Drosophila melanogaster. Toxicol Appl Pharmacol Toxicol. 2010;242(3):263–269. doi: 10.1016/j.taap.2009.10.016. [DOI] [PubMed] [Google Scholar]
- 26.Kim S, Choi EJ, Choi J, Chung K, Park K, Yi J. Oxidative stress-dependent toxicity of silver nanoparticles in human hepatoma cells. Toxicol In Vitro. 2009;23:1076–1084. doi: 10.1016/j.tiv.2009.06.001. [DOI] [PubMed] [Google Scholar]
- 27.Zanette C, Pelin M, Crosera M, Adami G, Bovenzi M, Larese FF, Florio C. Silver nanoparticles exert a long-lasting antiproliferative effect on human keratinocyte HaCaT cell line. Toxicol In Vitro. 2011;25(5):1053–1060. doi: 10.1016/j.tiv.2011.04.005. [DOI] [PubMed] [Google Scholar]
- 28.Singh N, Manshian B, Jenkins GJ, Griffiths SM, Williams PM, Maffeis TG, Wright CJ, Doak SH. NanoGenotoxicology: the DNA damaging potential of engineered nanomaterials. Biomaterials. 2009;30(23–24):3891–914. doi: 10.1016/j.biomaterials.2009.04.009. [DOI] [PubMed] [Google Scholar]
- 29.Nel A, Xia T, Madler L, Li N. Toxic potential of materials at the nano level. Science. 2006;311:622–627. doi: 10.1126/science.1114397. [DOI] [PubMed] [Google Scholar]
- 30.Gutteridge JMC, Quinlan GJ. Malondialdehyde formation from lipid peroxides in thiobarbituric acid test. The role of lipid radicals, iron salts and metal chelator. J Appl Biochem. 1983;5:293–299. [PubMed] [Google Scholar]
- 31.Halliwell B. Oxygen radicals: A common sense look at their nature and medical importance. Med Biol. 1984;62:71–77. [PubMed] [Google Scholar]
- 32.Murray RK, Granner DK, Mayes PA, Rodwell VW. Harper’s Biochemistry. 21. Englewood Cliffs, NJ: Prentice Hall; 1988. pp. 138–139. [Google Scholar]
- 33.De Zwart LL, Meerman JH, Commandeur JN, Vermeulen NP. Biomarkers of free radical damage applications in experimental animals and in humans. Free Radic Biol Med Jan. 1999;26(1–2):202–26. doi: 10.1016/s0891-5849(98)00196-8. Review. [DOI] [PubMed] [Google Scholar]
- 34.Loeb WF, Quimby FW, editors. The clinical chemistry of laboratory animals. Philadelphia, PA: Taylor & Francis; 1999. [Google Scholar]
- 35.Zimmerman, Seeff . Enzymes in hepatic disease. In: Goodly EL, editor. Diagnostic Enzymology. Lea & Febiger; Philadelphia, USA: 1970. pp. 1–38. [Google Scholar]
- 36.Van der Zande M, Vandebriel RJ, Van Doren E, Kramer E, Herrera Rivera Z, Serrano-Rojero CS, Gremmer ER, Mast J, Peters RJ, Hollman PC, Hendriksen PJ, Marvin HJ, Peijnenburg AA, Bouwmeester H. Distribution, elimination, and toxicity of silver nanoparticles and silver ions in rats after 28-day oral exposure. ACS Nano. 2012;6(8):7427–42. doi: 10.1021/nn302649p. [DOI] [PubMed] [Google Scholar]
- 37.Park EJ, Bae E, Yi J, Kim Y, Choi K, Lee SH, Yoon J, Lee BC, Park K. Repeated-dose toxicity and inflammatory responses in mice by oral administration of silver nanoparticles. Environ Toxicol Pharmacol. 2010;30(2):162–168. doi: 10.1016/j.etap.2010.05.004. [DOI] [PubMed] [Google Scholar]
- 38.Giles AR. Guidelines for the use of animals in biomedical research. Thromb Haemost. 1987;58(4):1078–1084. [PubMed] [Google Scholar]
- 39.Lawler JM, Song W, Demaree SR. Hindlimb unloading increases oxidative stress and disrupt antioxidant capacity in skeletal muscle. Free Radical Biol Med. 2003;35:9–16. doi: 10.1016/s0891-5849(03)00186-2. [DOI] [PubMed] [Google Scholar]
- 40.Reitman Frankel S. A colorimetric method for the determination of serum glutamic oxalacetic and glutamic pyruvic transaminases. Am J Clin Pathol. 1957;28(1):56–63. doi: 10.1093/ajcp/28.1.56. [DOI] [PubMed] [Google Scholar]
- 41.Kay HD. Plasma phosphatase. I Method of determination. Some properties of enzyme. J Biol Chem. 1930;89:235. [Google Scholar]
- 42.Singh NP, McCoy MT, Tice RR, Schneider EL. A simple technique for quantitation of low levels of DNA damage in individual cells. Exp Cell Res. 1988;175:184–191. doi: 10.1016/0014-4827(88)90265-0. [DOI] [PubMed] [Google Scholar]
- 43.Anreddy RN, Yellu NR, Devarakonda KR. Oxidative biomarkers to assess the nanoparticle-induced oxidative stress. Methods Mol Biol. 2013;1028:205–219. doi: 10.1007/978-1-62703-475-3_13. [DOI] [PubMed] [Google Scholar]
- 44.Wu Y, Zhou Q. Silver nanoparticles cause oxidative damage and histological changes in medaka (Oryzias latipes) after 14 days of exposure. Environ Toxicol Chem. 2013;32(1):165–173. doi: 10.1002/etc.2038. [DOI] [PubMed] [Google Scholar]
- 45.Piao MJ, Kang KA, Lee IK, Kim HS, Kim S, Choi J, Hyun JW. Silver nanoparticles induce oxidative cell damage in human liver cells through inhibition of mitochondria-involved apoptosis. Toxicol Letters. 2011;201:92–100. doi: 10.1016/j.toxlet.2010.12.010. [DOI] [PubMed] [Google Scholar]
- 46.Xia T, Kovochich M, Brant J, Hotze M, Sempf J, Oberley T, Sioutas C, Yeh JI, Wiesner MR, Nei AE. Comparison of the abilities of ambient and manufactured nanoparticles to induce cellular toxicity according to an oxidative stress paradigm. Nano Lett. 2006;6:1794–1807. doi: 10.1021/nl061025k. [DOI] [PubMed] [Google Scholar]
- 47.Colvin VI. The potential environmental impact of engineered nanomaterials. Nat Biotechnol. 2003;21:1166–1170. doi: 10.1038/nbt875. [DOI] [PubMed] [Google Scholar]
- 48.Johnston HJ, Hutchison G, Christensen FM, Peters S, Hankin S, Stone V. A review of the in vivo and in vitro toxicity of silver and gold particulates: particle attributes and biological mechanisms responsible for the observed toxicity. Crit Rev Toxicol. 2010;40:328–346. doi: 10.3109/10408440903453074. [DOI] [PubMed] [Google Scholar]
- 49.Roberts RA, Ganey PE, Ju C, Kamendulis LM, Rusyn I, Klaunig JE. Role of kupffer cell in mediating hepatic toxicity and carcinogenesis. Toxicol Sci. 2007;96(1):2–15. doi: 10.1093/toxsci/kfl173. [DOI] [PubMed] [Google Scholar]
- 50.Pratsinis A, Hervells P, Leroux JC, Pratsinis SE, Sotiriou GA. Toxicity of silver nanoparticles in macrophages. Small. 2013;9(15):2576–2584. doi: 10.1002/smll.201202120. [DOI] [PubMed] [Google Scholar]
- 51.Hadrup N, Lam HR. Oral toxicity of silver ions, silver nanoparticles and colloidal silver – a review. Regulatory Toxicol and Pharmacol. 2014;68:1–7. doi: 10.1016/j.yrtph.2013.11.002. [DOI] [PubMed] [Google Scholar]
- 52.Nowack B, Krug HF, Height M. 120 years of nanosilver history: Implications for policy makers. Environ Sci Technol. 2011;45:1177–1183. doi: 10.1021/es103316q. [DOI] [PubMed] [Google Scholar]