Abstract
In every living organism, cell division requires accurate identification of the division site and placement of the division machinery. In bacteria, this process is traditionally considered to begin with the polymerization of the highly conserved tubulin-like protein FtsZ into a ring that locates precisely at midcell1. Over the last decades, several systems have been reported to regulate the spatiotemporal assembly and placement of the FtsZ-ring2-5. However, the human pathogen Streptococcus pneumoniae, as many other organisms, is devoid of these canonical systems and the mechanisms of positioning of the division machinery remain unknown4,6. Here we characterize a novel factor that locates at the division site before FtsZ and guides septum positioning in the pneumococcus. MapZ (Midcell Anchored Protein Z) forms ring structures at the cell equator and moves apart as the cell elongates, therefore behaving as a permanent beacon of division sites. MapZ then positions the FtsZ-ring through direct protein-protein interactions. MapZ-mediated control differs from previously described systems mostly based on negative regulation of FtsZ assembly. Further, MapZ is an endogenous target of the ser/thr-kinase StkP, which was recently shown to play a central role in cytokinesis and morphogenesis of the pneumococcus7-9. We show that both phosphorylated and non-phosphorylated forms of MapZ are required for proper Z-ring formation and dynamics. Altogether, this work uncovers a new mechanism for bacterial cell division that is regulated by phosphorylation and illustrates that nature has evolved a diversity of cell division mechanisms adapted to the different bacterial clades.
Keywords: Streptococci, bacterial cell division, protein phosphorylation, Z-ring regulation
Recently, some membrane Hanks-type Serine/Threonine-kinases10,11 were shown to play a key role in bacterial cell division and morphogenesis12. Streptococcus pneumoniae StkP kinase is crucial for septum assembly, cell shape, localization of peptidoglycan (PG) synthesis7-9. However, the underlying regulatory mechanisms by which StkP exerts its function remain elusive. Here, we uncover the role of one of StkP endogenous targets, Spr0334, a membrane protein of unknown function that shares no sequence similarity with other known proteins13. We named that protein MapZ for Midcell-Anchored Protein Z, based on our observations reported hereafter.
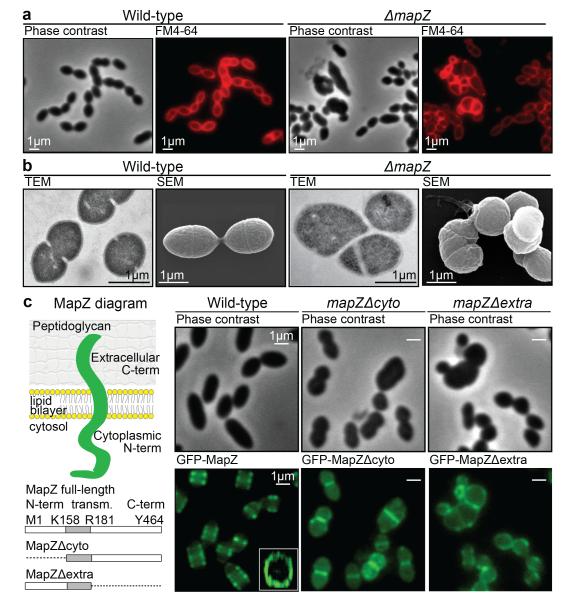
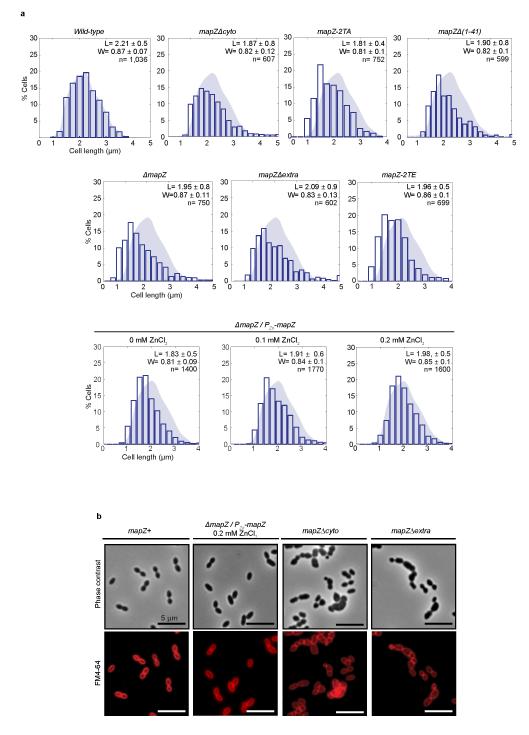
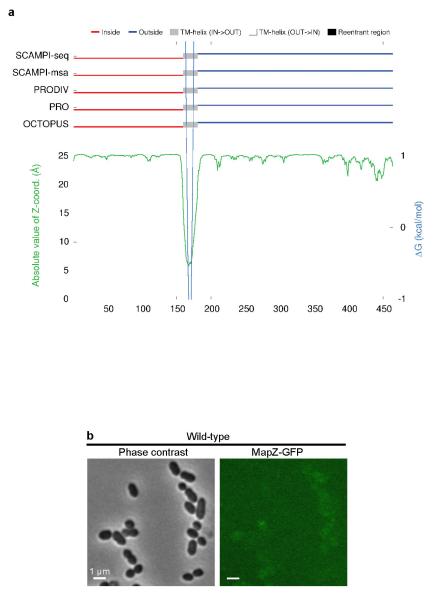
In pneumococcus, mapZ-null mutant (ΔmapZ) exhibits a variety of aberrant cell shapes and sizes that contrast with the wild-type cell morphology (Fig. 1a, Extended Data Fig. 1a). Misshaped ΔmapZ cells have mispositioned division septa and form grape-like clusters as observed by electron microscopy (Fig. 1b). These phenotypes are associated with growth defects reflected by a 48 % increase in generation time and a 30 % decrease in cell viability (Extended Data Table 1). Normal cell shape, viability and growth were restored when mapZ was reinserted into the chromosome (mapZ+) or complemented from an ectopic chromosome locus (ΔmapZ/Pzn-mapZ) (Extended Data Fig. 1, Extended Data Table 1). Bioinformatics analysis14 of MapZ sequence predicts the presence of a single trans-membrane segment separating a cytoplasmic N-terminal domain and an extracellular C-terminal domain (Fig. 1c, Extended Data Fig. 2a). Wide-field microscopy showed that GFP-MapZ (N-terminal fusion) forms rings positioned at midcell and at future division sites (Fig. 1c). Consistent with domain prediction, no fluorescence was detected for MapZ-GFP (extracellular C-terminal fusion) (Extended Fig. 2b). The C-terminal extracellular domain is required for MapZ septal localization as its deletion results in redistribution of MapZ all over the cell membrane, while GFP-MapZΔcyto mostly retained septum localization (Fig. 1c). However, both the intra- and the extracellular domains are required for MapZ cellular function since mapZΔextra and mapZΔcyto strains exhibit morphological and growth defects similar to ΔmapZ (Fig. 1c, Extended Data Fig. 1, Extended Data Table 1).
Figure 1. Characterization of MapZ.
a. Cell shape observed by phase contrast microscopy and after membranes staining with FM4-64. b. Transmission electron microscopy (TEM) and scanning electron microscopy (SEM). c. Diagram of MapZ domains prediction using TOPCONS (http://topcons.net, see methods), with an intracellular N-terminal domain, a transmembrane domain and an extracellular C-terminal domain. Wide-field microscopy images show the localization of GFP-MapZ full-length, GFP-MapZΔcyto and GFP-MapZΔextra deleted for the N-terminal or the C-terminal domain, respectively. Images are representative of experiments made in triplicate.
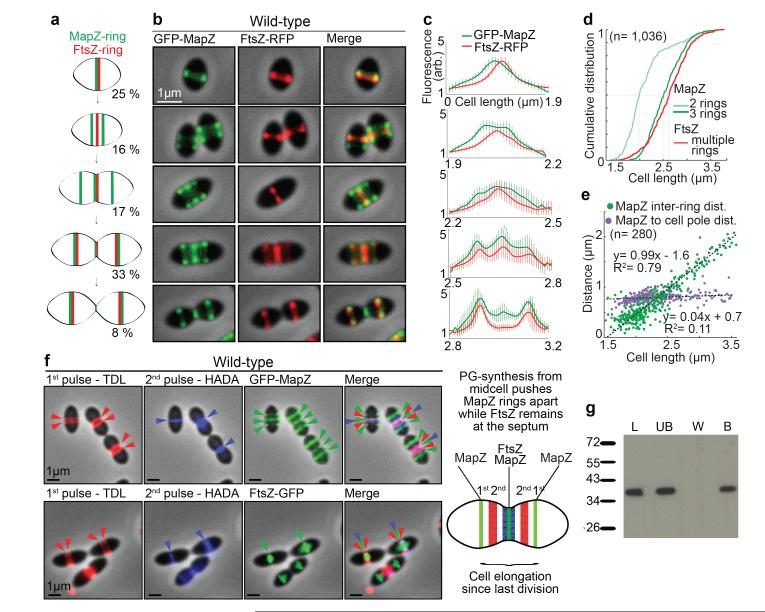
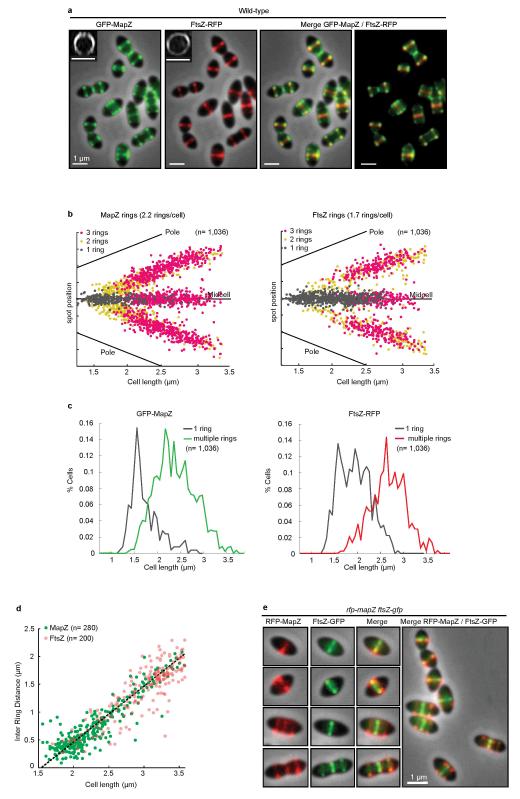
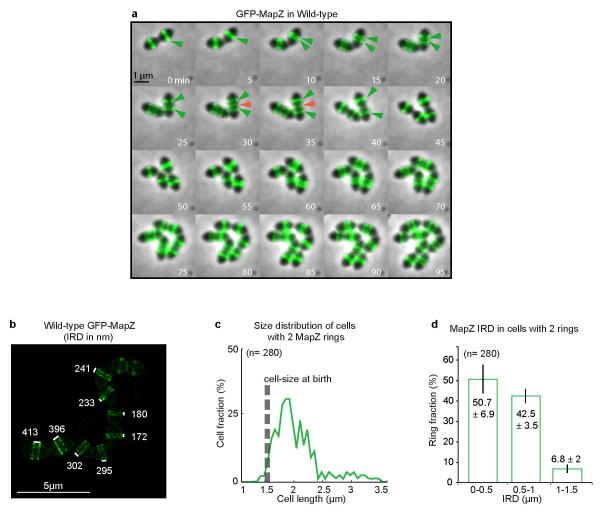
In new-born wild-type cells, MapZ-ring and FtsZ-ring colocalized at midcell (Fig. 2a-c). As cells begin elongating, MapZ-ring splits into two rings while a single FtsZ-ring remains at midcell. At an average cell size of 1.95 μm, 50 % of cells have two MapZ-rings while > 90 % of cells still have one single FtsZ-ring (Fig. 2d). The early and progressive splitting of MapZ was observed in detail by time-lapse (Extended Data Fig. 4a, Supplementary Video 1) and 3D-SIM snapshot microscopy (Extended Data Fig. 4b-d). At a later stage (average cell size of 2.5 μm), appearance of a third MapZ-ring at midcell is shortly followed by splitting of FtsZ into rings that migrate apart until colocalization with MapZ outer rings, at the future division sites (Fig. 2a-d, Extended Data Fig. 3a-b). The midcell MapZ/FtsZ ring constricts and eventually closes (Fig. 2a-c, Extended Data Fig. 3a-c) to complete cytokinesis. Identical MapZ and FtsZ localizations were observed in the rfp-mapZ ftsZ-gfp strain (Extended Data Fig. 3e).
Figure 2. Localization of MapZ and FtsZ in wild-type cells.
a. MapZ and FtsZ-rings positions during growth (with corresponding cell ratios) b. Microscopy of GFP-MapZ and FtsZ-RFP. c. Fluorescence intensities for different cell size categories (error bars show s.d. for 10 cells analysed). d. Cumulative distribution of cells with MapZ or FtsZ-rings. Dash lines show cumulative distribution of 0.5. e. Distance between outer MapZ-rings and between MapZ-rings and the closest pole. Linear fitting curve with equation and R2 value are shown. f. Localization of consecutive peptidoglycan incorporation, TDL first (red) and HADA second (blue), together with GFP-MapZ or FtsZ-GFP. Summary diagram is presented. g. Interaction of MapZ extracellular domain with the cell wall. UB, unbound; W, wash fraction; B, MapZ bound and P, purified MapZ alone. (Sample of n cells analysed). Images are representative of experiments made in triplicate.
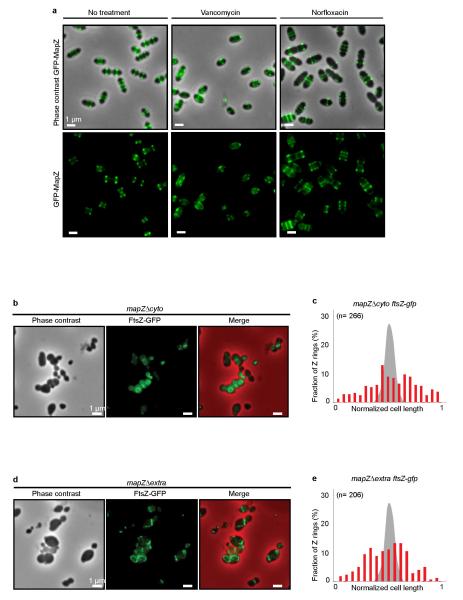
Importantly, the distance between the outer MapZ-rings increased linearly as a function of the cell length, while the distance between MapZ and the cell pole remains constant (Fig. 2e). This suggested that MapZ rings are permanently associated with the future division sites and are mechanically pushed apart as peptidoglycan (PG) synthesis forms the new cell halves. This hypothesis was confirmed by visualizing GFP-MapZ together with PG-synthesis using sequential incorporation of two fluorescently labelled D-amino acids (FDAAs) (15 and Methods). Consistent with previous report16, results showed that PG is incorporated at midcell (Fig. 2f). The last synthetized PG (blue) is pushing the previously incorporated one (red) and both are flanked by MapZ rings, while a single FtsZ-ring is present at midcell (Fig. 2f). The dependence of MapZ positioning on PG-synthesis is further supported by the observation that the extracellular C-terminal domain of MapZ efficiently binds peptidoglycan (Fig. 2g) and that specific inhibition of PG-synthesis using vancomycin led to rapid delocalization of MapZ (Extended Data Fig. 5a).
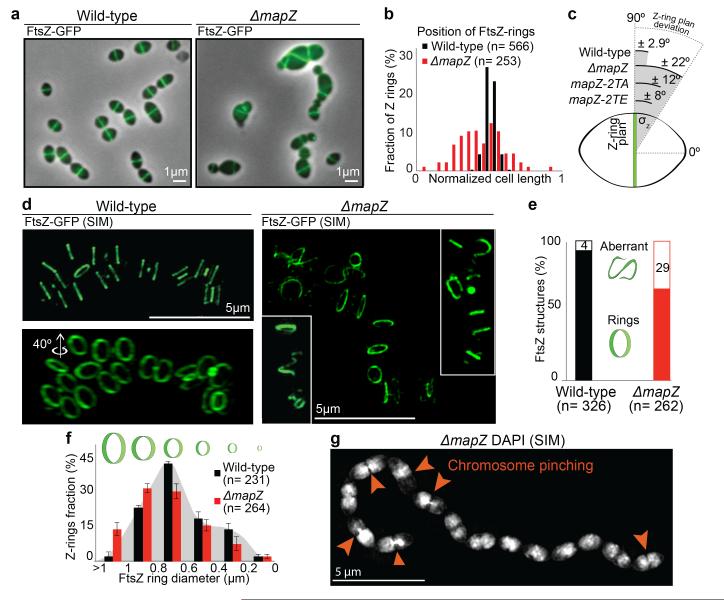
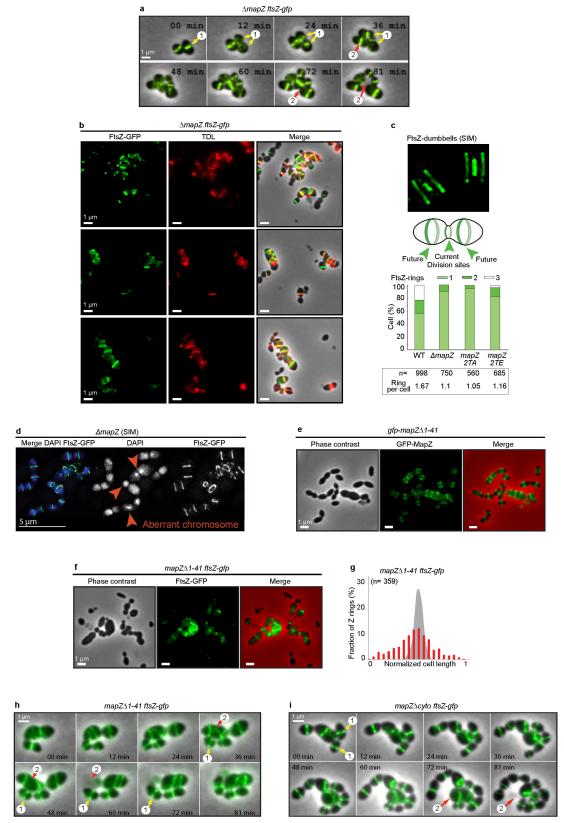
Δ mapZ (Fig. 3a-b), mapZ Δ extra and mapZΔ cyto strains (Extended Data Fig. 5b-e) exhibited severe alteration of FtsZ-rings morphology and localization. FtsZ is unable to position at midcell (Fig. 3b) and the angles of Z-rings with respect to the cell long axis (θz) are incorrect, reflecting inability for FtsZ to find the orthogonal division plan (Fig. 3c). 3D-SIM further revealed major defects of FtsZ structures in ΔmapZ strain (Fig. 3d, compare Supplementary Video 2 and 3). Aberrant ‘non-ring’ FtsZ structures are observed in 29 % of ΔmapZ cells (Fig. 3e). Time-lapse revealed that FtsZ forms polymers that failed positioning correctly and degenerate into aberrant structures, even in cells with yet normal morphology (Extended Data Fig. 6a, compare Supplementary Video 4 and 5). PG-synthesis colocalized with mispositioned FtsZ (Extended Data Fig. 6b), consequently promoting disorderly cell-wall synthesis leading to morphological defects or cell lysis (Extended Data Fig. 6a, Supplementary Video 5). The remaining 71 % cells exhibited an overrepresentation of abnormally large Z-rings in diameter (> 1000 nm) and an underrepresentation of Z-rings < 800 nm (55 % in ΔmapZ compared to 75 % in wild-type) (Fig. 3f). The reduced occurrence of constricting Z-rings and the decrease in cells harbouring FtsZ-dumbbells (Fig. 3d and Extended Data Fig. 6c) suggest a premature closing of the septal Z-ring in ΔmapZ. This is further supported by 3D-SIM imaging of DAPI-stained nucleoids, which revealed a very dense stretch of DNA trapped at the septum in 19 % of ΔmapZ division figures (Fig. 3g, Supplementary Video 6). These chromosome pinching events most probably result from the previously inferred premature closuring of the septum in an organism that lack nucleoid occlusion system4. Perhaps less surprisingly, cells with aberrant FtsZ structures also showed aberrant nucleoid shapes (Extended Data Fig. 6d, Supplementary Video 7). Therefore, not only MapZ is required for correct positioning of the Z-ring but is also involved in regulation of constriction.
Figure 3. FtsZ localization in wild-type and ΔmapZ cells.
a. Localization of FtsZ-GFP. b. Positioning of single FtsZ-rings. c. Deviation of FtsZ-rings angle (θz) (60 cells analysed for each strain; P-value < 2.9e10−2). d. 3D-SIM of FtsZ-rings. e. Fraction of FtsZ-rings or aberrant structures (two-tailed P-value from student t-test was 1.4e10−10). f. FtsZ-rings diameter distribution (error bars show s.d. from three independent experiments; P-value= 1.1e10−3). g. 3D-SIM of ΔmapZ cells after DNA-staining with DAPI. (Sample of n cells analysed). Images are representative of experiments made in triplicate.
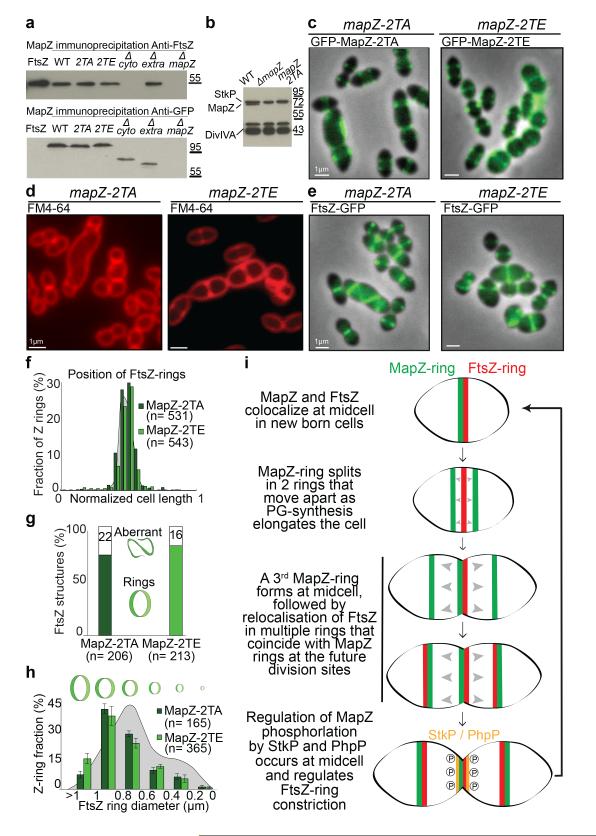
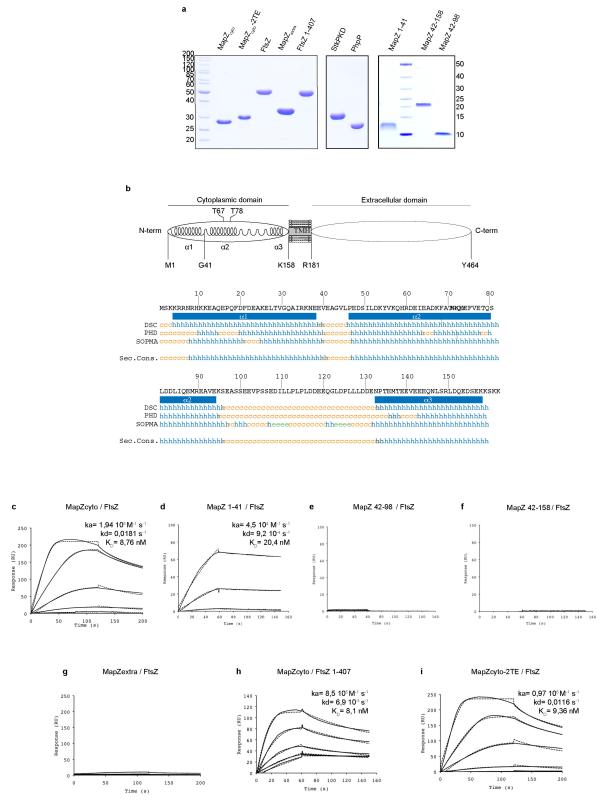
Co-immuno-precipitation revealed in vivo interaction between FtsZ and MapZ, which is mediated by the cytoplasmic domain of MapZ (Fig. 4a). The cytoplasmic domain of MapZ (MapZcyto) strongly interacts with FtsZ (KD= 8.76 nM), more precisely via its N-terminal peptide predicted as an alpha-helix (MapZ(1-41) from Met-1 to Gly-41) (KD= 20.4 nM) (Extended Data Fig. 7a-d). Other parts of the intracellular domain (MapZ(42-98) and MapZ(42-158)) or the extracellular domain (MapZextra) showed no interactions with FtsZ (Extended Data Fig. 7e-g). In vivo deletion of MapZ N-terminal peptide (mapZΔ(1-41)) did not impaired MapZ septal localization (Extended Data Fig. 6e), but resulted in delocalization of FtsZ (Extended Data Fig. 6f-g), which subsequently leads to aberrant cell morphogenesis, asymmetric division or cell lysis (Extended Data Fig. 1a and Fig. 6h, Supplementary Video 8). This was also observed in mapZΔcyto strain (Extended Data Fig. 6i, Supplementary Video 9). Therefore, MapZ direct interaction with FtsZ is strictly required for FtsZ positioning. Surprisingly, the conserved FtsZ C-terminal tail (D408 to R419), which promotes interaction with FtsZ regulators such as FtsA, EzrA, ZipA and SepF in various bacteria17-20, is not required for interaction with MapZ (Extended Data Fig. 7h).
Figure 4. Characterization of MapZ phosphorylation.
a. Immunoprecipitation of GFP-MapZ with FtsZ. Anti-FtsZ (top) or anti-GFP (bottom). b. Westernblot of cell lysates probed with anti-phosphothreonine antibodies show phosphorylation signal for MapZ, DivIVA and StkP. c. Localization of GFP-MapZ-2TA and GFP-MapZ-2TE. d. mapZ-2TA and mapZ-2TE cells after membrane-staining. e. Localization of FtsZ-GFP. f. Positioning of single FtsZ-rings. g. Fraction of cells with FtsZ-rings or aberrant structures (two-tailed P-value from student t-test < 1.54e10−10 for MapZ-2TA and 1.14e10−10 for MapZ-2TE). h. Distribution of FtsZ-rings diameter (two-tailed P-value from student t-test were 2.9e10−4 for MapZ-2TA and 9.9e10−3 for MapZ-2TE). i. Model for MapZ-mediated control of FtsZ positioning. (Sample of n cells analysed). Images are representative of experiments made in triplicate.
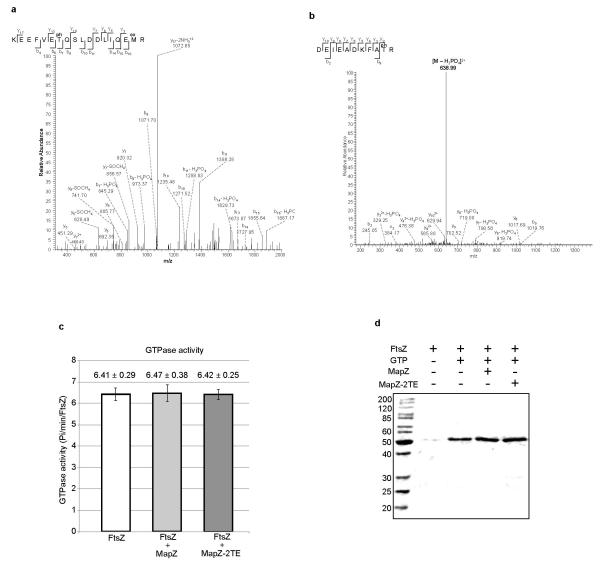
In agreement with previous report13, we confirmed MapZ phosphorylation by analysing the phosphorylation pattern of MapZ mutants (Fig. 4b). Mass spectrometry analysis of MapZ further showed that MapZ is phosphorylated on Thr-67 and Thr-78 (Extended Data Fig. 8a-b). We then constructed two mutants encoding either the phosphoablative form of MapZ (mapZ-2TA) or the phosphomimetic form (mapZ-2TE). mapZ-2TA and mapZ-2TE exhibited cell-shape and viability defects (Fig. 4c-d, Extended Data Table 1 and Extended Data Fig. 1a) although MapZ-2TA and MapZ-2TE retained septal localization (Fig. 4c) and FtsZ-rings were largely well positioned (Fig. 4e-f). Thus, FtsZ positioning by MapZ still occurs properly in mapZ-2TA and mapZ-2TE, consistent with the observation that phosphorylation does not affect interaction with FtsZ in vitro (Fig. 4a, Extended Data Fig. 7i). However, mapZ-2TA and mapZ-2TE showed aberrant FtsZ structures (Fig. 4g), altered Z-ring diameters (Fig. 4h) and reduced number of FtsZ-rings/cell (Fig. 3g). We conclude that both MapZ phosphorylated and dephosphorylated forms and most probably the balance between the two, play a role in the control of FtsZ splitting, stability and constriction, but not positioning.
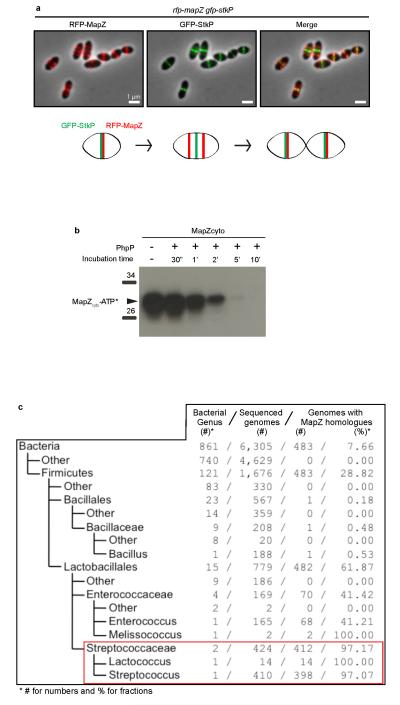
This work uncovers a novel mechanism where a single protein has the dual role of beaconing the division site and positioning the FtsZ-ring (Fig. 4i). Our data are consistent with a model where MapZ is anchored at the cell equator by its extracellular domain, which interacts with the PG. One may hypothesise that MapZ recognizes a PG-structure specific to midcell, such as the equatorial mark visible at the pneumococcal surface (Fig. 1b, SEM in wild-type), reminiscent of the “piecrust” previously reported in S. aureus, S. pneumoniae and Enterococcus faecalis6,21-23. As PG-synthesis forms the new cell halves, MapZ remains permanently associated with the equators, thus providing a simple mechanism to signal the site of division. MapZ intracellular domains on the inner side of the membrane acts as a physical anchor, which positions FtsZ-ring at the division site. Subsequently, MapZ phosphorylation regulates cytokinesis, either through direct regulation of FtsZ or through regulation of other division factors. The fact that MapZ phosphorylation does not occur in the domain that interacts with FtsZ, but in the neighbouring one (Extended Data Fig. 7b), and does not affect FtsZ polymerization or GTPase activity (Extended Data Fig. 8c-d) favours the latter hypothesis. MapZ cyclic phosphorylation/dephosphorylation most probably occurs when MapZ colocalizes with StkP at midcell (Extended Data Fig. 9a) and where the cytoplasmic phosphatase PhpP, which dephosphorylates MapZ (Extended Data Fig. 9b), is enriched7. We further hypothesize that MapZ-mediated recruitment of FtsZ is the event that initiates the assembly of the others division proteins at the septum, including GpsB previously shown9 to be required for septal positioning of StkP and for its ability to phosphorylate it targets. Specifically, orchestrated phosphorylation of DivIVA and MapZ enables coordination between PG- synthesis and control of Z-ring respectively.
MapZ is conserved amongst Streptococcaceae and most of other Lactobacillales (Extended Data Fig. 9C). These organisms are lacking homologues of known FtsZ regulatory systems2-5. Thus, MapZ-mediated mechanism illustrates that pathways of cell division are far more diverse than previously thought in bacteria for they have adapted to the variety of bacterial lifestyles, cell-shapes or developmental behaviours.
METHODS
Strains, Plasmids, Primers and Growth conditions
S. pneumoniae isogenic strains were constructed by transformation in R8008. Standard procedures for chromosomal transformation and growth were used9,24. For growth experiments, Streptococcus pneumoniae strains were cultivated at 37°C in Todd-Hewitt Yeast (THY) broth (Difco). For induction of PZn, ZnCl2 was added at the concentration of 0.2 mM. For construction of S. pneumoniae mutants, transformation was performed as described previously using precompetent cells treated at 37°C with synthetic competence stimulating peptide 1 (CSP 1) to induce competence8,25. For viability assays, several samples of exponentially growing cells were taken every 30 min, diluted appropriately and plated onto THY-agar supplemented with horse blood. After overnight incubation, colony-forming units (CFU) were counted and the percentage of viability of mutant strains was expressed relatively to the WT strain. These experiments were biologically made in triplicates. The Escherichia coli XL1-Blue strain was used as a host for cloning. E. coli BL21(DE3) strain was used as host for overexpression. Strains used in this study are listed in Supplementary Table 1.
Construction of plasmids
DNA fragments coding for MapZ full length, the extracellular domain, the cytoplasmic domain or peptides of MapZ, the kinase domain of StkP, PhpP, and for FtsZ(1-407), were obtained by PCR using chromosomal DNA from S. pneumoniae R800 strain as template and primer pairs 47/48, 39/40, 34/35, 34/36, 37/38, 37/35, 45/46, 41/42, and 43/44, respectively (Supplementary Table 2). DNA fragment coding for the cytoplasmic domain of MapZ with T67-78E mutations was obtained using primer pair 34/35 and mapZ-2TE strain as template (Supplementary Table 1). mapZcyto, mapZcyto-2TE, mapZ(1-41), mapZ(42-98), mapZ(42-158), mapZextra, and phpP were cloned between the NdeI and PstI cloning sites of the pT7-7 plasmid26. ftsZ(1-407) was cloned between the NdeI and BamHI cloning sites of the pETPhos plasmid27. mapZ was cloned between the AgeI and NotI cloning sites of the pCM38 plasmid (Gift from C. Morlot, see Supplementary Table 1). stkPKD was cloned between the BamHI and HindIII cloning sites of the pQE30 plasmid. The nucleotide sequences of all DNA fragments were checked to ensure error-free amplification.
Allelic replacement mutagenesis
To construct pneumococcus mutants (gene deletions, gfp/rfp-fusions or site-directed mutagenesis), we used a two-step procedure, based on a bicistronic kan-rpsL cassette called Janus24. The gene encoding GFP and RFP were from28 and7, respectively. The Janus procedure allows the replacement of a gene by a cassette and subsequent deletion or substitution of the cassette by a mutated allelic form at the gene chromosomal locus. This procedure avoids polar effects and allows a physiological level of expression of GFP and RFP fusions and mutated proteins. Briefly, the Janus cassette is either used to replace the gene of interest or inserted at either its 5′ or 3′-end. Both options confer resistance to kanamycin and dominant streptomycin sensitivity in the wild-type streptomycin-resistant R800 rpsL1 strain (KanR-StrS). Then, any DNA fragments flanked on each end by sequences homologous to the upstream and downstream regions of the gene of interest could be used to transform KanR-StrS strains in order to obtain the expected nonpolar markerless mutant strains KanS-StrR. Once obtained, these markerless transformants were re-streaked to single colonies and correct integration at the chromosomal locus was verified by PCR. Full description of primers used for the construction of strains (supplementary Table 1) is provided in supplementary Table 2.
Protein purification
Recombinant plasmids overproducing MapZcyto, MapZcyto-T67-78E, MapZ(1-41), MapZ(42-98), MapZ(42-158), MapZextra, FtsZ1-407, FtsZ, StkPKD and PhpP were transformed into the BL21(DE3) E. coli strain. Overexpression and purification of StkPKD, and FtsZ and FtsZ1-407 were performed as previously described in8 and29, respectively. MapZ wild-type or mutated domains as well as PhpP were purified using the same procedure than StkPKD. To purify MapZ from S. pneumoniae cells, we used the strain in which mapZ is fused to a DNA fragment encoding for 6 Histidines (Supplementary Table 1) and the procedure previously described 9. We checked that cells grew as the WT cells and displayed proper cell shape.
Peptidoglycan labelling with fluorescent D-amino acids
The procedure used was adapted from15. Briefly, exponentially growing gfp-mapZ or ftsZ-gfp strains (OD550 =0.1) were incubated for 1 min at 37°C in THY with 500 μM of TDL (a fluorescent carboxytetramethylrhodamine derivative of D-alanine). Cells were then washed three times with 1 mL PBS pH 7.4 at RT, incubated again 1 min at 37°C with 500 μM of HADA (a fluorescent hydroxy coumarin derivative of D-alanine) of (OD550=0.1) and washed three times with PBS. For localization of FtsZ together with peptidoglycan synthesis, ΔmapZ ftsZ-gfp cells were grown up to OD550 =0.1 in THY and labelled for 3 min with 500 μM of TDL, and finally washed 3 times with PBS. 0.7 μl of each mixture was then placed on slides and observed under the microscope. These experiments were biologically made in triplicates.
Microscopy techniques
Microscopy was performed on exponentially growing cells (A550 0.1). TEM, SEM, fluorescence and immunofluorescence microscopy were carried out as previously described8. Slides were visualized with a Zeiss AxioObserver Z1 microscope fitted with an Orca-R2 C10600 charge-coupled device (CCD) camera (Hamamatsu) with a 100X NA 1.46 objective. Images were collected with AxioVision (Carl Zeiss). For TEM, cells were examined with a Philips CM120 transmission electron microscope equipped with a Gatan Orius SC200 CCD camera. For SEM, cells were observed with a Quanta 250 FEG (FEI) scanning electron microscope. Time-lapse microscopy was performed as described30 using an automated inverted epifluorescence microscope Nikon Ti-E/B equipped with the perfect focus system (PFS, Nikon) and a phase contrast objective (CFI Plan Fluor DLL 100X oil NA1.3), a Semrock filter set for GFP (Ex: 482BP35; DM: 506; Em: 536BP40), a Nikon Intensilight 130W High-Pressure Mercury Lamp, a monochrome OrcaR2 digital CCD camera (Hamamatsu) and an ImagEM-1K EMCCD camera (Hamamatsu). The microscope is equipped with a chamber thermostated at 30°C. Images were captured every 5 minutes and processed using Nis-Elements AR software (Nikon). All fluorescence images were acquired with a minimal exposure time to minimize bleaching and phototoxicity effects. GFP fluorescence images were false coloured green and overlaid on phase contrast images. Super-resolution 3D-SIM imaging was carried out as previously described31, on a DeltaVision OMX V3 (Applied Precision/GE Healthcare) equipped with a Blaze SIM module, a ×60/1.42 oil UPlanSApo objective (Olympus), 405 nm and 488 nm diode lasers and three sCMOS cameras (PCO). Each 3D-SIM stacks is composed of 225 images (512 × 512 pixels) consisting of 12 z-sections (125 nm z-distance), with 15 images per z-section with the striped illumination pattern32,33 otated to the three angles (-60°, 0°, +60°) and shifted in five phase steps. Acquisition settings were as follows: for FtsZ-GFP, 3 ms exposure with 488 nm laser (attenuated to 100 % transmission); GFP-MapZ, 7 ms exposure with 488 nm laser (attenuated to 100 % transmission); DAPI, 20-30 ms exposure with 405 nm laser (100% transmission). The 3D-SIM raw data was reconstructed with SoftWoRx 6.0 (Applied Precision) using a Wiener filter setting of 0.002 and channel specifically measured optical transfer functions resulting in a lateral (x-y) resolution of 100-130 nm (wavelength dependent) and an axial (z) resolution of ~300. These experiments were technically made in triplicates.
Microscopy image analysis
Snapshot analysis was performed using ImageJ (http://rsb.info.nih.gov/ij/) and the MicrobeTracker suite34 extended by custom MATLAB routines to generate cell length and width distribution histograms, fluorescent intensity linescans, focus positioning dotplots and histograms, cumulative distributions of cells with 1, 2 and 3 rings, plot of IRD (inter ring distance) as a function of cell length. Rings diameter measurements were performed using SoftWoRx 6.0 (Applied Precision). We performed student t-tests statistical analysis of our data using StatPlus plug-in for Excel-Mac (by AnalystSoft), which provided the two-tailed distribution P-values given in the figure legends (with a critical value of 0.05). For the cell length distribution analysis presented in Extended Data Figure 1, a non-parametric statistical analysis was performed, as detailed in 35,36, to take in account the non-normal distribution of cell sizes in the mutants strains analyzed.
Co-immunoprecipitation of FtsZ and GFP-MapZ with anti-GFP antibodies
Cultures of S. pneumoniae cells were grown at 37°C in THY medium until OD550 = 0.4. Cell pellets were incubated at 30 °C first for 30 min in buffer A (0.1 mM Tris-HCl, 2 mM MgCl2, 1 M sucrose, 1:100 Protease Inhibitory Cocktail, 1mg/ml of DNase I and RNase A) and then in buffer B (0.1 mM Tris-HCl, 1mM EDTA, 1 % (v/v) Triton X-100, 1:100 Protease Inhibitory Cocktail, 1mg/mL of DNase I and RNase A) at RT for 15 min. After centrifugation, the supernatant was incubated with the GFP-Trap® resin suspension according to the manufacturer instructions (Chromotech). Protein bound GFP-Trap® resins were eluted with Laemmli buffer at 95 °C for 10 min and analysed by SDS-PAGE. These experiments were biologically and technically made in triplicates.
FtsZ polymerization and GTPase assays
FtsZ polymerization assays were performed as described in29. Briefly, mixtures of 3 μM of FtsZ and 6 μM of MapZ or MapZ-2TA or MapZ-2TE were incubated 15 min at 25°C in a buffer containing 50mM HEPES/NaOH, pH7.2, 50mM KCl,10mM MgCl2, 1mM β-mercaptoethanol. Identical reaction conditions were ensured by compensating varying amounts of proteins with the storage buffer. The solutions were subsequently centrifuged for 15 min at 250 000 × g and 25°C in a Beckman 50.4 Ti rotor using a Beckmann LE80K ultracentrifuge. After immediate withdrawal of the supernatants, pelleted proteins were dissolved in 150 μL SDS sample buffer and incubated for 10 min at 96°C. Fifteen microliters of each sample were then subjected to electrophoresis in a 10 % SDS-polyacrylamide gel. For visualization, gels were stained with Brillant Blue R 250 and scanned. These experiments were technically made in triplicates. GTPase assays were performed following the previously described procedure37. The reaction was performed in a buffer containing 50mM HEPES/NaOH pH 7.5 and 300 mM KCl. Master mixes contained 24 μM of FtsZ and when needed 48 μM of MapZcyto or MapZcyto-2TE.
MapZ in vitro phosphorylation and dephosphorylation
In vitro phosphorylation of MapZcyto by StkPKD was carried out by incubating the reaction mixture (200 μl) containing 50 μg of MapZcyto, 1 μg StkPKD and 25 mM Tris-HCl, pH 7.0, 1 mM DTT, 5 mM MgCl2, 1 mM EDTA, and 10 μM ATP with 5 μCi [γ-32P]ATP (specific activity 3000 Ci/mmol) for 15 min at 37 °C. 20 μl were sampled and mixed with SDS-PAGE loading buffer and heated for 5 min at 100 °C. The remaining mixture was further incubated in the presence of 0.2 μg of purified PhpP and 20 μl aliquots were withdrawn at 30 sec, 1, 2, 5, 10 min and mixed SDS-PAGE loading buffer and heated. After SDS-PAGE analysis, gels were soaked in 16% trichloroacetic acid for 10 min at 90 °C, stained with Coomassie Blue, dried and MapZcyto dephosphorylation was visualized by autoradiography using x-ray films (Kodak BIOMAX-MS). These experiments were technically made in triplicates.
MapZ cell wall binding
Pneumococcal cell wall preparation as well as the procedure used to analysed MapZ binding to cell wall was described in38. Briefly, 2 μg of purified MapZextra were incubated with purified S. pneumoniae cell wall (5 mg) in 100 μl of a buffer containing 50 mM Tris pH 8.0 and 100 mM NaCl for 16 h at 4°C. After centrifugation (5 min at 5000 × g), the supernatant was removed (unbound fraction UB) and the cell wall pellet was washed three times with PBS (wash fraction W) and resuspended in 50 μl SDS-PAGE loading buffer. After incubation at 100°C for 10 min, the supernatant, corresponding to the cell wall bound to MapZ (bound fraction B), was recovered from the cell wall pellet by centrifugation (5 min at 5000 × g). The different fractions were analysed by SDS-PAGE and Western immunoblotting. These experiments were technically made in triplicates.
Immunoblot analysis
In vivo phosphorylated proteins in crude extracts of S. pneumoniae strains were immunodetected using an anti-phosphothreonine polyclonal antibody (Cell Signaling) at 1/2000 as described in8. For FtsZ, immuno-detection was performed using a specific rabbit polyclonal antibody39 used at 1/10000. Detection of GFP fusions was performed using a rabbit anti-GFP (AMS Biotechnology). Detection of MapZextra in cell wall binding assays was performed using a mouse anti-6his antibody (Sigma). A goat anti-rabbit secondary antibody HRP conjugate (Biorad) was used at 1/5000 to reveal the immunoblots, except for the cell wall binding assay where goat anti-mouse secondary antibody HRP conjugate (Biorad) was used at 1/5000. These experiments were biologically and technically made in triplicates.
Nano LC-MS/MS analysis of purified MapZ
Purified MapZ was in gel digested using trypsin as described elsewhere40. Peptide mixture was either analysed directly by LC-MS/MS after being desalted using C18 StageTips41 or was subjected to phosphopeptide enrichment by titanium dioxide chromatography as described previously42 with the following modifications: phosphopeptide elution from the beads was performed three times with 100 ml 40% ammonia hydroxide solution in 60% acetonitrile at a pH of >10.5. Analysis of peptides and phosphopeptides was done on a Proxeon Easy-LC system (Proxeon Biosystems) either coupled to an LTQ-Orbitrap-Elite or to an LTQ-Orbitrap-XL mass spectrometer (Thermo Fisher Scientific) equipped with a nanoelectrospray ion source (Proxeon Biosystems) as described previously43. The mass spectrometer was operated in the positive ion mode with the following acquisition cycle: one initial full scan in the Orbitrap analyzer (MS) was followed by fragmentation through rapid collision induced dissociation (CID) of the 20 most intense multiply charged precursor ions in the linear ion trap analyzer (LTQ Elite), or 5 most intense precursor ions (LTQ XL). Here multi stage activation (MSA) was applied in all MS/MS events when a neutral loss event was detected on the precursor ions depending on their charge state: singly (-97.97 Th), doubly (-48.99 Th) and triply (-32.66 Th). Mass spectra were analysed using the software suite MaxQuant, version 1.0.14.344. The data were searched against a target-decoy Streptococcus pneumoniae database including the His-tagged sequence of MapZ (35,203 entries) and 262 commonly observed protein contaminants. Trypsin was set as protease and two missed cleavage sites were allowed. Acetylation at the N-terminus, oxidation of methionine and phosphorylation on serine, threonine, and tyrosine were set as variable modifications. Carbamidomethylation of cysteine was set as fixed modification. Initial precursor mass tolerance was set to 7 parts per million (ppm) at the precursor ion level and 0.5 Da at the fragment ion level. Phosphorylation events with a localization probability of at least 0.75 were considered to be assigned to a specific residue. Spectra of modified peptides were manually validated.
Surface Plasmon Resonance
Real time binding experiments were performed on a BIAcore T100 biosensor system (GE Healthcare). FtsZ and FtsZ1-407 were covalently coupled through its amino groups to the surface of a CM5 sensorchip according to the manufacturer’s instructions. Increasing concentrations (0.01, 0.02, 0.05, 0.1, 0.2 and 0.5 μM from bottom to top) of MapZcyto, MapZ(1-41), MapZ(42-98), MapZ(42-158), MapZextra and MapZcyto-2TE were injected over the surface of the sensorchip at a flow rate of 30 μL/min in 10 mM HEPES pH 7.4, 150 mM NaCl, 0,005% surfactant P20. For all experiments, aspecific binding to the surface of the sensorchip was subtracted by injection of the analytes over a mocked derivatized sensorchip. The resulting sensorgrams were analysed using BIAevaluation software (GE Healthcare) according to a 1:1 model of interaction to determine the kinetic constants. The goodness of the fit was assessed by inspecting the χ2 values and the random distribution of the residuals. These experiments were technically made in triplicates.
MapZ sequence analysis and search of MapZ in bacterial genomes
MapZ topology was predicted using TOPSCONS (http://topcons.net)14 and secondary structure prediction of MapZcyto has been computed using the Network Protein Sequence Analysis (NPSA) (http://npsa-pbil.ibcp.fr) using DSC, PHD and SOPMA methods45. MapZ sequences were extracted from UniProtKB46 complete bacteria genomes by means of ggsearch version 36.3.5c47 with UniProtKB/Swiss-Prot:Q8DR55 as the query sequence. A multiple sequence alignment was computed with MUSCLE v3.8.3148 with the 66 extracted sequences. Then, a profile HMM was built with hmmbuild program of the HMMER 3.0 package49. The predicted proteins of the 6,305 bacterial genomes from Ensemble Genomes release50 were searched with the hmmsearch program and the built profile. Subject sequences were extracted from matches found thanks to a in-house java program if they observe the following conditions: E-value <= 1e-24 and length between 350 and 650 amino-acids.
Extended Data
Extended Data Figure 1. Cell-shape analysis of wild-type and mapZ mutants strains.
a. Cell length distribution of wild-type, ΔmapZ, mapZ-2TA, mapZ-2TE, mapZΔcyto, mapZΔextra and mapZΔ(1-41) strains, as well as for ΔmapZ/PZn-mapZ in presence of 0, 0.1 or 0.2 mM of ZnCl2 inducer. Average cell length (L) and width (W) are given with standard deviations for a total of n cells analysed from three independent experiments. For these samples, the two-tailed t distribution P-value determined using non-parametric statistical test was <1.59 10−2, for a critical value of 0.05. b. Phase contrast microscopy and FM4-64 membrane staining imaging of mapZ+ cells (mapZ is restored at the chromosomal locus in ΔmapZ), ΔmapZ/PZn-mapZ (ΔmapZ cells complemented ectopically with PZn-mapZ), mapZΔcyto and mapZΔextra cells. Images are representative of experiments made in triplicate.
Extended Data Figure 2. Prediction of MapZ topology.
a. MapZ topology (i.e. specification of the membrane spanning segments and their IN/OUT orientation relative to the membrane) was predicted by five different topology algorithms (SCAMPI-seq, SACAMPI-msa, PRODIV-TMHMM, PRO-TMHMM and OCTOPUS) using TOPCONS (http://topcons.net). ZPRED (green line) predicts the distance to the membrane centre of each amino acid and ΔG-scale (light blue) shows the predicted free energy of membrane insertion for a window of 21 amino acids centred around each position in the sequence. The trans-membrane span is indicated in grey. Prediction of cytoplasmic and extracellular localizations are shown in red and dark blue, respectively. b. Wide-field microscopy images of cells producing the C-terminal fusion of MapZ with GFP. GFP fluorescence (right panel) and Phase contrast images (left panel). Images are representative of experiments made in triplicate.
Extended Data Figure 3. Localization of MapZ and FtsZ in wild-type cells.
a. Microscopy images of GFP-MapZ and FtsZ-RFP in wild-type cells. Inserts images show 3D-SIM orthogonal views of MapZ and FtsZ rings. b. Localization dotplots of MapZ-rings and FtsZ-rings position along the cell length in wild-type cells. c. Ratio of cells with single or multiple MapZ-rings and FtsZ-rings as a function of cell length. Panel b and c show data derived from analysis of 1,036 cells (n indicates the number of cells analysed in each panel). d. Distance between MapZ outer rings compared to distance between FtsZ outer rings as a function of cell length. e. Same as Fig. 2b but after swapping the GFP and RFP fluorescent protein labels. Indicative images showing MapZ, FtsZ, or both MapZ and FtsZ signal are shown for rfp-mapZ ftsZ-gfp cells at four different cell cycle stages. A wide-field view is also shown. Images are representative of experiments made in triplicate.
Extended Data Figure 4. Early splitting of MapZ rings during elongation of wild-type cells.
a. Time-lapse images of GFP-MapZ dynamics during cell growth and division showing progressive separation of the outer rings (green arrow) and appearance of a 3rd midcell ring (red arrow) (similar to Supplementary Video 1). Time is given in minutes. b. 3D-SIM images showing the very early stages of MapZ separation in the first stages of cell elongation. The numbers correspond to the inter-ring distance (IRD) in nm. c. Cell size distribution of cells with two MapZ rings reveals splitting of MapZ in the early stages of cells elongation. d. Distribution of IRD in cells with two MapZ rings (error bars show standard deviations from three experiments). Panel c and d show data derived from analysis of 280 cells (n indicates the number of cells analysed in each panel). Images are representative of experiments made in triplicate.
Extended Data Figure 5. MapZ position depends on PG-synthesis and FtsZ position depends on MapZ functionality.
a. Localization of MapZ after inhibition of PG-synthesis in Wild-type pneumococcus. Microscopy images of GFP-MapZ in wild-type cells before (top), and 15 minutes after addition of vancomycin (middle) or norfloxacin (bottom). Vancomycin, which inhibits PG-synthesis impairs localization of GFP-MapZ, while norfloxacin, which inhibits topoisomerases, has no effect on MapZ septal localization. b. Localization of FtsZ-GFP in mapZΔcyto and c. corresponding FtsZ-GFP rings positioning along the cell length normalized to 1. d. Localization of FtsZ-GFP in mapZΔextra and e. corresponding FtsZ-GFP rings positioning along the cell length normalized to 1. Images are representative of experiments made in triplicate.
Extended Data Figure 6. FtsZ is mispositioned in ΔmapZ cells and colocalizes with PG-synthesis.
a. Time-lapse images of FtsZ-GFP (green) dynamics in ΔmapZ cells. FtsZ polymers fail positioning correctly even in cells with normal shape (arrow 1), resulting in asymmetric cell division or cell lysis (arrow 2) (stills correspond to Supplementary Video 5). b. Microscopy images showing colocalization of PG-synthesis revealed by pulse labelling with TDL (red) and mispositioned FtsZ-GFP structures (green) in ΔmapZ cells. Three fields of view from three independent experiments are shown. c. 3D-SIM and schematic of FtsZ-dumbbells with histograms of the cell ratios with 1, 2 or 3 rings. The average number of rings per cell is shown. d. 3D-SIM image of DAPI-stained DNA and FtsZ-GFP in ΔmapZ cells. e. Localization of GFP-MapZΔ(1-41) in gfp-mapZΔ(1-41). f. Localization of FtsZ-GFP in mapZΔ(1-41). g. corresponding FtsZ-GFP rings positioning along the cell length normalized to 1. h and i. Time-lapse images of FtsZ-GFP (green) dynamics in mapZΔ(1-41) cells (h) and mapZΔcyto (i). FtsZ mispositioning, even in cells with normal shape leads to asymmetric cell division (arrow 1) or cell lysis (arrow 2). Images are representative of experiments made in triplicate.
Extended Data Figure 7. Purification of FtsZ and MapZ and analysis of the interactions.
a. Purification of proteins used in SPR experiments. MapZ cytoplasmic domain, MapZ-2TE cytoplasmic domain, FtsZ, MapZ extracellular domain, FtsZ1-407 fragment (FtsZ deleted from the C-terminal α-helix), StkP cytoplasmic domain, PhpP, MapZ N-terminal peptide from Met-1 to Gly-41, MapZ peptide from Val-42 to Ser-98 and MapZ peptide from Val-42 to Lys-158 were overproduced in E. coli BL21 and analysed by SDS-PAGE. b. Schematic model of MapZ and secondary structure prediction of the cytoplasmic domain of MapZ. Secondary structure codes e, c and h indicate predicted alpha helices (blue), random coils (orange) and extended strands (green), respectively. c-e. Surface Plasmon Resonance (SPR) analyses of interaction between FtsZ and MapZ. Full length FtsZ (c, d, e, f, g and i) or FtsZ1-407 (h) was covalently coupled to the surface of a CM5 sensorchip. Increasing amounts of either MapZ cytoplasmic domain (c and h), MapZ extracellular domain (g), MapZ-2TE (i) cytoplasmic domain, MapZ(1-41) (d), MapZ(42-98) (e) and MapZ(42-158) (f) peptides were injected onto the FtsZ- or FtsZ1-407-coupled sensorship. RU: resonance units. The measurements were made in triplicate. The affinity (KD), association (ka) and dissociation constants (kd) are indicated. Images are representative of experiments made in triplicate.
Extended Data Figure 8. Analysis of MapZ in vivo phosphorylation and impact on FtsZ GTPase activity and polymerization.
MapZ is phosphorylated on threonine 67 (a) and threonine 78 (b). The spectra shows the fragmentation pattern of the phosphopeptides DEIEADKFAT(ph)R corresponding to amino acids 58-68 and KEEFVET(ph)QSLDDLIQEM(ox)R corresponding to amino acids 72-89. c. Influence of MapZ and MapZ-2TE cytoplasmic domains on FtsZ GTPase activity. Purified FtsZ was incubated with GTP either alone or in the presence of MapZ or MapZ-2TE cytoplasmic domains and free phosphate was revealed using malachite green colour development. Standard deviations are shown for 3 independent experiments. d. FtsZ polymerization in the presence of MapZcyto, wild-type or mutated, cytoplasmic domains. FtsZ was incubated in the presence or absence of GTP and either MapZ or MapZ-2TE. The samples were then processed as described in the Materials and Methods section. Images are representative of experiments made in triplicate.
Extended Data Figure 9. Interplay between MapZ and StkP and PhpP and conservation of MaZ in bacterial genomes.
a. Simultaneous localization of GFP-StkP and RFP-MapZ in wild-type cells. Overlays between GFP (green), RFP (red) and phase contrast shows that StkP locates at midcell while MapZ rings separation proceeds, as depicted in the summary diagram below. b. Dephosphorylation of MapZ by PhpP. MapZ cytoplasmic domain was phosphorylated by StkPKD and then incubated for various times (30 sec to 10 min) with the protein phosphatase PhpP. MapZ dephosphorylation was analysed by autoradiography. c. Conservation analysis of mapZ homologues in 6,305 bacterial genomes. The left panel shows the taxonomy of the bacterial superkingdom. The right panel indicates the number of genus, the number of sequenced genomes, the number of genomes coding for MapZ homologous proteins and the percentage of genomes coding for MapZ homologous proteins respectively. Images are representative of experiments made in triplicate.
Extended Data Table 1. Strains viability and generation time.
| Strains | Viabilitya (%) | Generation timeb (min) |
|---|---|---|
| WT | 100 | 32 ± 3 |
| ΔmapZ | 70.3 ± 0,7 | 48 ± 2 |
| mapZ-2TA | 87 ± 2,7 | 31 ± 3 |
| mapZ-2TE | 95.8 ± 2,9 | 33 ± 2 |
| mapZ+ | 97.9±1.1 | 35±2 |
| ΔmapZ / Pzn-mapZ (no ZnCl2) | 78.6 ± 1.2 | 40 ± 2 |
| ΔmapZ / Pzn-mapZ (0.1 mM ZnCl2) | 84 ± 2.1 | 39 ± 3 |
| ΔmapZ / Pzn-mapZ (0.2 mM ZnCl2) | 89.5 ± 1.3 | 34.8 ± 2 |
| ftsZ-gfp | 96.9 ± 4,3 | 34 ± 6 |
| gfp-mapZ | 95 ± 5 | 28 ± 3 |
| mapZΔcyto | 73.4 ± 2,7 | 46 ± 3 |
| mapZΔ(l-41) | 80.4 ± 1.3 | 36 ± 3 |
| mapZΔextra | 73.7 ± 0,8 | 49 ± 5 |
Colony forming unit per millilitre (CFU/mL) estimated by plating and normalized to that of wild-type strain. Standard deviations are shown for 3 independent experiments.
Time required for doubling of the optical density OD650 in liquid culture. Standard deviations are shown for 3 independent experiments.
Supplementary Material
ACKNOWLEDGMENTS
This work was supported by grants from the CNRS, the University of Lyon, the FINOVI foundation, the Agence National de la Recherche (ANR-12-BSV3-0008-01) and the Region Rhône-Alpes (ARC1 and financial support for A.F (Cluster 10) and C.Z. (CMIRA)). C.L was supported by a Wellcome Trust Programme Grant to D.J.S. (WT083469MA), advanced microscopy at Micron Oxford by a Wellcome Trust Strategic Award (091911), and Y.V.B by National Institutes of Health Grant (GM051986). We acknowledge the contribution of the PLATIM and the Protein Science facilities of the SFR Biosciences Gerland-Lyon Sud (UMS344/US8) and the Centre Technologique des Microstructures de l’Université Lyon I. We thank Christophe Chamot for technical assistance in microscopy, Stephan Uphoff and Jakub Wiktor for providing help with Matlab and Anne-Marie Di Guilmi for providing us with the antibody against pneumococcal FtsZ. We thank Nathalie Campo, Nelly Dubarry and Jean-Pierre Claverys for stimulating discussions and critical reading of the manuscript. Nathalie Campo is also thanked for her help with time-lapse microscopy.
Footnotes
SUPPLEMENTARY INFORMATION is available in the online version of the paper.
AUTHOR INFORMATION
Author Information Reprints and permissions information is available at www.nature.com/reprints.
The authors declare no competing financial interests.
REFERENCES
- 1.Adams DW, Errington J. Bacterial cell division: assembly, maintenance and disassembly of the Z ring. Nat Rev Microbiol. 2009;7:642–653. doi: 10.1038/nrmicro2198. doi:10.1038/nrmicro2198. [DOI] [PubMed] [Google Scholar]
- 2.Bramkamp M, van Baarle S. Division site selection in rod-shaped bacteria. Curr Opin Microbiol. 2009;12:683–688. doi: 10.1016/j.mib.2009.10.002. doi:10.1016/j.mib.2009.10.002. [DOI] [PubMed] [Google Scholar]
- 3.Wu LJ, Errington J. Nucleoid occlusion and bacterial cell division. Nat Rev Microbiol. 2012;10:8–12. doi: 10.1038/nrmicro2671. doi:10.1038/nrmicro2671. [DOI] [PubMed] [Google Scholar]
- 4.Pinho MG, Kjos M, Veening JW. How to get (a)round: mechanisms controlling growth and division of coccoid bacteria. Nat Rev Microbiol. 2013;11:601–614. doi: 10.1038/nrmicro3088. doi:10.1038/nrmicro3088. [DOI] [PubMed] [Google Scholar]
- 5.Monahan LG, Harry EJ. Identifying how bacterial cells find their middle: a new perspective. Mol Microbiol. 2013;87:231–234. doi: 10.1111/mmi.12114. doi:10.1111/mmi.12114. [DOI] [PubMed] [Google Scholar]
- 6.Monahan LG, Liew ATF, Bottomley AL, Harry EJ. Division site positioning in bacteria: one size does not fit all. Frontiers in Microbiology. 2014;5 doi: 10.3389/fmicb.2014.00019. doi:10.3389/fmicb.2014.00019. [DOI] [PMC free article] [PubMed] [Google Scholar]
- 7.Beilharz K, et al. Control of cell division in Streptococcus pneumoniae by the conserved Ser/Thr protein kinase StkP. Proceedings of the National Academy of Sciences of the United States of America. 2012;109:E905–913. doi: 10.1073/pnas.1119172109. doi:10.1073/pnas.1119172109. [DOI] [PMC free article] [PubMed] [Google Scholar]
- 8.Fleurie A, et al. Mutational dissection of the S/T-kinase StkP reveals crucial roles in cell division of Streptococcus pneumoniae. Mol Microbiol. 2012;83:746–758. doi: 10.1111/j.1365-2958.2011.07962.x. doi:10.1111/j.1365-2958.2011.07962.x. [DOI] [PubMed] [Google Scholar]
- 9.Fleurie A, et al. Interplay of the serine/threonine-kinase StkP and the paralogs DivIVA and GpsB in pneumococcal cell elongation and division. PLoS genetics. 2014;10:e1004275. doi: 10.1371/journal.pgen.1004275. doi:10.1371/journal.pgen.1004275. [DOI] [PMC free article] [PubMed] [Google Scholar]
- 10.Hanks SK, Quinn AM, Hunter T. The protein kinase family: conserved features and deduced phylogeny of the catalytic domains. Science. 1988;241:42–52. doi: 10.1126/science.3291115. [DOI] [PubMed] [Google Scholar]
- 11.Kannan N, Taylor SS, Zhai Y, Venter JC, Manning G. Structural and functional diversity of the microbial kinome. PLoS Biol. 2007;5:e17. doi: 10.1371/journal.pbio.0050017. doi:10.1371/journal.pbio.0050017. [DOI] [PMC free article] [PubMed] [Google Scholar]
- 12.Pereira SF, Goss L, Dworkin J. Eukaryote-like serine/threonine kinases and phosphatases in bacteria. Microbiol Mol Biol Rev. 2011;75:192–212. doi: 10.1128/MMBR.00042-10. doi:10.1128/MMBR.00042-10. [DOI] [PMC free article] [PubMed] [Google Scholar]
- 13.Novakova L, et al. Identification of multiple substrates of the StkP Ser/Thr protein kinase in Streptococcus pneumoniae. J Bacteriol. 2010;192:3629–3638. doi: 10.1128/JB.01564-09. doi:10.1128/JB.01564-09. [DOI] [PMC free article] [PubMed] [Google Scholar]
- 14.Bernsel A, Viklund H, Hennerdal A, Elofsson A. TOPCONS: consensus prediction of membrane protein topology. Nucleic Acids Res. 2009;37:W465–468. doi: 10.1093/nar/gkp363. doi:10.1093/nar/gkp363. [DOI] [PMC free article] [PubMed] [Google Scholar]
- 15.Kuru E, et al. In Situ probing of newly synthesized peptidoglycan in live bacteria with fluorescent D-amino acids. Angew Chem Int Ed Engl. 2012;51:12519–12523. doi: 10.1002/anie.201206749. doi:10.1002/anie.201206749. [DOI] [PMC free article] [PubMed] [Google Scholar]
- 16.Daniel RA, Errington J. Control of cell morphogenesis in bacteria: two distinct ways to make a rod-shaped cell. Cell. 2003;113:767–776. doi: 10.1016/s0092-8674(03)00421-5. [DOI] [PubMed] [Google Scholar]
- 17.Ma X, Margolin W. Genetic and functional analyses of the conserved Cterminal core domain of Escherichia coli FtsZ. J Bacteriol. 1999;181:7531–7544. doi: 10.1128/jb.181.24.7531-7544.1999. [DOI] [PMC free article] [PubMed] [Google Scholar]
- 18.Singh JK, Makde RD, Kumar V, Panda D. A membrane protein, EzrA, regulates assembly dynamics of FtsZ by interacting with the C-terminal tail of FtsZ. Biochemistry. 2007;46:11013–11022. doi: 10.1021/bi700710j. doi:10.1021/bi700710j. [DOI] [PubMed] [Google Scholar]
- 19.Haney SA, et al. Genetic analysis of the Escherichia coli FtsZ.ZipA interaction in the yeast two-hybrid system. Characterization of FtsZ residues essential for the interactions with ZipA and with FtsA. J Biol Chem. 2001;276:11980–11987. doi: 10.1074/jbc.M009810200. doi:10.1074/jbc.M009810200. [DOI] [PubMed] [Google Scholar]
- 20.Krol E, et al. Bacillus subtilis SepF binds to the C-terminus of FtsZ. PLoS One. 2012;7:e43293. doi: 10.1371/journal.pone.0043293. doi:10.1371/journal.pone.0043293. [DOI] [PMC free article] [PubMed] [Google Scholar]
- 21.Wheeler R, Mesnage S, Boneca IG, Hobbs JK, Foster SJ. Super-resolution microscopy reveals cell wall dynamics and peptidoglycan architecture in ovococcal bacteria. Mol Microbiol. 2011;82:1096–1109. doi: 10.1111/j.1365-2958.2011.07871.x. doi:10.1111/j.1365-2958.2011.07871.x. [DOI] [PubMed] [Google Scholar]
- 22.Tomasz A, Jamieson JD, Ottolenghi E. The Fine Structure of Diplococcus Pneumoniae. J Cell Biol. 1964;22:453–467. doi: 10.1083/jcb.22.2.453. [DOI] [PMC free article] [PubMed] [Google Scholar]
- 23.Higgins ML, Shockman GD. Model for cell wall growth of Streptococcus faecalis. J Bacteriol. 1970;101:643–648. doi: 10.1128/jb.101.2.643-648.1970. [DOI] [PMC free article] [PubMed] [Google Scholar]
- 24.Sung CK, Li H, Claverys JP, Morrison DA. An rpsL cassette, janus, for gene replacement through negative selection in Streptococcus pneumoniae. Appl Environ Microbiol. 2001;67:5190–5196. doi: 10.1128/AEM.67.11.5190-5196.2001. doi:10.1128/AEM.67.11.5190-5196.2001. [DOI] [PMC free article] [PubMed] [Google Scholar]
- 25.Martin B, Prudhomme M, Alloing G, Granadel C, Claverys JP. Crossregulation of competence pheromone production and export in the early control of transformation in Streptococcus pneumoniae. Mol Microbiol. 2000;38:867–878. doi: 10.1046/j.1365-2958.2000.02187.x. [DOI] [PubMed] [Google Scholar]
- 26.Cortay JC, et al. In vitro asymmetric binding of the pleiotropic regulatory protein, FruR, to the ace operator controlling glyoxylate shunt enzyme synthesis. J Biol Chem. 1994;269:14885–14891. [PubMed] [Google Scholar]
- 27.Canova MJ, Kremer L, Molle V. pETPhos: a customized expression vector designed for further characterization of Ser/Thr/Tyr protein kinases and their substrates. Plasmid. 2008;60:149–153. doi: 10.1016/j.plasmid.2008.05.002. doi:10.1016/j.plasmid.2008.05.002. [DOI] [PubMed] [Google Scholar]
- 28.Martin B, et al. Expression and maintenance of ComD-ComE, the two-component signal-transduction system that controls competence of Streptococcus pneumoniae. Mol Microbiol. 2010;75:1513–1528. doi: 10.1111/j.1365-2958.2010.07071.x. doi:10.1111/j.1365-2958.2010.07071.x. [DOI] [PubMed] [Google Scholar]
- 29.Thanbichler M, Shapiro L. MipZ, a spatial regulator coordinating chromosome segregation with cell division in Caulobacter. Cell. 2006;126:147–162. doi: 10.1016/j.cell.2006.05.038. doi:10.1016/j.cell.2006.05.038. [DOI] [PubMed] [Google Scholar]
- 30.de Jong IG, Beilharz K, Kuipers OP, Veening JW. Live Cell Imaging of Bacillus subtilis and Streptococcus pneumoniae using Automated Time-lapse Microscopy. J Vis Exp. 2011 doi: 10.3791/3145. doi:10.3791/3145. [DOI] [PMC free article] [PubMed] [Google Scholar]
- 31.Lesterlin C, Ball G, Schermelleh L, Sherratt DJ. RecA bundles mediate homology pairing between distant sisters during DNA break repair. Nature. 2013 doi: 10.1038/nature12868. doi:10.1038/nature12868. [DOI] [PMC free article] [PubMed] [Google Scholar]
- 32.Schermelleh L, et al. Subdiffraction multicolor imaging of the nuclear periphery with 3D structured illumination microscopy. Science. 2008;320:1332–1336. doi: 10.1126/science.1156947. doi:10.1126/science.1156947. [DOI] [PMC free article] [PubMed] [Google Scholar]
- 33.Gustafsson MG, et al. Three-dimensional resolution doubling in wide-field fluorescence microscopy by structured illumination. Biophys J. 2008;94:4957–4970. doi: 10.1529/biophysj.107.120345. doi:10.1529/biophysj.107.120345. [DOI] [PMC free article] [PubMed] [Google Scholar]
- 34.Sliusarenko O, Heinritz J, Emonet T, Jacobs-Wagner C. High-throughput, subpixel precision analysis of bacterial morphogenesis and intracellular spatiotemporal dynamics. Mol Microbiol. 2011;80:612–627. doi: 10.1111/j.1365-2958.2011.07579.x. doi:10.1111/j.1365-2958.2011.07579.x. [DOI] [PMC free article] [PubMed] [Google Scholar]
- 35.Krzywinski M, Altman N. Points of significance: Significance, P values and ttests. Nat Methods. 2013;10:1041–1042. doi: 10.1038/nmeth.2698. doi:10.1038/nmeth.2698. [DOI] [PubMed] [Google Scholar]
- 36.Krzywinski M, Altman N. Points of significance: Importance of being uncertain. Nat Methods. 2013;10:809–810. doi: 10.1038/nmeth.2613. doi:10.1038/nmeth.2613. [DOI] [PubMed] [Google Scholar]
- 37.Krol E, Scheffers DJ. FtsZ polymerization assays: simple protocols and considerations. J Vis Exp. 2013:e50844. doi: 10.3791/50844. doi:10.3791/50844. [DOI] [PMC free article] [PubMed] [Google Scholar]
- 38.Morlot C, et al. Interaction of Penicillin-Binding Protein 2x and Ser/Thr protein kinase StkP, two key players in Streptococcus pneumoniae R6 morphogenesis. Mol Microbiol. 2013;90:88–102. doi: 10.1111/mmi.12348. doi:10.1111/mmi.12348. [DOI] [PubMed] [Google Scholar]
- 39.Morlot C, Zapun A, Dideberg O, Vernet T. Growth and division of Streptococcus pneumoniae: localization of the high molecular weight penicillinbinding proteins during the cell cycle. Mol Microbiol. 2003;50:845–855. doi: 10.1046/j.1365-2958.2003.03767.x. [DOI] [PubMed] [Google Scholar]
- 40.Borchert N, et al. Proteogenomics of Pristionchus pacificus reveals distinct proteome structure of nematode models. Genome Res. 2010;20:837–846. doi: 10.1101/gr.103119.109. doi:10.1101/gr.103119.109. [DOI] [PMC free article] [PubMed] [Google Scholar]
- 41.Rappsilber J, Mann M, Ishihama Y. Protocol for micro-purification, enrichment, pre-fractionation and storage of peptides for proteomics using StageTips. Nat Protoc. 2007;2:1896–1906. doi: 10.1038/nprot.2007.261. doi:10.1038/nprot.2007.261. [DOI] [PubMed] [Google Scholar]
- 42.Olsen JV, et al. Parts per million mass accuracy on an Orbitrap mass spectrometer via lock mass injection into a C-trap. Molecular & cellular proteomics : MCP. 2005;4:2010–2021. doi: 10.1074/mcp.T500030-MCP200. doi:10.1074/mcp.T500030-MCP200. [DOI] [PubMed] [Google Scholar]
- 43.Franz-Wachtel M, et al. Global detection of protein kinase D-dependent phosphorylation events in nocodazole-treated human cells. Molecular & cellular proteomics : MCP. 2012;11:160–170. doi: 10.1074/mcp.M111.016014. doi:10.1074/mcp.M111.016014. [DOI] [PMC free article] [PubMed] [Google Scholar]
- 44.Cox J, Mann M. MaxQuant enables high peptide identification rates, individualized p.p.b.-range mass accuracies and proteome-wide protein quantification. Nat Biotechnol. 2008;26:1367–1372. doi: 10.1038/nbt.1511. doi:10.1038/nbt.1511. [DOI] [PubMed] [Google Scholar]
- 45.Combet C, Blanchet C, Geourjon C, Deleage G. NPS@: network protein sequence analysis. Trends Biochem Sci. 2000;25:147–150. doi: 10.1016/s0968-0004(99)01540-6. [DOI] [PubMed] [Google Scholar]
- 46.Update on activities at the Universal Protein Resource (UniProt) in 2013. Nucleic Acids Res. 2013;41:D43–47. doi: 10.1093/nar/gks1068. doi:10.1093/nar/gks1068. [DOI] [PMC free article] [PubMed] [Google Scholar]
- 47.Pearson WR, Lipman DJ. Improved tools for biological sequence comparison. Proceedings of the National Academy of Sciences of the United States of America. 1988;85:2444–2448. doi: 10.1073/pnas.85.8.2444. [DOI] [PMC free article] [PubMed] [Google Scholar]
- 48.Edgar RC. MUSCLE: a multiple sequence alignment method with reduced time and space complexity. BMC Bioinformatics. 2004;5:113. doi: 10.1186/1471-2105-5-113. doi:10.1186/1471-2105-5-113. [DOI] [PMC free article] [PubMed] [Google Scholar]
- 49.Eddy SR. Accelerated Profile HMM Searches. PLoS Comput Biol. 2011;7:e1002195. doi: 10.1371/journal.pcbi.1002195. doi:10.1371/journal.pcbi.1002195. [DOI] [PMC free article] [PubMed] [Google Scholar]
- 50.Flicek P, et al. Ensembl Nucleic Acids Res. 2013;2013;41:D48–55. doi: 10.1093/nar/gks1236. doi:10.1093/nar/gks1236. [DOI] [PMC free article] [PubMed] [Google Scholar]
Associated Data
This section collects any data citations, data availability statements, or supplementary materials included in this article.


