

Abstract
Aim
To evaluate the new Octavius 4D system for patient specific quality assurance and to study the correlation between plan complexity and gamma index analysis in patient specific quality assurance of VMAT using the Octavius 4D system.
Background
McNiven (2010) proposed a study to evaluate the utility of a complexity metric, the Modulation Complexity Score, to evaluate the relationship of the metric with deliverability in IMRT.
Materials and methods
Evaluation of the Octavius 4D system was carried out by gamma evaluation of user defined MLC created patterns and AAPM TG 119 benchmark plans. The relationship between plan complexity expressed as Modulation Complexity Score (MCS) and the gamma index analysis was established by a planar and volumetric gamma analysis of 106 clinically approved VMAT patient plans of different sites.
Results
Average volumetric 3D global gamma evaluation (3 mm/3%) results for the evaluation plans was 97.41% for 6 MV X-rays and 98.30% for 15 MV X-rays. Average MCS values for the head and neck, pelvic and thoracic plans were 0.2224, 0.3615 and 0.1874. Average volumetric 3D global gamma analysis (3 mm/3%) results for the head and neck, pelvic and thoracic VMAT plans were 95.45%, 97.51% and 96.98%, respectively. Out of 90 correlation analyses between the MCS and gamma passing rate, only 3 had the r value greater than 0.5.
Conclusions
The Octavius 4D system is a suitable device for patient specific pretreatment QA. Global and local gamma analysis results showed a weak correlation with the MCS.
Keywords: Octavius 4D system, VMAT QA, 3D dosimetry, Dose verification, Plan complexity
1. Background
Radiation therapy has long been recognized as an effective method for treating cancer. Aim of radiotherapy is to deliver uniform maximum dose of ionizing radiation to target volume while minimizing dose to the critical organs and healthy tissues. New treatment techniques, such as intensity modulated radiation therapy (IMRT) and volumetric modulated arc therapy (VMAT), have enabled the escalation of target dose with fewer side effects to the surrounding organs-at-risk. Both IMRT and VMAT use intensity modulation to achieve the desired dose distribution. In IMRT, this is achieved by moving multi-leaf collimators (MLC) during the course of treatment, thereby delivering a radiation field with a non-uniform intensity. VMAT delivers radiation by rotating the gantry through one or more arcs with radiation continuously on. In VMAT, the number of parameters can be varied to achieve intensity modulation volumetrically. These include: (i) the MLC aperture shape, (ii) the fluence-output rate (“dose rate”) and (iii) the gantry rotation speed. This increased complexity of clinical treatments raises the need for more accurate dose verification systems and procedures.1–3
Traditional pretreatment verification involves point dose measurements using ionization chambers and fluence measurements using films or 2D array detectors. The process usually involves the preparation of a verification plan in the treatment planning system (TPS) using the beam parameters the same as those of the patient plan and delivered in the phantom. Measured dose plane in the phantom is then compared against the calculated dose using gamma evaluation first introduced by Low et al.4 Various detectors have been studied for IMRT and VMAT patient specific quality assurance.5–9 Technological advancements have led to the use of new 3D dosimeters and metrics for patient specific QA. Such 3D gamma metric extends analysis into a third-dimensional axis, thereby providing full volumetric gamma assessment as an alternative to a single plane 2D gamma analysis. Octavius 4D system (PTW, Germany) is one such device that can perform 3D gamma evaluation. Stathakis et al.10 and McGarry et al.11 performed characterization of the Octavius 4D system for patient specific quality assurance in VMAT deliveries.
The agreement between planned and measured dose distribution may be affected by both the accuracy of the TPS calculation and the delivery accuracy. Quantification of these two causes of errors is a difficult task. However, an analysis based on plan parameters may provide important information regarding delivery accuracy. Generally, a high degree of complexity for fixed-beam IMRT has been associated with multiple parameters (large number of MUs, complex segment shapes, small segment apertures, large number of segments). McNiven et al.12 proposed a single complexity metric (Modulation Complexity Score) for step-and-shoot IMRT plans. In that study McNiven et al.12 stated the average MCS value of 0.356 for head and neck IMRT. McNiven et al.12 reported no correlation between the IMRT gamma passing rates and the complexity metric, MCS across multiple treatment sites. Masi et al.13 proposed a study on the impact of plan parameters in VMAT dosimetric accuracy. In that study, Masi et al.13 stated the average MCS value of 0.41 ± 0.11 ranged from 0.65 to 0.19 for analyzed sites and correlated the complexity of the plan with the planar gamma analysis passing rate. The creation of complexity metrics could provide a valuable tool for improving plan optimization and verification. Reduction of the quality assurance workload can be accomplished by knowing the complexity of the plan.
2. Aim
This work consists of two parts, one is to evaluate the Octavius 4D system for patient specific quality assurance and the other is to establish a correlation between plan complexity and the gamma analysis passing rate for the VMAT plans using the Octavius 4D system. Evaluation of the Octavius 4D system was performed by comparing the planned and measured distribution of three MLC created distributions (PATTERNS) and AAPM TG 11914 benchmark plans for IMRT and VMAT using 3D gamma evaluation. Based on McNiven et al.12 formalism, 106 clinically approved VMAT plans Modulation Complexity Score (MCS) were determined and correlation between the MCS and gamma passing rates (planar and volumetric) were obtained using Pearson's correlation coefficient (r).
3. Materials and methods
3.1. Octavius 4D system
Octavius 4D system is an independent QA tool for pretreatment verification of radiotherapy treatment plans. Its basic components are: the Octavius Detector 729, the Octavius Rotation unit, Inclinometer, Control Units and Verisoft (V.5.1). The radiation detector used in this study was the PTW Octavius Detector 729™ (PTW, Freiburg, Germany). The Octavius detector array comprises 729 air-vented cubic ionization chambers uniformly arranged in 27 × 27 matrices with an active area of 27 cm × 27 cm. The ionization chambers in the detector array are arranged in such a manner that the center-to-center distance is 1 cm and the edge-to-edge distance is 0.5 cm. Each detector size is 0.5 cm × 0.5 cm × 0.5 cm (0.125 cm3) with effective point of measurement located at 0.75 cm below the surface of the array. It has dead time free read-out and the arrays operate at chamber voltage of +1000 V. The detector array is mounted in an Octavius rotation unit, which is a motorized cylindrical phantom with a diameter of 32.0 cm and length of 34.3 cm. The built-in mechanics and the motor allow the cylinder to rotate, ensuring perpendicular incidence of the radiation beam on the detector array at all times. The rotation unit is made up of polystyrene material and has a density of 1.05 g/cm3. Inclinometer attached to the vertical part of the gantry measures the gantry angles, and allows the dose measurement as a function of time (or) gantry angle. Its measurement range is 360° rotation. The motorized Octavius rotation unit rotates synchronously with the gantry by reading inclinometer's output. The Octavius detector, which always remains aligned perpendicular to the incident beam, measures the dose plane for each gantry angle. The dose measurements together with the corresponding inclinometer data were transferred to a personal computer for data analysis.
The gamma analyses were done with the Octavius 4D system accomplishing software Verisoft (V.5.1). The measured dose planes for each gantry angle were used to reconstruct the dose values in the phantom volumetrically by applying a proprietary algorithm developed by DKFZ Heidelberg based on PDD curves measured for various field sizes ranging from 4 cm × 4 cm to 26 cm × 26 cm for the accelerator and energy in use. All the dose points (measured and extrapolated using PDD curves) at a given gantry angle were summed over all gantry angles to create a volumetric dose distribution with a user-selectable resolution of typically 2.5 mm. Those reconstructed measured dose cubes were compared against the calculated DICOMRT dose cubes, at any particular plane or whole volume. Throughout this study, planar dose analyses were done in the sagittal and coronal planes passing through the isocenter.
3.2. Evaluation of the Octavius 4D system
Three different MLC created patterns were planned in Varian Eclipse treatment planning system (Varian Medical Systems, Palo Alto, US) using AcurosXB 11.0.21 calculation algorithm for Varian CLINAC 2100 C/D (Varian Medical Systems, Palo Alto, US) having 6 MV and 15 MV X-rays equipped with millennium 120 MLC. Measurements were done for both 6 MV and 15 MV X-rays in the Octavius 4D system to evaluate its performance toward MLC produced patterns. Pattern I consists of five bands in the vertical axis (Y axis), 3 cm wide, with the MLC transmission factor from 0.2 to 1.0. Pattern II is a reverse pyramid structure consisting of six steps, with the MLC transmission factor from 1.2 (at edge) to 0.2 (at center). Pattern III is a pyramid structure consisting of six steps, with the MLC transmission factor from 0.2 (at edge) to 1.2 (at center). The entire 3D distributions were analyzed using global gamma criteria of 3 mm/3% with a 10% threshold. All the dosimetric measurements in this study were carried out by positioning the isocenter at the central ion chamber (14, 14) effective point of measurement. The standard setup of the Octavius 4D system in the treatment room is shown in Fig. 1.
Fig. 1.

Standard measurement setup of the Octavius 4D system.
AAPM Task Group (TG) 11914 guidelines have established standard test plans consisting of simplified target structures along with organs at risk (OAR) and planning goals to benchmark the overall accuracy of IMRT planning and delivery. AAPM TG 11914 recommends four benchmark plans, namely multi-target, mock prostate, mock head and neck and C-shape for commissioning of IMRT. To evaluate the performance of the Octavius 4D system AAPM TG 119 benchmark plans were utilized in this study. Each plan uses contours of targets and avoidance structures drawn within the 4D phantom in the TPS. Both IMRT and VMAT plans were generated in accordance to the planning objectives stated in AAPM TG 119.14 These test plans were delivered in the Octavius phantom and dosimetric comparisons have been made between TPS calculated and measured dose distribution for 3 mm/3% global gamma criteria with a 10% threshold.
3.3. Correlation between the plan complexity and the gamma passing rate
McNiven et al.12 proposed a study to evaluate the utility of a complexity metric, the MCS in quality assurance to evaluate the relationship of the metric with deliverability in IMRT. MCS calculation is based on three parameters: segment shape, area and weight. The parameter leaf sequence variability (LSV) was used to characterize the variation in segment shape and parameter aperture area variability (AAV) was used to characterize the variation in segment area relative to the maximum aperture defined by all the segments. The relative segment weight was also incorporated into the final complexity score. The MCS for a plan is the product of LSV and AAV weighted by the relative MU. The MCS, as in the original definition, has the value range from 0 to 1. MCS = 1 means no modulation and the average MCS score for a treatment site always decreases with increased inherent complexity. Recently, based on McNiven et al.12 formalism, Masi et al.13 investigated the impact of a plan parameter on the dosimetric accuracy (planar gamma analysis passing rate) of VMAT. As part of our work, we developed a MATLAB program to compute the MCS score for VMAT plans. All VMAT plans were exported and converted from DICOM to ASCII format. For each arc field, the exported plan contains information about (i) jaws position, (ii) number of control points, (iii) MLC leaf positions for each control point, (iv) cumulative MU weights for each control point and (v) MU for each arc field. This information was extracted using an in-house developed Excel spreadsheet (Microsoft Corporation, US) to MATLAB. Based on the formalism given by McNiven et al.12 and Masi et al.,13 MCS and its parameters for each VMAT plans were determined in MATLAB by following formulae:
where pos is the coordinate of the leaf position and N is the number of moving leaves inside the jaw position.
where A is the number of leaves in the arc.
where represents the MU delivered between two successive control points and I represent the total number of control points.
where J is the number of arcs in the plan.
Different clinical treatment sites have an inherent difference in the level of complexity that would be required to create a clinically acceptable plan, based on the differences in a target shape, size, and location with respect to critical structures. For this purpose, three different sites (head and neck, thoracic and pelvic) were chosen for this study. To establish the relation between the plan complexity and the gamma passing rate, 106 clinically approved VMAT treatment plans were used in this study. These 106 plans consist of 36 head and neck site, 35 thoracic site (esophagus) and 35 pelvic site (cervix) plans. All the VMAT plans were optimized for 6 MV X-rays double arc using Varian Eclipse treatment planning system v.11.0 (Varian Medical Systems, Palo Alto, US) to meet the clinical requirements. Dose calculation for all the VMAT plans was performed using the AcurosXB 11.0.21 algorithm. Measurements were carried out for each VMAT plan in the Octavius 4D system and dosimetric evaluation between planned (AcurosXB 11.0.21) and measured distribution was done using the Verisoft (V5.1). Measured dose values were corrected for daily linac output variation. In this study, we performed the gamma evaluation in two different analysis methods, global (maximum dose normalization) and local (dose at the corresponding position of the reference matrix normalization) gamma analysis. In this study, we evaluated the gamma (global and local gamma analysis) with three different criteria 3 mm/3%, 2 mm/2% and 1 mm/1%, all of them with a 10% threshold. Correlation between the plan complexity (MCS) and the gamma analysis passing rate was examined using Pearson's correlation coefficient (r). Correlation was considered weak for r < 0.5, moderate for 0.5 ≤ r ≤ 0.75 and strong for r > 0.75.
4. Results
4.1. Evaluation of the Octavius 4D system
Planar and volumetric 3D global gamma evaluation (3 mm/3% with 10% threshold) results for the user defined MLC created patterns are shown in Table 1 for 6 MV and 15 MV X-rays. Planar and volumetric gamma evaluation (3 mm/3%) results of the AAPM TG 119 test cases for IMRT and VMAT are shown in Tables 2 and 3, respectively. For 3 mm/3% global gamma criteria, both the user defined MLC created patterns and AAPM TG-11914 plans had a gamma index passing rate higher than 95%. 3D gamma analysis passing rate for a specific test resulted in a slightly higher passing rate than the 2D gamma analysis passing rate. Average volumetric 3D global gamma evaluation (3 mm/3%) passing rates for the user defined patterns were 97.63% for 6 MV X-rays and 99.23% for 15 MV X-rays. AAPM TG-11914 benchmark IMRT and VMAT plans average volumetric 3D global gamma evaluation (3 mm/3%) passing rates were 97.08% and 97.58% for 6 MV X-rays. For 15 MV X-rays, the average volumetric 3D global gamma evaluation (3 mm/3%) results were 98.50% and 97.40%. Volumetric 3D gamma passing rate for the evaluated plans ranged from 96.1% to 98.4% for 6 MV X-rays and from 95.6% to 99.9% for 15 MV X-rays.
Table 1.
Global gamma evaluation (3 mm/3%) results for user defined MLC created fluence pattern.
| Energy | Pattern | Gamma passing rates (%) |
||||
|---|---|---|---|---|---|---|
| Planar analysis |
Volumetric analysis | |||||
| 2D |
3D |
|||||
| Coronal | Sagittal | Coronal | Sagittal | |||
| 6 MV | Pattern I | 95.1 | 95.8 | 95.2 | 96.9 | 96.6 |
| Pattern II | 95.2 | 95.1 | 95.3 | 95.2 | 97.9 | |
| Pattern III | 100.0 | 99.9 | 100.0 | 99.9 | 98.4 | |
| 15 MV | Pattern I | 99.4 | 99.8 | 99.5 | 99.8 | 99.8 |
| Pattern II | 95.1 | 97.3 | 95.7 | 97.3 | 98.0 | |
| Pattern III | 97.0 | 100.0 | 97.6 | 100.0 | 99.9 | |
Table 2.
Global gamma evaluation (3 mm/3%) results of AAPM TG 119 benchmark IMRT plans.
| Energy | Benchmark plans | Gamma passing rates (%) |
||||
|---|---|---|---|---|---|---|
| Planar analysis |
Volumetric analysis | |||||
| 2D |
3D |
|||||
| Coronal | Sagittal | Coronal | Sagittal | |||
| 6 MV | Multi-target | 96.8 | 98.1 | 97.0 | 98.1 | 96.7 |
| Prostate | 95.2 | 95.6 | 96.9 | 95.1 | 97.9 | |
| Head and neck | 95.4 | 95.8 | 95.6 | 95.3 | 96.1 | |
| C-shape | 95.6 | 97.3 | 97.0 | 97.4 | 97.6 | |
| 15 MV | Multi-target | 98.5 | 98.6 | 98.5 | 98.6 | 99.7 |
| Prostate | 95.8 | 95.6 | 95.4 | 95.5 | 98.7 | |
| Head and neck | 95.2 | 96.9 | 95.5 | 97.2 | 98.1 | |
| C-shape | 96.9 | 96.8 | 97.1 | 96.9 | 97.4 | |
Table 3.
Global gamma evaluation (3 mm/3%) results of AAPM TG 119 benchmark VMAT plans.
| Energy | Benchmark plans | Gamma passing rates (%) |
||||
|---|---|---|---|---|---|---|
| Planar analysis |
Volumetric analysis | |||||
| 2D |
3D |
|||||
| Coronal | Sagittal | Coronal | Sagittal | |||
| 6 MV | Multi-target | 95.7 | 96.3 | 95.9 | 96.4 | 98.3 |
| Prostate | 95.1 | 95.8 | 95.5 | 95.8 | 97.6 | |
| Head and neck | 96.4 | 95.6 | 96.8 | 96.3 | 96.1 | |
| C-shape | 97.8 | 97.3 | 97.9 | 97.5 | 98.3 | |
| 15 MV | Multi-target | 95.8 | 97.4 | 95.9 | 97.8 | 97.9 |
| Prostate | 95.6 | 95.6 | 96.0 | 95.7 | 95.6 | |
| Head and neck | 96.0 | 95.6 | 96.4 | 96.3 | 97.9 | |
| C-shape | 95.5 | 96.9 | 95.8 | 97.1 | 98.3 | |
A good quality assurance tool is the one that is easy to understand and implement in the clinical process which can provide useful information. In this work, dosimetric evaluation of the Octavius 4D system was carried out for MLC modulated beams and AAPM TG 11914 benchmark plans. Even though the detector centers are spaced 1 cm apart, the algorithm is able to satisfactorily reconstruct the doses with the resolution of 0.25 cm, all over the volume and the same can be inferred from the results. The 3D dose reconstruction in the phantom allows the user to select any plane (axial, coronal and sagittal) for the evaluation. Moreover, a 3D gamma index can be calculated, which expands the search radius for the gamma index to include the dose planes adjacent to the one that is evaluated. In addition, a volumetric 3D gamma index can be calculated which measures the gamma index for each voxel in the entire phantom volume. With the use of Octavius 4D system, it is possible to compare and analyze the volumetric dose field by field for IMRT or control point by control point for VMAT in a single measurement. Potential improvements in the device could be achieved with closer detector spacing for better resolution.
4.2. Correlation between the plan complexity and the gamma passing rate
Table 4 shows the dosimetric evaluation results of 106 clinically approved VMAT plans for both global and local gamma evaluation. It shows the mean 2D and 3D planar gamma evaluation results in the sagittal and coronal plane, as well as volumetric 3D gamma evaluation with their corresponding standard deviations. Fig. 2 represents the volumetric 3D global gamma evaluation results graphically for 3 mm/3% criteria with a 10% threshold. Average volumetric 3D global gamma analysis (3 mm/3%) results in the head and neck, pelvic and thoracic VMAT plans were 95.45%, 97.51% and 96.98%, whereas for all the analyzed plans (106), the average volumetric 3D global gamma analysis (3 mm/3%) result was 96.63% ± 1.53%. The number of voxels that met the 3 mm/3% global gamma criteria for the volumetric 3D gamma index analysis ranged from 92.4% to 99.3%. Average 2D planar (coronal and sagittal) gamma analysis passing rate was 95.31% ± 1.68% ranging from 88.9% to 99.0%. Average 3D planar (coronal and sagittal) gamma analysis passing rate was 96.06% ± 1.39% ranging from 92.0% to 99.3%. For all the plans, the 3D planar gamma analysis passing rate resulted in a higher passing rate than that of 2D, as expected. Applying stringent criteria, like 2 mm/2% and 1 mm/1%, resulted in a lower passing rate for all 2D and 3D gamma analysis methods, as expected. Among the three sites, thoracic site resulted in a higher passing rate, whereas head and neck site resulted in a lower passing rate for global gamma analysis. Local gamma analysis method always resulted in a lower passing rate than the global gamma analysis method regardless of evaluation criteria. Average volumetric 3D local gamma analysis passing rate of all the plans was 85.57% ± 5.55%. Among the three sites, the thoracic site resulted in a higher passing rate, whereas the pelvic site resulted in a lower passing rate for local gamma analysis.
Table 4.
Average gamma evaluation passing rate of VMAT QA plans with their corresponding standard deviation.
| Gamma criteria | Site | Gamma passing rates (%) |
||||
|---|---|---|---|---|---|---|
| Planar analysis |
Volumetric analysis | |||||
| 2D |
3D |
|||||
| Coronal | Sagittal | Coronal | Sagittal | |||
| Global 3 mm/3% | Head and neck | 95.28 ± 1.10 | 95.12 ± 1.44 | 95.94 ± 1.09 | 95.63 ± 1.30 | 95.45 ± 1.15 |
| Thoracic | 95.77 ± 1.39 | 95.73 ± 2.10 | 96.40 ± 1.26 | 96.38 ± 1.51 | 97.51 ± 1.28 | |
| Pelvic | 95.48 ± 1.78 | 95.83 ± 1.48 | 96.05 ± 1.43 | 96.06 ± 1.41 | 96.98 ± 1.34 | |
| Global 2 mm/2% | Head and neck | 83.04 ± 4.58 | 80.10 ± 4.41 | 84.96 ± 4.38 | 81.21 ± 4.34 | 83.01 ± 4.12 |
| Thoracic | 87.01 ± 3.11 | 84.33 ± 4.04 | 87.81 ± 2.97 | 85.23 ± 3.56 | 88.67 ± 1.91 | |
| Pelvic | 78.61 ± 4.47 | 83.74 ± 4.12 | 82.00 ± 4.25 | 84.38 ± 3.98 | 83.98 ± 4.83 | |
| Global 1 mm/1% | Head and neck | 52.14 ± 5.53 | 46.36 ± 5.37 | 54.06 ± 5.38 | 47.24 ± 5.33 | 49.71 ± 5.50 |
| Thoracic | 57.47 ± 4.42 | 50.83 ± 6.02 | 58.27 ± 4.33 | 51.47 ± 5.83 | 58.05 ± 3.03 | |
| Pelvic | 44.38 ± 5.24 | 51.35 ± 6.88 | 47.08 ± 5.63 | 51.77 ± 6.91 | 50.65 ± 6.25 | |
| Local 3 mm/3% | Head and neck | 89.15 ± 2.90 | 84.46 ± 2.97 | 91.56 ± 2.34 | 86.66 ± 2.83 | 88.18 ± 2.28 |
| Thoracic | 87.87 ± 2.66 | 85.67 ± 4.37 | 90.15 ± 2.38 | 87.95 ± 3.36 | 87.53 ± 2.94 | |
| Pelvic | 83.73 ± 3.95 | 83.01 ± 3.23 | 88.39 ± 2.89 | 85.31 ± 2.92 | 85.33 ± 3.26 | |
| Local 2 mm/2% | Head and neck | 71.51 ± 4.40 | 64.52 ± 4.74 | 75.31 ± 4.22 | 67.23 ± 4.71 | 69.13 ± 4.61 |
| Thoracic | 70.69 ± 3.76 | 66.50 ± 6.36 | 73.63 ± 3.64 | 69.24 ± 5.79 | 69.29 ± 4.83 | |
| Pelvic | 64.56 ± 6.00 | 64.05 ± 4.11 | 70.55 ± 6.12 | 66.71 ± 3.77 | 66.03 ± 5.30 | |
| Local 1 mm/1% | Head and neck | 36.72 ± 3.76 | 30.53 ± 3.09 | 40.27 ± 3.92 | 32.60 ± 3.23 | 34.12 ± 3.56 |
| Thoracic | 37.03 ± 3.35 | 33.94 ± 5.29 | 39.53 ± 3.42 | 35.87 ± 5.52 | 35.33 ± 4.00 | |
| Pelvic | 31.22 ± 5.02 | 29.85 ± 4.08 | 36.09 ± 5.75 | 31.94 ± 3.79 | 32.03 ± 4.33 | |
Fig. 2.
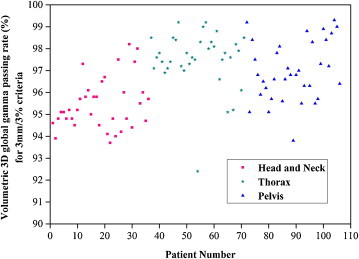
Graphical representation of volumetric global gamma evaluation (3 mm and 3%) results for all the 106 VMAT patients plan.
MCS and its dependent parameters LSV and AAV with their standard deviation and ranges are shown in Table 5. Among the three sites, thoracic site resulted in a higher MCS value and the pelvic site resulted in a lower MCS value. Average MCS values for the head and neck, thoracic and pelvic sites were 0.2224, 0.3615 and 0.1874, respectively. Average MCS value of the pelvic site is higher than that of the head and neck site, which is similar to the results of McNiven et al.12 study. Within the specific site, MCS of the thoracic site resulted in a higher relative standard deviation (%RSD) of 14.25%, whereas for the head and neck and pelvic sites these were 10.07% and 14.03%, respectively. Average MCS for the entire 106 plans was 0.2555 with %RSD of 30.92%. The MCS analysis shows that there is no drastic variation in the LSV value, but notable variation was seen in the AAV value among the three sites. The reason for the same can be attributed to the nature of the optimization algorithm and to the nature of target and critical structures. Average LSV and AAV value for those 106 plans were 0.7446 and 0.3301, respectively. Within the specific site, %RSD of LSV for the head and neck, thoracic and pelvic sites were 2.89%, 3.29% and 3.74%, respectively. %RSD of AAV for the head and neck, thoracic and pelvic sites were 10.87%, 13.64% and 11.12%, respectively. Among 106 plans, %RSD of LSV was 3.85%, which is approximate to the specific site. But among 106 plans, %RSD of the AAV value was 27.29%, which is much greater than that of the specific site. Among the three sites, the pelvic VMAT plans showed a larger aperture area variation in comparison to the head and neck and thoracic sites. However, the global gamma passing rate was lower for the head and neck VMAT plans compared to the thoracic and pelvic VMAT plans, whereas the local gamma passing rate was low for the pelvic plans. Both the LSV and AAV of a plan depend on the maximum adjacent leaf separation and maximum aperture area of that plan. Figs. 3–5 represent the spread of the volumetric 3D gamma passing rate (3 mm/3% criteria with 10% threshold) against the MCS value of the plan for the head and neck, thoracic and pelvic sites, respectively.
Table 5.
Average MCS values with standard deviation (SD) and ranges determined using the in-house MATLAB program.
| Site | Parameter | MCS | LSV | AAV |
|---|---|---|---|---|
| All sites | Mean | 0.2555 | 0.7446 | 0.3301 |
| SD | 0.0790 | 0.0287 | 0.0900 | |
| Max | 0.4060 | 0.8290 | 0.5152 | |
| Min | 0.1356 | 0.6962 | 0.1897 | |
| Head and neck | Mean | 0.2224 | 0.7373 | 0.3009 |
| SD | 0.0224 | 0.0213 | 0.0327 | |
| Max | 0.2592 | 0.7919 | 0.3501 | |
| Min | 0.1838 | 0.6962 | 0.2484 | |
| Thoracic | Mean | 0.3615 | 0.8290 | 0.4422 |
| SD | 0.0515 | 0.0273 | 0.0603 | |
| Max | 0.4060 | 0.7576 | 0.5152 | |
| Min | 0.3029 | 0.7000 | 0.3122 | |
| Pelvic | Mean | 0.1874 | 0.7299 | 0.2492 |
| SD | 0.0263 | 0.0273 | 0.0277 | |
| Max | 0.2213 | 0.7916 | 0.2971 | |
| Min | 0.1356 | 0.7055 | 0.1897 | |
Fig. 3.

Spread of volumetric 3D global gamma passing rate for 3 mm/3% criteria against head and neck site plans MCS.
Fig. 4.

Spread of volumetric 3D global gamma passing rate for 3 mm/3% criteria against thoracic site plans MCS.
Fig. 5.

Spread of volumetric 3D global gamma passing rate for 3 mm/3% criteria against pelvic site plans MCS.
Table 6 shows correlation coefficients (r) between the MCS and gamma passing rate. Results showed a maximum correlation of 0.68 for 2 mm/2% global gamma criteria in a sagittal plane 2D analysis. In the case of a volumetric 3D analysis, maximum correlation was observed for the thoracic site global gamma analysis with 1 mm/1% gamma criteria. Out of 90 correlation analyses between the MCS and gamma passing rate, only 3 had the r value greater than 0.5; moreover, no trend was found in the correlation results. Beam complexity is not the single source contributing to the dose errors. Dose errors may arise from many measurement errors, such as a partial volume effect of ion chambers, uncertainty, MLC leaf position error, dose rate ramp up/down error, gantry sag or wobble, neglected couch attenuation, etc. Errors in TPS beam modeling and MLC modeling also contribute to the dose discrepancies between the measured and calculated ones. Perhaps, a stronger correlation between beam complexity and VMAT deliverability can be observed in a prospective study, in which the effect of beam complexity is isolated from many other sources of dose errors.15 Even though it was observed that there is weak correlation between gamma passing rates and plan complexity (MCS), the analysis of many clinical treatment plans allows for the accumulation of treatment site and technique-specific statistics. The standard deviation of the scores also provides insight to the standardization of a technique. The “typical” complexity score for a specific site could prove useful during training, planning, plan selection, and physics QA. With respect to training for treatment planning; the statistics can help a planner in finding ways to potentially improve the treatment plan and to understand the type of complexity that is typically achievable. The ability to characterize plan complexity with a simple measure such as MCS could also aid in the decision making process. MCS could also play a role in the clinic for the purposes of plan selection where a lower MCS plan would be desirable among similar plans in terms of target coverage and organ-at-risk sparing.
Table 6.
Correlation coefficients (r) between MCS and gamma evaluation passing rate.
| Gamma criteria | Site | Planar analysis |
Volumetric analysis | |||
|---|---|---|---|---|---|---|
| 2D |
3D |
|||||
| Coronal | Sagittal | Coronal | Sagittal | |||
| Global 3 mm/3% | Head and neck | 0.05 | 0.49 | 0.18 | 0.44 | 0.05 |
| Thoracic | 0.36 | 0.17 | 0.20 | 0.24 | 0.32 | |
| Pelvic | 0.06 | 0.26 | 0.27 | 0.24 | 0.18 | |
| Global 2 mm/2% | Head and neck | 0.07 | 0.19 | 0.14 | 0.22 | 0.06 |
| Thoracic | 0.32 | 0.68 | 0.30 | 0.67 | 0.43 | |
| Pelvic | 0.11 | 0.13 | 0.01 | 0.11 | 0.16 | |
| Global 1 mm/1% | Head and neck | 0.02 | 0.08 | 0.03 | 0.12 | 0.03 |
| Thoracic | 0.01 | 0.48 | 0.00 | 0.46 | 0.46 | |
| Pelvic | 0.05 | 0.04 | 0.01 | 0.05 | 0.05 | |
| Local 3 mm/3% | Head and neck | 0.13 | 0.05 | 0.12 | 0.16 | 0.06 |
| Thoracic | 0.27 | 0.44 | 0.28 | 0.47 | 0.37 | |
| Pelvic | 0.37 | 0.45 | 0.27 | 0.46 | 0.27 | |
| Local 2 mm/2% | Head and neck | 0.23 | 0.09 | 0.24 | 0.19 | 0.09 |
| Thoracic | 0.15 | 0.38 | 0.10 | 0.35 | 0.34 | |
| Pelvic | 0.38 | 0.33 | 0.33 | 0.31 | 0.16 | |
| Local 1 mm/1% | Head and neck | 0.45 | 0.25 | 0.42 | 0.34 | 0.26 |
| Thoracic | 0.11 | 0.27 | 0.04 | 0.21 | 0.36 | |
| Pelvic | 0.48 | 0.56 | 0.49 | 0.48 | 0.26 | |
5. Conclusions
Based on evaluation results, we conclude that the Octavius 4D system is a suitable device for patient specific pretreatment QA. The ability of the system to reconstruct the volumetric dose distribution in the phantom provides additional information when compared to the conventional 2D detectors measurements. User defined intensity patterns and AAPM TG 11914 benchmark plans’ results conform its ability for the quality assurance of intensity modulated beams. Correlation results between the MCS and gamma analysis results indicate that MCS of a plan has a weak correlation with the planar as well as volumetric gamma analysis passing rates. The MCS allows for a quantitative assessment of plan complexity and can provide more information related to dose delivery than simple beam parameters such as monitor units. This could prove useful throughout the entire treatment planning and QA process. Strong correlation between beam complexity and the gamma passing rate may be observed in which the effect of beam complexity is set apart from many other sources of dose errors.
Conflict of interest
None declared.
Financial disclosure
None declared.
References
- 1.IMRTCWG Intensity-modulated radiation therapy: current status and issues of interest. Int J Radiat Oncol Biol Phys. 2001;51(4):880–914. doi: 10.1016/s0360-3016(01)01749-7. [DOI] [PubMed] [Google Scholar]
- 2.Galvin J.M., Ezzell G., Eisbrauch A. Implementing IMRT in clinical practice: a joint document of the American Society for Therapeutic Radiology and Oncology and the American Association of Physicists in Medicine. Int J Radiat Oncol Biol Phys. 2004;58(5):1616–1634. doi: 10.1016/j.ijrobp.2003.12.008. [DOI] [PubMed] [Google Scholar]
- 3.Malicki J. The importance of accurate treatment planning, delivery, and dose verification. Rep Pract Oncol Radiother. 2012;17(2):63–65. doi: 10.1016/j.rpor.2012.02.001. [DOI] [PMC free article] [PubMed] [Google Scholar]
- 4.Low D.A., Harms W.B., Mutic S., Purdy J.A. A technique for the quantitative evaluation of dose distributions. Med Phys. 1998;25(5):656–661. doi: 10.1118/1.598248. [DOI] [PubMed] [Google Scholar]
- 5.Olch A.J. Evaluation of the accuracy of 3DVH software estimates of dose to virtual ion chamber and film in composite IMRT QA. Med Phys. 2012;39(1):81–86. doi: 10.1118/1.3666771. [DOI] [PubMed] [Google Scholar]
- 6.Bedford J.L., Lee Y.K., Wai P., South C.P., Warrington A.P. Evaluation of the Delta4 phantom for IMRT and VMAT verification. Phys Med Biol. 2009;54(9):N167–N176. doi: 10.1088/0031-9155/54/9/N04. [DOI] [PubMed] [Google Scholar]
- 7.Sukumar P., Padmanaban S., Jeevanandam P., Syam Kumar S.A., Nagarajan V. A study on dosimetric properties of electronic portal imaging device and its use as a quality assurance tool in volumetric modulated arc therapy. Rep Pract Oncol Radiother. 2011;16(6):248–255. doi: 10.1016/j.rpor.2011.08.001. [DOI] [PMC free article] [PubMed] [Google Scholar]
- 8.Saminathan S., Chandraraj V., Sridhar C.H., Manickam R. Comparison of individual and composite field analysis using array detector for intensity modulated radiotherapy dose verification. Rep Pract Oncol Radiother. 2012;17(3):157–162. doi: 10.1016/j.rpor.2012.03.004. [DOI] [PMC free article] [PubMed] [Google Scholar]
- 9.Feygelman V., Zhang G., Stevens C., Nelms B.E. Evaluation of a new VMAT QA device, or the “X” and “O” array geometries. J Appl Clin Med Phys. 2011;12(2):146–168. doi: 10.1120/jacmp.v12i2.3346. [DOI] [PMC free article] [PubMed] [Google Scholar]
- 10.Stathakis S., Myers P., Esquivel C., Mavroidis P., Papanikolaou N. Characterization of a novel 2D array dosimeter for patient-specific quality assurance with volumetric arc therapy. Med Phys. 2013;40(7):071731. doi: 10.1118/1.4812415. [DOI] [PubMed] [Google Scholar]
- 11.McGarry C.K., O’Connell B.F., Grattan M.W., Agnew C.E., Irvine D.M., Hounsell A.R. Octavius 4D characterization for flattened and flattening filter free rotational deliveries. Med Phys. 2013;40(9):091707. doi: 10.1118/1.4817482. [DOI] [PubMed] [Google Scholar]
- 12.McNiven A.L., Sharpe M.B., Purdie T.G. A new metric for assessing IMRT modulation complexity and plan deliverability. Med Phys. 2010;37(2):505–515. doi: 10.1118/1.3276775. [DOI] [PubMed] [Google Scholar]
- 13.Masi L., Doro R., Favuzza V., Cipressi S., Livi L. Impact of plan parameters on the dosimetric accuracy of volumetric modulated arc therapy. Med Phys. 2013;40(7):071718. doi: 10.1118/1.4810969. [DOI] [PubMed] [Google Scholar]
- 14.Ezzell G.A., Burmeister J.W., Dogan N. IMRT commissioning: multiple institution planning and dosimetry comparisons, a report from AAPM Task Group 119. Med Phys. 2009;36(11):5359–5373. doi: 10.1118/1.3238104. [DOI] [PubMed] [Google Scholar]
- 15.Du W., Cho S.H., Zhang X., Hoffman K.E., Kudchadker R.J. Quantification of beam complexity in intensity-modulated radiation therapy treatment plans. Med Phys. 2014;41(2):021716. doi: 10.1118/1.4861821. [DOI] [PubMed] [Google Scholar]