

Abstract
INTRODUCTION
The PGSA (Placebo Group Simulation Approach) aims at avoiding problems of sample representativeness and ethical issues typical of placebo-controlled secondary prevention trials with MCI patients. The PGSA uses mathematical modeling to forecast the distribution of quantified outcomes of MCI patient groups based on their own baseline data established at the outset of clinical trials. These forecasted distributions are then compared with the distribution of actual outcomes observed on candidate treatments, thus substituting for a concomitant placebo group. Here we investigate whether a PGSA algorithm that was developed from the MCI population of ADNI 1*, can reliably simulate the distribution of composite neuropsychological outcomes from a larger, independently selected MCI subject sample.
METHODS
Data available from the National Alzheimer’s Coordinating Center (NACC) were used. We included 1523 patients with single or multiple domain amnestic mild cognitive impairment (aMCI) and at least two follow-ups after baseline. In order to strengthen the analysis and to verify whether there was a drift over time in the neuropsychological outcomes, the NACC subject sample was split into 3 subsamples of similar size. The previously described PGSA algorithm for the trajectory of a composite neuropsychological test battery (NTB) score was adapted to the test battery used in NACC. Nine demographic, clinical, biological and neuropsychological candidate predictors were included in a mixed model; this model and its error terms were used to simulate trajectories of the adapted NTB.
RESULTS
The distributions of empirically observed and simulated data after 1, 2 and 3 years were very similar, with some over-estimation of decline in all 3 subgroups. The by far most important predictor of the NTB trajectories is the baseline NTB score. Other significant predictors are the MMSE baseline score and the interactions of time with ApoE4 and FAQ (functional abilities). These are essentially the same predictors as determined for the original NTB score.
CONCLUSION
An algorithm comprising a small number of baseline variables, notably cognitive performance at baseline, forecasts the group trajectory of cognitive decline in subsequent years with high accuracy. The current analysis of 3 independent subgroups of aMCI patients from the NACC database supports the validity of the PGSA longitudinal algorithm for a NTB. Use of the PGSA in long-term secondary AD prevention trials deserves consideration.
Keywords: Placebo Group Simulation Approach (PGSA), clinical AD trials, phase 3 clinical trials, MCI, modelling AD trajectories, prodromal AD
Introduction
We have recently proposed the PGSA (Placebo Group Simulation Approach) as a novel study design to partly substitute for long-term placebo-controlled secondary prevention trials in patients with mild cognitive impairment (MCI) (1). The PGSA uses study participants’ own demographic, baseline clinical, biological and neuropsychological data to model and forecast the distribution of the natural course of relevant cognitive outcomes of untreated patients included in clinical trials. These model-based outcomes are subsequently compared with the actual outcomes observed on the experimental treatment being tested, and may thus substitute for real observed outcomes of a concomitant placebo group. Differences -positive or negative - between the forecasted outcomes and the outcomes on experimental treatment may then be ascribed to the effect of the drug being tested. According to our proposal the PGSA should be considered in advanced stages of drug development, typically in Phase 3 long-term studies with candidate disease-course altering compounds, assuming (1) that the expected biological and clinical effects of the experimental drug have been supported in preceding clinical trials on the target population (subjects with prodromal AD or MCI due to AD (2, 3)), and (2) that the experimental drug’s projected risk-benefit profile is suggestive of a successful completion of its clinical development.
Under such circumstances the PGSA can help to resolve two problems that are typically encountered in late stages of clinical development of disease-course altering drugs against AD and other progressive degenerative brain disorders: (1) the problem of subject sample representativeness (some patients and/or their carers will not consent to participate in a placebo-controlled long-term trial once they fully understand what placebo control means), and (2) the ethical dilemma on the side of investigators who are obliged to expose patients with a high risk of contracting dementia to months and years of foreseeably useless placebo treatment - although they have a potentially effective therapy at their hands. For ethically problematic situations like this the ICH E10 guideline (4) considers using an external (historical) control if the course of the disease is predictable in a group of patients. Similar considerations apply if the new therapy is to be compared with a standard therapy that is known to have insufficient efficacy. Finally, if a standard therapy is available and a three-armed trial is desirable, but not ethically feasible, a simulated placebo group based on the PGSA could replace a real one.
The PGSA has raised some interest in the AD community (5), although questions regarding the generalizability of our published PGSA algorithms are still open. It was also noted that trials using the PGSA and lacking a concomitant placebo group will not reliably answer questions of drug safety and tolerability, and that there is no randomized allocation of drug and placebo to study participants. Our first study (1) demonstrated the internal validity of the PGSA in the MCI population of the Alzheimer Disease Neuroimaging Initiative (ADNI 1 (6, 7)). The present study deals with the external validity of the PGSA, i.e., with the question of whether a PGSA model, that was developed using ADNI 1 MCI data, can be reliably applied to simulate post-baseline neuropsychological performance data of another large, independently selected MCI subject sample, such that they coincide in distribution with the actually observed data.
Material and Methods
A database from the Uniform Data Set (UDS) collected at 33 AD centers in the USA was available from the National Alzheimer’s Coordinating Center (NACC; data collected under the cooperative agreement No. U01 AG016976; for details see Appendix). We used results from the data freeze of March 19, 2014, and, in a first step, excluded those participants who were also included in the ADNI 1 database. The remaining dataset contained 4602 subjects with a diagnosis at baseline of single or multiple domain amnestic mild cognitive impairment (aMCI). Patients younger than 55 or older than 90 years were excluded to conform to the ADNI 1 database. This reduced the dataset to 4466 patients. As we intended to apply a longitudinal model that includes the number of E4 alleles as a potential predictor, eventually 1523 patients, who had been genotyped for ApoE, and had at least one follow-up visit between 2 and 3.5 years after baseline were eligible for the analysis. Their demographic and other baseline characteristics are essentially the same as those of the whole NACC aMCI subject sample not restricted for ApoE4 availability (Table 1). Subjects underwent repeated evaluation of their cognitive function, about one year apart. Since our published PGSA models are based on ADNI 1 data not extending beyond 3 years (8), we did not consider NACC data from visits occurring more than 3.5 years after baseline.
Table 1.
Subject demographics
| Variable | All NACC (N=4466) | NACC included (N=1523) | ADNI-1 (N=397) |
|---|---|---|---|
| Sex male, n (%) | 2276 (51.0 %) | 797 (52.3) | 256 (64.5 %) |
| Age, mean ± SD | 74.4 ± 7.9 | 74.2 ± 7.9 | 74.2 ± 7.5 |
| Education (years), mean ± SD | 14.9 ± 3.5 | 15.5 ± 3.1 | 15.7 ± 3.0 |
| BMI, mean ± SD | 27.2 ± 5.1 | 27.1 ± 4.8 | 26.1 ± 4.0 |
| Hachinski, median, min-max | 1, 0–11 | 1, 0–10 | 1, 0–4 |
| 0 E4 allele, n (%) | 1403 (54.2) | 837 (55.0) | 185 (46.6) |
| 1 E4 allele, n (%) | 967 (37.4 %) | 549 (36.0) | 165 (41.6 %) |
| 2 E4 alleles, n (%) | 219 (8.5 %) | 137 (9.0) | 47 (11.8 %) |
| MMSE, median, min-max | 27, 2–30 | 27, 11–30 | 27, 23–30 |
| FAQ, median, min-max | 2, 0–30 | 2, 0–29 | 2, 0–21 |
Data available from the 1523 aMCI patients were collected between 2005 and 2014. In order to strengthen the analysis and to verify whether there was a drift over time in the neuropsychological outcomes, the subject sample was split into 3 subsamples of equal size (see Table 3 below): a group of “early” subjects (baseline data collected between July 29, 2005 and August 10, 2006), “mid” (baseline data collected between August 11, 2006 and December 2, 2007) and “late” participants (baseline data collected between December 3, 2007 and September 30, 2011).
Table 3.
Demographics of 3 NACC subgroups (“early”, “mid” and “recent” subjects)
| Variable | Early (N=509) | Mid (N=506) | Recent (N=508) |
|---|---|---|---|
| Gender male, n (%) | 266 (52.3) | 247 (48.8) | 284 (55.9) |
| Age, mean ± SD | 74.9 ± 8.1 | 74.4 ± 7.4 | 73.2 ± 7.9 |
| Education (years), mean ± SD | 14.9 ± 3.14 | 15.4 ± 3.0 | 15.5 ± 3.2 |
| BMI, mean ± SD | 27.0 ± 4.64 | 27.2 ± 4.83 | 27.0 ± 4.82 |
| Hachinski, median, min-max | 1, 0–10 | 1, 0–10 | 1, 0–10 |
| 0 E4 allele, n (%) | 298 (58.5) | 285 (56.3) | 254 (50.0) |
| 1 E4 allele, n (%) | 174 (34.2) | 180 (35.6) | 195 (38.4) |
| 2 E4 alleles, n (%) | 37 (7.3) | 41 (8.1) | 59 (11.6) |
| MMSE, median, min-max | 28, 18–30 | 28, 15–30 | 28, 11–30 |
| FAQ, median, min-max | 2, 0–27 | 2, 0–29 | 2, 0–25 |
The ADAScog as a potential cognitive outcome is not available in the NACC database. For this reason the relevant outcome used in the current analyses is the trajectory of the composite score of a Neuropsychological Test Battery (NTB), computed from the z-scores of a set of standard tests of mental performance. Details on the UDS NTB and its factor structure are provided in Weintraub et al (9) and Hayden et al (10). In the absence of the ADAScog we preferred to use the NTB scores to the CDR-SB (Clinical Dementia Rating sum of boxes (11)) also contained in the NACC database, since the latter is based on a metric similar to an ordinal scale, which makes it less suitable for linear regression models as used in the current analysis. In addition, within MCI the numerical range of the CDR-SB becomes quite restricted as seen, e.g., in Cedarbaum et al. (11, Table 1), and that lack of variability reduces the ability to detect small changes which can be represented in scores like the NTB.
It had been our intention to include the same set of 9 neuropsychological tests for analysis of the NACC NTB that were integrated in the composite NTB score originating from the ADNI 1 database. However, one of the tests (delayed recall from the Auditory Verbal Learning test, AVLT) was not available in the NACC database, and for one other test (Logical Memory delayed recall from the Wechsler Memory Scale, WMS) several procedural details used in NACC differed significantly from those used in ADNI 1 (see below). Therefore, these two tests of the ADNI NTB could not be included in the current analysis (Textbox 1).
Textbox 1. Tests included in NTB-7.
| Digit span forward Digit span backward Category fluency animals Category fluency vegetables Trail making B WAIS Digit symbol substitution test Boston naming test Not available in NACC database: Delayed Recall from the AVLT Not included due to procedural differences: Logical Memory Test from the WMS |
Z-scores of the remaining 7 neuropsychological variables were computed by subtracting the mean and dividing the obtained difference by the standard deviation of the ADNI 1 participants who were cognitively normal at study entry (8). The z-scores for the Trail Making Test B (measured in seconds to complete) were inverted so that high values reflect high ability. The summary score NTB-7 was computed if at least 6 of the seven variables had valid data. Some individuals in NACC reported more than 20 years of education and, to conform to the ADNI 1 data, these values have been truncated to 20 years. Nine demographic, clinical, biological and neuropsychological variables were included as candidate predictors in the mixed model used for analysis (Textbox 2).
Textbox 2. Candidate Predictor Variables Available at Baseline.
| Gender (1 = male, 2 = female) Education (years) Age (years) Body Mass Index (BMI): normal (<25), high (25–30), obese (>30) Hachinski modified score Number of ApoE4 genes (available from 42% of subjects) Total score of the Functional Assessment Questionnaire (FAQ) MMSE NTB-7 score |
As a first step in the current validation of the longitudinal PGSA model, we had to adapt the original PGSA model for the NTB score with 9 tests to the NTB-7 score. Our published PGSA models were based on data from the ADNI database available in October 2009 (8). For the current analysis we downloaded the now completed ADNI database and extracted the data records of patients who were classified as MCI at baseline in the original ADNI study, now called ADNI 1. This data set comprises 397 patients at baseline, 380 at month 6, 370 at month 12, 324 at month 18, 302 at month 24 and 251 at month 36. The procedure to develop the adapted mixed model was the same as described in (1):
The sample consists of the patients in the ADNI 1 database with a diagnosis of MCI at baseline;
The response is the composite score of the NTB, now computed as the mean of seven z-scores, abbreviated as NTB-7;
The potential predictors are those listed in Textbox 2.
The starting model used all predictor variables, time and the square of time and interactions with time as fixed effects and allowed for random intercepts and slopes of patients. Random effects take into account the inter-correlations of NTB-7 scores within the same patient. Random intercepts model each patient’s deviation from the overall mean predicted from the model’s fixed effects (linear combination of all predictors and of time). Random slopes model each patient’s individual slope to describe change over time. Standard deviations of random intercepts and slopes are available from mixed model analysis.
Variable selection was based on the AIC criterion whereas, in the previous process of model development (1), variable selection was based on Wald tests. Backward stepping was first done for interactions with time, then for all main effects that were not involved in an interaction. Finally, each of the two-way interactions not involving time was tested for inclusion in the model. The final model was checked for normality and variance homogeneity of residuals. The model was then used to simulate NTB-7 scores on follow-up visits for the NACC data. The simulation comprises all aspects of randomness in the model parameters: For each patient, fixed effects were sampled from the multivariate distribution of the regression coefficients, and random effects were sampled from centered bivariate normal distribution; independent error terms were simulated for each visit. Five hundred simulation runs were performed to demonstrate the stability of the procedure. Boxplots comparing observed and simulated scores are broken down by rounded years of follow-up. This simulation model reproduces the variance in the observed NTB-7 scores, whereas predicted values for the model have considerably smaller variance.
Analysis was performed using R (12) and, specifically, its package nlme for mixed effects model.
Results
Comparison of ADNI 1 and NACC data at baseline
Although the NACC sample showed wider variation in some baseline characteristics at the lower end, the ADNI 1 and the NACC MCI samples were remarkably similar with regard to average age, years of education, cerebrovascular risk, body mass index, cognitive status (MMSE) and functional abilities in daily life (FAQ) (Table 1). In contrast, the NACC population contains fewer male subjects and fewer individuals with one or two ApoE4 alleles than the ADNI 1 sample (45.0% vs. 53.4%).
Despite some minor, statistically significant differences (p values not shown), the ADNI 1 and the NACC MCI patient samples were quite similar at baseline with regard to their performance on most tests comprised in the NTB (Table 2). However, this did not hold true for the Logical Memory test of the WMS where NACC subjects performed almost 60% better than the ADNI 1 subjects on average (data not shown). The likely reason for this discrepancy is twofold: NACC subjects, but not ADNI 1 participants, were given a cue before being asked to recount the story of the Wechsler test, and the maximum performance of the ADNI 1 subjects was truncated by the investigators to 8 recalled items (S. Weintraub, Personal Communication). Given these differences this test was not included in the NTB-7 (see Textbox 1).
Table 2.
Summary statistics of neuropsychological scores at baseline in “All NACC”, “NACC included” and ADNI 1 samples
| Cognitive test variable Means ± SD | All NACC aMCI (N=4466) | NACC included (N=1523) | ADNI-1 (N=397) |
|---|---|---|---|
| Digit span forward | 7.83 ± 2.10 | 8.06 ± 2.05 | 8.22 ± 2.02 |
| Digit span backward | 5.79 ± 2.09 | 6.00 ± 2.08 | 6.17 ± 2.02 |
| Verbal fluency (animals) | 15.9 ± 5.0 | 16.3 ± 5.0 | 15.9 ± 4.9 |
| Verbal fluency (vegetables) | 10.9 ± 3.9 | 11.2 ± 3.8 | 10.7 ± 3.5 |
| Trail Making Test B | 140 ± 77 | 129 ± 72 | 131 ± 73 |
| Digit symbol substitution | 36.9 ± 12.3 | 38.4 ± 11.7 | 36.8 ± 11.2 |
| Boston Naming Test | 24.5 ± 4.9 | 25.2 ± 4.6 | 25.5 ± 4.1 |
| NTB-7 (z-scores) | −0.90 ± 0.87 | −0.75 ± 0.82 | −0.76 ± 0.76 |
“All NACC” (N=4466) was obtained after excluding patients also found in the ADNI 1 database and patients with <55 years or > 90 years. 2589 of these subjects were ApoE genotyped. “NACC included” (N=1523) were ApoE genotyped and had at least one follow-up visit between 2 and 3.5 years after baseline. The column to the right shows the respective characteristics of ADNI 1 MCI patients for comparison.
All subsequent analyses were performed separately for 3 subgroups of NACC aMCI patients recruited at different times between 2005 and 2011 (early – mid –recent). Tables 3 and 4 show demographic and neuropsychological data of these 3 subgroups; they are well comparable in all respects, with one exception: the percentage of carriers of one or two ApoE4 alleles is higher in the recent subjects than in the early and mid ones.
Table 4.
Summary statistics of neuropsychological scores at baseline in 3 NACC subgroups
| Cognitive test variable Means ± SD | Early (N=509) | Mid (N=506) | Recent (N=508) |
|---|---|---|---|
| Digit span forward | 8.06 ± 2.07 | 8.01 ± 2.04 | 8.10 ±2.03 |
| Digit span backward | 6.11 ± 2.12 | 5.98 ± 2.02 | 5.91 ± 2.11 |
| Verbal fluency (animals) | 16.3 ± 4.85 | 16.1 ± 5.12 | 16.6 ± 5.13 |
| Verbal fluency (vegetables) | 11.4 ± 3.75 | 11.3 ± 3.82 | 11.0 ± 3.91 |
| Trail Making Test B | 131 ± 75 | 133 ± 72 | 124 ± 68 |
| Digit symbol substitution | 37.6 ± 11.7 | 38.5 ± 11.3 | 39.1 ± 12.0 |
| Boston Naming Test | 25.0 ± 4.9 | 25.1 ± 4.6 | 25.4 ± 4.3 |
| NTB-7 (z-scores) | −0.76 ± 0.84 | −0.77 ± 0.81 | −0.71 ± 0.82 |
The “NACC included” subject sample (N=1523) was split into 3 subsamples of similar size: a group of “early”, “mid” and “recent” subjects, depending on the time their baseline data were collected.
Adaptation of the ADNI 1 model
The mixed model for NTB-7 at follow-up visits contains time, the candidate predictor variables (Textbox 2) and interactions of time with these predictor as fixed effects. Random intercepts and random slopes were included because they account for inter-correlations and provided significant improvements of the model. The first step of fixed effects selection eliminated the interaction of time with categorized BMI, age, Hachinski modified score, MMSE, education and sex in this order. The interactions of time with the number of ApoE4 alleles, FAQ and NTB-7 scores at baseline remained in the model. In the second step the effects of age, categorized BMI, education, and Hachinski were eliminated in this order. None of the pairwise interactions not involving time entered the model in the final step. The resulting model was checked for normality and homogeneity of variances. Since the variances decrease with increasing predicted values, a power-transformation for error variance was included in the model. This cured the problem and yielded normal distribution of the residuals as well. The final model is shown in Table 5.
Table 5.
Fixed effects of the final mixed model for the NTB-7 estimated with the ADNI 1 subpopulation with an initial diagnosis of MCI
| Fixed effects | Coefficient | Standard error | t value | P value |
|---|---|---|---|---|
| Intercept | −0.772 | 0.2911 | −2.65 | 0.0081 |
| Time | 0.168 | 0.0396 | 4.25 | 0.0000 |
| Time2 | −0.059 | 0.0093 | −6.32 | 0.0000 |
| Apolipoprotein E4 | 0.030 | 0.0268 | 1.13 | 0.2603 |
| FAQ at baseline | −0.006 | 0.0043 | −1.32 | 0.1863 |
| MMSE | 0.024 | 0.0104 | 2.26 | 0.0242 |
| NTB-7 at baseline | 0.906 | 0.0271 | 33.42 | 0.0000 |
| Time × Apolipoprotein E4 | −0.080 | 0.0193 | −4.12 | 0.0000 |
| Time × FAQ | −0.013 | 0.0031 | −4.08 | 0.0000 |
| Time × NTB-7 at baseline | 0.077 | 0.0189 | 4.07 | 0.0001 |
Comparison between the previously published longitudinal model for the NTB-9 (1) with the adapted model to simulate performance on the NTB-7 within the ADNI 1 MCI dataset shows high consistency: In both models the strongest single predictor of NTB outcomes, by far, are the scores of the respective NTB at baseline (coefficients are 0.908 in NTB-7 compared to 0.975 in NTB-9). Another significant, but quantitatively much less important predictor in both models is the interaction between the number of ApoE4 alleles and time (−0.080 in NTB-7 versus −0.071 in NTB-9). The square of time only entered the new model, presumably because more information is now available on later visits in the completed ADNI 1 data. The MMSE score at baseline also emerged as a significant, although numerically weak predictor. The effects of time are not comparable, because time is involved in some interactions in both models. Other predictors in both models cannot be compared because they do not enter with the same variables in interactions. ADAScog was an important predictor in the previous model (1) but not in the present one, as the ADAScog is not available in the NACC database.
Simulation of the NACC outcome data
The coefficients of the fixed effects of the ADNI 1 model for the NTB-7 and their distribution were then used to simulate outcomes in the NACC aMCI dataset. All available follow-up visits between 2 and 3.5 years post baseline and with a complete set of predictor variables were extracted from the NACC sample (5078 of 5345 visits had a complete set of predictor variables for the final model). Predictions could not be computed for patients with missing values. Random effects and error terms are generated as centered normal variates with variance obtained from the mixed model estimates.
Comparing observed and simulated values 1, 2 and 3 years after baseline
The time between visits was quite variable in the NACC database: Some follow-up visits took place slightly earlier than one half year after baseline. These are grouped in the “1-year follow-up” by applying a cut-point of 0.45 years. The other cut-points to separate strata were 1.5, 2.5 and 3.5 years.
Boxplots (Figures 1–3) show observed values at baseline and the decreasing numbers of observed values per follow-up for the “early”, “mid” and “late” subgroups separately. The observed values are compared with boxplots of all simulated values (500 times the number of available visits) and with boxplots of the 5%, 25%, 50%, 75% and 95% percentiles from 500 simulation runs. Inspection of Figures 1 – 3 reveals that there is a continuous decline of cognitive performance - as indicated by a downward shift of the observed median z-values – in all 3 subgroups. This continuous decline is also seen in the simulated values – most clearly illustrated by the median z-values and their distributions. It will also be noted on Figures 1 – 3 that, overall, the correspondence between observed and simulated values is high, and that there is a small and slightly increasing overestimation of the cognitive decline in the simulated as compared to the observed values. This is also seen in Table 6, which presents the mean z-values for the 3 strata at baseline and after 1, 2 and 3 years of follow-up. The mean overestimation increases from 0.015 (one year) to 0.117 (three years).
Figure 1.

Observed (obs) and simulated (sim) NTB-7 scores for the subsample of early recruited individuals with complete predictor information in NACC. Boxplots of observed values at baseline and after 1, 2, and 3 years (+/− 6 months), to be compared with boxplots of simulated scores (500 simulations). Each percentile boxplot summarizes 500 percentiles
Figure 3.
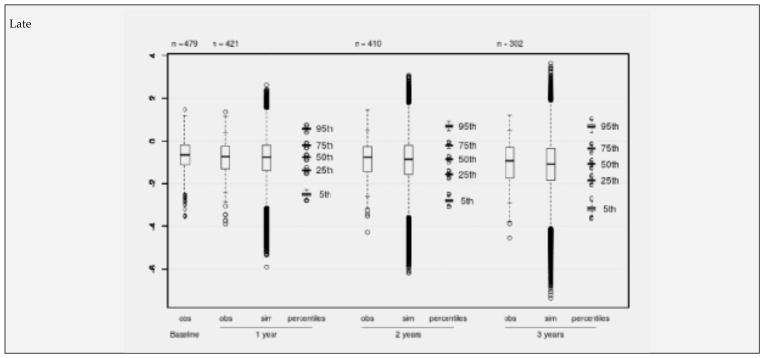
Observed (obs) and simulated (sim) NTB-7 scores for the subsample of recently recruited individuals with complete predictor information in NACC. Boxplots of observed values at baseline and after 1, 2, and 3 years (+/− 6 months), to be compared with boxplots of simulated scores (500 simulations). Each percentile boxplot summarizes 500 percentiles
Table 6.
Comparison between observed and simulated mean NTB-7 scores for 3 NACC subgroups
| Baseline | One year | Two years | Three years | ||||
|---|---|---|---|---|---|---|---|
| Observed | Observed | Simulated | Observed | Simulated | Observed | Simulated | |
| Early | −0.763 | −0.813 | −0.830 | −0.980 | −0.999 | −1.119 | −1.254 |
| Mid | −0.772 | −0.872 | −0.875 | −0.966 | −1.026 | −1.069 | −1.193 |
| Recent | −0.715 | −0.814 | −0.838 | −0.877 | −0.931 | −1.053 | −1.144 |
| Mean | −0.750 | −0.833 | −0.848 | −0.941 | −0.985 | −1.080 | −1.197 |
Discussion
Our original paper on the development of the PGSA models (1) presented two predictive algorithms: a univariate model to simulate ADAScog scores cross-sectionally, and a multivariable model to forecast the averaged z-scores of a NTB longitudinally, i.e., MCI subjects’ cognitive trajectory over several years. Both models used demographic, biological, neuropsychological and clinical data from the ADNI 1 MCI database as potential predictors. A first, internal validation was performed by comparison of observed and simulated ADAScog and NTB-9 scores within the ADNI MCI database (1). Since ADAScog data are not available in the NACC database, the present analysis focuses on the longitudinal PGSA model for the NTB and attempts a validation by applying the ADNI model for the NTB to a larger set of NACC aMCI data. The original PGSA longitudinal model for the NTB-9 of ADNI 1 needed to be adapted because two neuropsychological tests were either not available in the NACC database, or had to be omitted owing to relevant procedural differences between ADNI 1 and NACC. As a consequence, we adapted the longitudinal model, starting again from the meanwhile completed ADNI 1 database.
Although the omission of two proven tests of learning and memory in the new NTB-7 represents a significant loss of information, the published PGSA model for the NTB-9 from ADNI 1 underwent little change when recalculated for the NTB-7 and applied to the updated ADNI 1 data. In both versions of the model the strongest predictor of the NTB trajectories, by far, are the baseline scores of the respective NTB: the baseline NTB-9 scores for the trajectory of the NTB-9, and the baseline NTB-7 scores for the trajectory of the NTB-7. A second significant predictor in both models is the interaction between the number of ApoE4 alleles and time: The more E4 alleles are present, the faster is the decline in NTB-7 scores. The FAQ score, another significant predictor in the model for the NTB-9, also emerged as a significant predictor, interacting with time, of the NTB-7 scores.
The adapted model for the NTB-7 was then applied to a large aMCI dataset from NACC. In order to strengthen the analysis and to check whether there was a trend in time of study entry in the neuropsychological measures, the NACC aMCI sample was split into 3 subsamples of similar size, called “early”. “mid” and “late” depending on their time of recruitment. Visual comparison of Figures 1, 2 and 3 and inspection of Tables 4 and 6 provided two crucial observations: (1) There is no time trend in either the baseline values or the changes from baseline with regard to the mean NTB-7 z-scores; and (2) in all 3 subsets of data there was a high level of correspondence between the empirically observed and the model-based simulated values, supporting the validity of the longitudinal PGSA algorithm for the NTB-7.
Figure 2.

Observed (obs) and simulated (sim) NTB-7 scores for the subsample of mid-time recruited individuals with complete predictor information in NACC. Boxplots of observed values at baseline and after 1, 2, and 3 years (+/− 6 months), to be compared with boxplots of simulated scores (500 simulations). Each percentile boxplot summarizes 500 percentiles
However, close scrutiny of Figures 1–3 and Table 6 reveals a small, but potentially relevant difference between the observed and the modelled values: There is some overestimation of cognitive decline in the simulated as compared to the observed data which tends to increase over time. Before we discuss the significance of this observation, another phenomenon, also seen in Figures 1–3, needs to be highlighted: the conspicuously slow decline of the NTB-7 z-scores in both the observed and the simulated data over time.
Little cognitive decline in MCI subjects on placebo after 2 and 3 years was also seen in clinical drug trials with galantamine (13) and rivastigmine (14), and an unexpectedly low conversion rate to dementia even led to an extension of the rivastigmine trial from 3 to 4 years (14). As for the slow average decline of the NTB-7 scores in the current study, one needs to consider some specifics of the NACC aMCI sample included in the analysis. These subjects’ median MMSE score at baseline was 27.0 (third quartile 29.0; see Table 1), suggesting that many of them were in an early stage of MCI or were possibly misclassified at baseline as having aMCI. A diagnosis of aMCI is even more doubtful for those subjects who had NTB-7 z-scores consistently around or clearly above zero at baseline or later, i.e., who were in the range typical of cognitively healthy subjects (Figures 1–3). As is known from other studies (e.g., (15–17)), subjects in very early stages of MCI are unlikely to deteriorate, or may revert to normal on follow-up, an observation that could partly explain the slow average decline noted in our analysis. Another factor that needs consideration is selective dropout of subjects with relatively poor performance at baseline: In longitudinal studies of cognitive performance, subjects with lower scores at baseline tend to deteriorate further and are then likely to drop out prematurely, and this selective dropout of poorer performers will result in seemingly better average performance on follow-up of those individuals who remain in the study. This mechanism was likely operating in the current study, too, as will be noted from the decreasing numbers of subjects available 1, 2 and particularly 3 years after baseline. In summary, the slow decline of cognitive performance in all 3 subsamples can probably be ascribed to two factors: a high percentage of subjects with little or no cognitive impairment at baseline included in the NACC aMCI database, and selective dropout primarily of those subjects who had relatively poor cognitive performance at baseline.
With regard to the small, but monotonically increasing overestimation of cognitive decline in the simulated data, one has to assume that selective dropout also played its part, and that NTB scores are missing not at random, i.e. missingness is dependent on the unobserved values and cannot be predicted from (previous) observed values. To be more concrete, we suppose that some subjects did not attend a subsequent visit when their cognition had deteriorated after the previous visit. The numbers on top of Figures 1 – 3 suggest that this may have happened more frequently in the “mid” and “late” subgroups between the 2nd and the 3rd year, which would then explain why lower values on late visits are underrepresented.
If these considerations apply, two consequences for the application of the longitudinal PGSA model for a NTB in future trials need to be drawn: One relates to the selection of aMCI patient samples with regard to their cognitive performance at baseline, the other to the proportion of subjects who are retained in a study. Thus, if many “very mild” aMCI patients (or subjects with no aMCI) are included in a patient sample, then a clinical trial with a potential disease-course altering drug and using the current longitudinal PGSA model risks to provide false positive results (because there will be less cognitive decline on the drug than forecasted by the model). Consequently, our observations support the notion that a diagnosis of aMCI (or prodromal AD) needs to be backed by thorough testing of cognitive function (18) and, as far as acceptable to trial participants, by relevant biological markers (2, 19). The second consequence relates to patient retention and dropout in a clinical trial: The current PGSA algorithm for a composite NTB presupposes high retention rates (around 80 percent, see Figures). If, however, a significantly higher proportion of MCI patients with relatively poor cognitive performance at baseline are included in and then lost during a study, then NTB forecasts based on the current longitudinal PGSA algorithm will tend to over-estimate cognitive decline.
Returning to the main objective of the current study, i.e. an examination of the generalizability of a PGSA algorithm for MCI patients originating from the ADNI 1 database, it is fair to say that the longitudinal PGSA model for the NTB was supported by 3 independent subsets of aMCI data from NACC.
What inferences can be made from this work with regard to the proposed use of the PGSA models in clinical studies with candidate anti-AD drugs? Can one consider the PGSA as a valid alternative to traditional long-term RPCTs in advanced stages of clinical AD drug development? As noted earlier, development of the PGSA was undertaken with two major goals in mind: a scientific and an ethical one. The scientific goal is to improve the representativeness of patient samples recruited for clinical trials with anti-AD drugs, i.e., not to exclude those study candidates who will decline participation in a trial with prolonged placebo administration. In this regard a trial using the PGSA will be more similar than a RPCT to everyday clinical reality where drug treatment is usually prescribed without randomization to active medication and placebo, blinded assessments etc.. The ethical goal is to avoid or to minimize the extended use of placebo on aMCI or prodromal AD patients with their high risk of contracting dementia within a few years. As an additional benefit of the PGSA, one should also mention that recruitment of candidates into and retention of participants in PGSA-based trials will be easier than for RPCTs, an economical aspect of clinical studies that must not be neglected [20]. As noted by Grill & Karlawish [21] spouses of potential AD study participants are closely involved in their decision as to whether or not entering and continuing on a trial; according to these authors the “possibility of receiving placebo is a barrier to participation”.
We have previously stipulated that the PGSA makes better use of large and carefully collected MCI and AD databases such as those available from ADNI and NACC (22) than just viewing these subjects as “historical controls” in clinical trials. Thus, rather than using historical data for plain descriptive comparisons (see, e.g. 23), deriving predictive models for disease trajectories and endpoints from such data – models that can be used to simulate relevant outcomes of new MCI and AD patients samples adjusted for their baseline data - appears to be a more promising approach. Since the PGSA simulation model incorporates all sources of variation, it has been able to reproduce the distribution of observed outcomes.
What concrete applications can be foreseen for this proposed novel clinical study design? In our first publication on the PGSA (1) we suggested that the PGSA be preferably used in late stages of clinical drug development, and that PGSA-based studies may partly substitute for traditional long-term RPCTs. We maintain this proposition, but must add one more caveat: The results of the current analysis suggest that the longitudinal PGSA model (Table 5) tends to overestimate the cognitive decline of untreated aMCI subjects, and thus carries some risk of providing wrongly positive results of treatment studies. This risk obviously increases when interventions with only marginal effects are tested, as seems to be the case with some current developments (24, 25). As a consequence, one either has to wait until more effective interventions become available for long-term trials, or one will have to resort to so-called enriched (26) or even very high-risk patient samples (27) where ethical concerns may render long-term placebo exposure of patients very difficult.
RPCTs of adequate size and duration are and will remain as the pivotal elements in some critical phases of clinical drug development programs, because only an RPCT can provide unbiased information on the efficacy, safety and tolerability of a new treatment. On the other hand, RPCTs have their serious limitations, too, and not all clinical studies in late stages of drug development need to be RPCTs. Trials using the PGSA can provide important supportive evidence of a new drug’s effectiveness from large numbers of persons with a diagnosis of aMCI or prodromal AD who – for whatever reasons – decline or have to be excluded from participation in RPCTs.
Conclusions
The NACC aMCI data set used in this validation study is about 3 times larger and less narrowly defined than the ADNI 1 MCI data set, and not all neuropsychological tests included in the NP-Batt9 for ADNI 1 are contained in the NTB-7 defined for NACC. Despite these differences, an algorithm comprising a small number of demographic, biological, neuropsychological and clinical variables routinely available at the outset of studies, notably cognitive performance at baseline, is able to forecast the average trajectory of cognitive decline in the subsequent three years in 3 independent aMCI subsamples from the NACC database. One notes some small, monotonously increasing over-estimation of cognitive decline, which might result in wrongly positive outcomes when applying the PGSA algorithm in studies with only marginally effective drugs. Practical measures how to deal with this risk in future intervention trials are described. It is suggested to use the PGSA as part of late stage anti-AD drug development programs where ethical problems may arise with prolonged placebo treatment.
Acknowledgments
We are most grateful to the staff members of the US National Alzheimer Coordinating Center (22) for their continuous help with the NACC database (Grant U01 AG016976). Data collection and sharing for parts of this project was funded by the Alzheimer’s Disease Neuroimaging Initiative (ADNI) (National Institutes of Health Grant U01 AG024904). ADNI is funded by the National Institute on Aging, the National Institute of Biomedical Imaging and Bioengineering, and through generous contributions from the following: Abbott, AstraZeneca AB, Bayer Schering Pharma AG, Bristol-Myers Squibb, Eisai Global Clinical Development, Elan Corporation, Genentech, GE Healthcare, GlaxoSmithKline, Innogenetics, Johnson and Johnson, Eli Lilly and Co., Medpace, Inc., Merck and Co., Inc., Novartis AG, Pfizer Inc, F. Hoffman-La Roche, Schering-Plough, Synarc, Inc., as well as non-profit partners the Alzheimer’s Association and Alzheimer’s Drug Discovery Foundation, with participation from the U.S. Food and Drug Administration. Private sector contributions to ADNI are facilitated by the Foundation for the National Institutes of Health (www.fnih.org). The grantee organization is the Northern California Institute for Research and Education, and the study is coordinated by the Alzheimer’s Disease Cooperative Study at the University of California, San Diego. ADNI data are disseminated by the Laboratory for Neuro Imaging at the University of California, Los Angeles. This research was also supported by NIH grants P30 AG010129, K01 AG030514, and the Dana Foundation.
Abbreviations
- AD
Alzheimer Disease
- ADC
Alzheimer Disease Center
- ADAScog
Alzheimer Disease Assessment Scale cognitive
- ADNI
Alzheimer Disease Neuroimaging Initiative
- AIC
Akaike Information Criterion
- aMCI
amnestic mild cognitive impairment
- ApoE4
Apolipoprotein Epsilon 4
- AVLT
Auditory Verbal Learning test
- BL
Baseline
- BMI
Body Mass Index
- CDR-SB
Clinical Dementia Rating sum of boxes
- FAQ
Functional Assessment Questionnaire
- max
Maximum
- MCI
Mild Cognitive Impairment
- min
Minimum
- MMSE
Mini-Mental Status Examination
- NACC
National Alzheimer’s Coordinating Center
- NIA
National Institute on Aging
- NTB
Neuro-Psychological Battery
- obs
observed
- PGSA
Placebo Group Simulation Approach
- R&D
Research & Development
- RPCT
Randomized Placebo-Controlled Trial
- SD
Standard Deviation
- sim
simulated
- UDS
Uniform Data Set
- WAIS,
Wechsler Adult Intelligence Scalse
- WMS
Wechsler Memory Scale
Biography
MB is Professor of Mathematics and Statistics, RheinAhrCampus Remagen, University of Applied Sciences, Koblenz Germany. He acts as Consultant for study design and statistics at the Memory Clinic, Dept. of Geriatrics, Basel University Hospital. WAK is Professor of Epidemiology at the University of Washington, Seattle Washington. He is also Director and Principal Investigator of the National Alzheimer’s Coordinating Center, funded as a Cooperative Agreement from the National Institute on Aging [U01 AG016976]. SEM is a research scientist at the National Alzheimer’s Coordinating Center, funded as Cooperative Agreement from the National Institute on Aging [U01 AG016976]. ARM is Professor of Internal Medicine at the University of Basel Hospital. He is owner and CEO of diagene Laboratories Inc., in Reinach Switzerland. AUM is Professor of Psychology at the University of Basel and Director of the Memory Clinic, Dept. of Geriatrics, Basel University Hospital. RS is Professor emeritus of Clinical Psychology at the University of Basel. Till end 2003 he worked in Clinical R&D at Novartis Pharma in Basel. He acts as Senior Scientific Consultant at the Memory Clinic, Dept. of Geriatrics, Basel University Hospital.
Appendix. Information on the NACC Database
The Alzheimer’s disease centers (ADC) who send data to NACC must send those data on all subjects who are enrolled in the ADC Clinical Core regardless of being a control or having a specific diagnosis, so these are best characterized as a clinical case series, relatively unselected except through self-selection to participate. Each of these NACC subjects is given a fully standardized examination and diagnosis very similar to the examination in ADNI; they are followed and re-examined annually with the same exam protocol.
Researchers using data usually apply their own selection (inclusion/exclusion) criteria to the overall available NACC database to obtain relatively homogeneous comparison or study groups. ADNI subjects were selected into ADNI only if they met ADNI inclusion/exclusion criteria. Thus, MCI subjects may be selected from the overall NACC database, as all those who at their last visit met criteria (e.g., Petersen) for MCI; or, for whom longitudinal test scores could be reported from first diagnosis of MCI until last available follow-up examination. While the MCI diagnostic criteria are essentially the same as ADNI, subjects are selected into ADNI like they would be into a clinical trial. In contrast, NACC receives all subjects enrolled at ADC and researchers select into their own comparison groups. NACC collects data on which drugs are used by patients at each annual visit but does not restrict any subject from participating based on medications.
A further description of the NACC and the data collected on each subject please see https://www.alz.washington.edu. NACC and ADNI differ substantially in sheer size of the enrollment. Initially ADNI enrolled ~800 subjects, whereas NACC includes ~27,000, the numbers continue to grow and these subjects are re-examined annually until they discontinue or die. Because UDS enrollment began in 2005, and accrued prospectively, some subjects may have only an initial visit and others may have 6 or 7 follow-up visits. The 29 ADC Centers comprise the full complement of National Institute on Aging, Alzheimer’s Disease Centers Program which contributed data to NACC. The number of Centers with data may vary slightly over the years because some Centers will remain funded and others will not be.
Footnotes
Competing Interests: MB, ARM, AUM and RS are founders and owners of a small business that offers services to drug companies and CROs based on the PGSA. WAK and SEM declare no conflict of interest.
Authors’ contributions: MB developed the mathematical models underlying the PGSA. WAK and SEM were instrumental in making the NACC database available and answered many technical queries. ARM and AUM made important contributions to the development of the PGSA and to the current manuscript. RS is the originator of the principle of the PGSA and wrote major parts of the manuscript.
Ethical standards: Research using NACC data was approved by the University of Washington Institutional Review Board.
References
- 1.Spiegel R, Berres M, Miserez AR, Monsch AU. For debate: substituting placebo controls in long-term Alzheimer’s prevention trials. Alzheimer’s Research & Therapy. 2011;3:9–20. doi: 10.1186/alzrt68. [DOI] [PMC free article] [PubMed] [Google Scholar]
- 2.Albert MS, DeKosky ST, Dickson D, Dubois B, Feldman HH, Fox NC, Gamst A, Holtzman DM, Jagust WJ, Petersen RC, Snyder PJ, Carrillo MC, Thies B, Phelps CH. The diagnosis of mild cognitive impairment due to Alzheimer’s disease: Recommendations from the National Institute on Aging-Alzheimer’s Association workgroups on diagnostic guidelines for Alzheimer’s disease. Alzheimer’s & Dementia. 2011;7:270–279. doi: 10.1016/j.jalz.2011.03.008. [DOI] [PMC free article] [PubMed] [Google Scholar]
- 3.Aisen PS, Andrieu S, Sampaio C, Carrillo M, Khachaturian ZS, Dubois B, Feldman HH, Petersen RC, Siemers E, Doody RS, Hendrix SB, Grundman M, Schneider LS, Schindler RJ, Salmon E, Potter WZ, Thomas RG, Salmon D, Donohue D, Bednar MM, Touchon J, Vellas B. Report of the task force on designing clinical trials in early (predementia) AD. Neurology. 2011;76:280–286. doi: 10.1212/WNL.0b013e318207b1b9. [DOI] [PMC free article] [PubMed] [Google Scholar]
- 4.Guideline E10 on Choice of Control Group and Related Issues in Clinical Trials; International Conference on Harmonisation of Technical Requirements for Registration of Pharmaceuticals for Human Use; 20 July 2000. [Google Scholar]
- 5.Cummings J, Gould H, Zhong K. Advances in designs for Alzheimer’s disease clinical trials. American Journal of Neurodegenerative Diseases. 2012;1:205–216. [PMC free article] [PubMed] [Google Scholar]
- 6.Weiner MW, Veitch DP, Aisen PS, Beckett LA, Cairns NJ, Green RC, Harvey D, Jack CR, Jagust W, Enchi Liu, Morris JC, Petersen RC, Saykin AJ, Schmidt ME, Shaw L, Siuciak JA, Soares H, Toga AW, Trojanowski JQ. The Alzheimer’s Disease Neuroimaging Initiative: A review of papers published since its inception. Alzheimer’s & Dementia. 2011;7:1–67. [Google Scholar]
- 7.Aisen PS, Petersen RC, Donohue MC, Gamst A, Raman R, Thomas RG, Walter S, Trojanowski JQ, Shaw LM, Beckett LA, Jack CR, Jagust W, Toga AW, Saykin AJ, Morris JC, Green RC, Weiner MW the Alzheimer’s Disease Neuroimaging Initiative (2010) Clinical core of the Alzheimer’s disease neuroimaging initiative: Progress and plans. Alzheimer’s & Dementia. 2010;6:239–246. doi: 10.1016/j.jalz.2010.03.006. [DOI] [PMC free article] [PubMed] [Google Scholar]
- 8.Alzheimer’s Disease Neuroimaging Initiative. http://www.loni.ucla.edu/ADNI.
- 9.Weintraub S, Salmon DS, Mercaldo N, Ferris S, Graff-Radford NR, Chui H, Cummings J, DeCarli Ch, Foster NL, Galasko D, Peskind E, Dietrich W, Beekly DL, Kukull WA, Morris JC. The Alzheimer’s Disease Centers’ Uniform Data Set (UDS) The Neuropsychologic Test Battery. Alzheimer Disease Associated Disorders. 2009;23:91–101. doi: 10.1097/WAD.0b013e318191c7dd. [DOI] [PMC free article] [PubMed] [Google Scholar]
- 10.Hayden KM, Jones RM, Zimmer C, Plassman BL, Browndyke JN, Pieper C, Warren LH, Welsh-Bohmer KA. Factor Structure of the National Alzheimer’s Coordinating Centers Uniform Dataset Neuropsychological Battery. An Evaluation of Invariance Between and Within Groups Over Time. Alzheimer Disease Associated Disorders. 2011;25:128–137. doi: 10.1097/WAD.0b013e3181ffa76d. [DOI] [PMC free article] [PubMed] [Google Scholar]
- 11.Cedarbaum JM, Jaros M, Hernandez C, Coley N, Andrieu S, Grundman M, Vellas B the Alzheimer’s Disease Neuroimaging Initiative. Rationale for use of the Clinical Dementia Rating Sum of Boxes as a primary outcome measure for Alzheimer’s disease clinical trials. Alzheimer’s & Dementia. 2013;9 (Suppl):S45–S99. doi: 10.1016/j.jalz.2011.11.002. [DOI] [PubMed] [Google Scholar]
- 12.R Development Core Team. R. A Language and Environment for Statistical Computing. R Foundation for Statistical Computing; Vienna, Austria: 2011. url = http://www.R-project.org/ [Google Scholar]
- 13.Winblad B, Gauthier S, Scinto L, Feldman H, Wilcock GK, Truyen L, Mayorga AJ, Wang D, Brashear HR, Nye JS The GAL-INT-11/18 Study Group. Safety and efficacy of galantamine in subjects with mild cognitive impairment. Neurology. 2008;70:2024–2035. doi: 10.1212/01.wnl.0000303815.69777.26. [DOI] [PubMed] [Google Scholar]
- 14.Feldman HH, Ferris S, Winblad B, Sfikas N, Mancione L, He Y, Tekin S, Burns A, Cummings J, del Ser T, Inzitari D, Orgogozo JM, Sauer H, Scheltens P, Scarpini E, Herrmann N, Farlow M, Potkin S, Charles HC, Fox NC, Lane R. Effect of rivastigmine on delay to diagnosis of Alzheimer’s disease from mild cognitive impairment: the InDDEx study. Lancet Neurol. 2007;6:501–512. doi: 10.1016/S1474-4422(07)70109-6. [DOI] [PubMed] [Google Scholar]
- 15.Albert MS, DeKosky ST, Dickson D, Dubois B, Feldman HH, Fox N, Gamst A, Holtzman DM, Jagust WJ, Petersen RC, Snyder PJ, Carrillo MC, Thies B, Phelps CH. The diagnosis of mild cognitive impairment due to Alzheimer’s disease: recommendations from the National Institute on Aging–Alzheimer’s Association workgroups on diagnostic guidelines for Alzheimer’s disease. Alzheimers & Dementia. 2011;7:270–279. doi: 10.1016/j.jalz.2011.03.008. [DOI] [PMC free article] [PubMed] [Google Scholar]
- 16.Brodaty H. Sydney Memory and Ageing Study. Paper presented at the AAICAD 2011 meeting; Paris. July 16–21, 2011; p. Abstract F3-02-01.p. S486. [Google Scholar]
- 17.Roberts R. MCI Incidence, Progression to Dementia, and Reversion to Normal in a Population-Based Cohort: The Mayo Study of Aging. Paper presented at the AAICAD 2011 meeting; Paris. July 16–21, 2011; p. Abstract F3-02-02.p. S486. [Google Scholar]
- 18.Carter AF, Caine D, Burns A, Herholz K, Lambon Ralph MA. Staging of the cognitive decline in Alzheimer’s disease: insights from a detailed neuropsychological investigation of mild cognitive impairment and mild Alzheimer’s disease. International Journal of Geriatric Psychiatry. 2012;27:423–432. doi: 10.1002/gps.2738. [DOI] [PubMed] [Google Scholar]
- 19.Okello A, Koivunen J, Edison P, Archer HA, Turkheimer FE, Någren K, Bullock R, Walker Z, Kennedy A, Fox NC, Rossor MN, Rinne JO, Brooks DJ. Conversion of amyloid positive and negative MCI to AD over 3 years. An 11C-PIB PET study. Neurology. 2009;73:754–760. doi: 10.1212/WNL.0b013e3181b23564. [DOI] [PMC free article] [PubMed] [Google Scholar]
- 20.Vellas B, Pesce A, Robert PH, Aisen PS, Ancoli-Israel S, Andrieu S, Cedarbaum J, Dubois B, Siemers E, Spire JP, Weiner MW, May TS. AMPA workshop on challenges faced by investigators conducting Alzheimer’s disease clinical trials. Alzheimer’s & Dementia. 2011;7:109–117. doi: 10.1016/j.jalz.2010.05.2020. [DOI] [PubMed] [Google Scholar]
- 21.Grill JD, Karlawish J. Addressing the challenges to successful recruitment and retention in Alzheimer’s disease clinical trials. Alzheimer’s Research & Therapy. 2010;2:34–44. doi: 10.1186/alzrt58. [DOI] [PMC free article] [PubMed] [Google Scholar]
- 22.Beekly DL, Ramos EM, Lee WW, Deitrich WD, Jacka ME, Wu J, Hubbard JL, Koepsel TD, Morris JC, Kukull WA. The National Alzheimer’s Coordinating Center (NACC) Database: The Uniform Data Set. Alzheimer Disease Associated Disorders. 2007;21:249–258. doi: 10.1097/WAD.0b013e318142774e. [DOI] [PubMed] [Google Scholar]
- 23.Miller RG, Moore DH, Forshew DA, Katz JS, Barohn RJ, Valan M, Bromberg MB, Goslin KL, Graves MC, McCluskey LF, McVey AL, Mozaffar T, Florence JM, Pestronk A, Ross M, Simpson EP, Appel SH. Phase II screening of lithium carbonate in amyotrophic lateral sclerosis. Examining a more efficient trial design. Neurology. 2011;77:973–979. doi: 10.1212/WNL.0b013e31822dc7a5. [DOI] [PMC free article] [PubMed] [Google Scholar]
- 24.Doody RS, Thomas RG, Farlow M, Iwatsubo T, Vellas B, Joffe S, Kieburtz K, Raman R, Sun X, Aisen PS, Siemers E, Liu-Seifert H, Mohs R. Phase 3 trial of solanezumab for mild-to-moderate Alzheimer’s disease. The New England Journal of Medicine. 2014;370:311–321. doi: 10.1056/NEJMoa1312889. [DOI] [PubMed] [Google Scholar]
- 25.The A4 Study. [accessed May 2014];Homepage of ADCS. a4study.org.
- 26.McEvoy LK, Edland SD, Holland D, Hagler DJ, Roddey JC, Fennema-Notestine Ch, Salmon DP, Koyama AK, Aisen PS, Brewer JB, Dale AM. Neuroimaging enrichment strategy for secondary prevention trials in Alzheimer disease. Alzheimer Disease & Associated Disorers. 2010;24:269–277. doi: 10.1097/WAD.0b013e3181d1b814. [DOI] [PMC free article] [PubMed] [Google Scholar]
- 27.Moulder KL, Snider BJ, Mills SL, Buckles VD, Santacruz AM, Bateman RJ, Morris JC. Dominantly inherited Alzheimer Network: facilitating research and clinical trials. Alzheimer’s Research & Therapy. 2013;5:48–55. doi: 10.1186/alzrt213. [DOI] [PMC free article] [PubMed] [Google Scholar]