

Abstract
Objective
The Cox model is the dominant tool in clinical trials to compare treatment options. This model does not specify any specific form to the hazard function. On the other hand, parametric models allow the researcher to consider an appropriate shape of hazard function for the event of interest. The aim of this article is to compare performance of Cox and parametric models.
Methods
We used data collected in a prospective clinical trial that aimed to compare performance of nasal intermittent positive pressure ventilation (NIPPV) and nasal continuous positive airway pressure (NCPAP) treatments in terms of survival of newborn infants who had respiratory distress syndrome (RDS). Performance of Cox, exponential, Weibull, and log-logistic models were compared in terms of goodness of fit.
Findings
Fitting the Cox model, we have seen that infants who received NCPAP were 4.23 (Hazard Ratio= 4.23, 95% Confidence Interval: 1.87–9.59) times more likely to fail than those received NIPPV (P=0.001). Adequacy of the exponential model was rejected. We have seen a decreasing hazard rate over time, in both treatment groups. This decrease was sharper in NCPAP group. Akiake information criterion corresponded to the log-logistic model and was lower than all other models followed by Weibull model.
Conclusion
Our results demonstrate the benefit of parametric survival models over traditional Cox regression model in terms of modeling of shape of hazard function. We saw a decreasing hazard that confirms the flexibility of parametric models in terms of the modeling of hazard rate.
Keywords: Parametric Survival, Weibull, Infant Mortality, Respiratory Distress Syndrome
Introduction
Survival data is a term used for data measuring the time to some event[1]. The Cox model is the most widely used in clinical studies to characterize disease progression on existing cases by revealing the importance of covariates. The model assumes that the underlying hazard rate (rather than survival time) is a function of the independent variables multiplied to a baseline hazard function. No distributional assumption about the shape of hazard function is required[2]. Therefore Cox regression is known as a semi-parametric model. The basic assumption behind the Cox model is the Proportional Hazard (PH) assumption which indicates that the Hazard Ratio (HR) is a constant over time. This means that short benefit of a treatment would be translated into a long term benefit.
Cox regression model has been used frequently to address factors influence survival of infants. For example in a study in Nicaragua about infant mortality the Cox model was used[3]. Ronsmans implemented the Cox regression for modeling the Child Survival in Senegal[4]. In another study, the Cox proportional hazard models were used to adjust for potential confounding and to model potential effect modification for impact of supplementing newborn infants with vitamin A on early infant mortality in southern India[5].
In the field of survival analysis, several parametric models are available. Parametric models require distributional assumption, and allow the researcher to consider an appropriate shape of hazard function for the event of interest[6]. Parametric models can be presented as Accelerated Failure Time (AFT) and/or PH models. AFT and PH forms are applications for comparison of survival times and hazards respectively. Statistics that would be used are Acceleration Factor (AF) and HR.
The PH models present the data in terms of HR, while AFT models concentrate on survival time[7]. For example suppose one wishes to compare risk of cancer recurrence of patients received treatment to those who got placebo. A HR of 0.22 indicates that patients with treatment are 78% less likely to experience the recurrence. On the other hand, AF of 4.6 indicates that survival of those received treatment is stretched out by a factor of 4.6. This means that HR <1 and AF >1 shows that the variable has a protective effect.
Field on survival analysis is dominated by Cox PH model. However, in many applications clinical knowledge can guide selection of appropriate shape for hazard function. For example, in the case of infant mortality, it is reasonable to assume that the hazard of death decreases over time. Therefore, there is room to apply parametric models and to extract more details from the data.
The most commonly used parametric models are exponential, Weibull, and log logistic. The exponential and Weibull regression models can be considered as both the AFT and PH models but log logistic model can be presented only in AFT form[8]. Therefore, when data does not satisfy the PH assumption, log logistic model can be considered as an alternative for Cox PH model. The aim of this article is to address practice of commonly used parametric survival models. To do so, we used data from a clinical trial study in the field of infant mortality data.
Subjects and Methods
Patients
We used data collected in a prospective clinical trial that was conducted in a level IIIneonatal unit. The aim of the study was to compare performance of two treatment options in terms of survival of newborn infants who had Respiratory Distress problems. Treatments compared were nasal continuous positive airway pressure (NCPAP) and nasal intermittent positive pressure ventilation (NIPPV).
We allocated 60 patients to each treatment arm. Only infants with gestational aged 28 to 36 week were approached.
Samples were taken from Afzalipour neonatal intensive care unit (affiliated to Kerman University of Medical Sciences). The infants in the NCPAP group received initially 5cm of water and flow 6–7 liters/min. The maximum allowable settings were CPAP 7 cmH2O and fraction of inspired oxygen (FiO2) 0/6. The infants in NIPPV (NCPAP+) group were initiated on peak inspiratory pressure (pc + PEEP) 11 cm of water, peak and expiratory pressure (PEEP) 5 cm of water, I:E 1:5.7 and flow 6–7 liters/min and rate of 15 per minute. The maximum permissible PEEP used was 7 cm of water and FiO2 was 0/6. Targeted saturation was 88%–92%. Settings in both groups were adjusted based on arterial blood gases (ABG) and pulse oximetry.
Success was defined if the respiratory distress improved and the baby could be weaned off NCPAP or NIPPV. Event medical ventilator (Inspiration LS infant, Ireland) was used for both treatment groups via nasopharyngeal prongs.
Gestational age of the preterm infants admitted to Afzalipour neonatal intensive care was between 28 and 36 weeks and had respiratory distress. Also Silverman-Anderson retraction score of 6 and 7 of the infants were included.
Infants who had significant morbidity symptoms (i.e. those with cardiac disease - not including patent ductus arteriosus, congenital malformations including congenital diaphragmatic hernia, tracheoesophageal fistula and cleft lip/palate, cardiovascular or respiratory instability because of sepsis, anemia or severe intraventricular hemorrhage (IVH) on admission), were not included in the study.
Randomization method
It is known that gender and birth weight have great impact on survival rate of infants in neonatal units. Therefore, for allocation of infants to treatment arms we implemented minimization of approach that balances the distribution of these two confounders in treatment groups.
Outcome and independent variables
Survival was defined as duration between birth time and treatment failure. The main independent variable was treatment (NCPAP vs NIPPV). Other variables that enrolled the multifactorial model, as potential confounders, were gestational age (week), type of delivery, steroid use, and surfactant use.
Statistical analysis
We fitted the Cox PH as the basic model. To test whether PH assumption was hold, test of interaction term with time was performed [9]. A series of parametric models were then developed as follows. Exponential model was fitted in AFT and PH forms. This model assums that the hazard rate is constant over time: h(t) = λ
On the other hand the Weibull model allows more flexibility in modeling of hazard function. This model can be used to present monotonic hazard function (increasing or decreasing). The general form of hazard function is expressed as:
Here, parameter P is known as shape parameter. Values >1 indicate increasing hazard over time. Values <1 indicate decreasing hazard across time[10]. It has been shown that plot of logarithm of minus logarithm of survival function versus logarithm of time (ln (-ln(S (t))) vs ln (t)) provides a graphical test that the data follow the Weibull distribution. Parallel straight lines indicate that both PH and AFT assumptions are satisfied. In addition, exponential model is a special case of Weibull model if P=1. Therefore, test of P=1 was used to investigate the necessity of Weibull regression model. The log logistic model was fitted only in AFT form[11]. The general form of the hazard function is:
The log-logistic model can be used to model both monotonic and non-monotonic shapes of hazard function. P is the shape of parameters where values <1 indicate decreasing hazard function. On the other hand, values >1 indicate that the hazard rate increases to a peak and then decreases over time[11]. Plot of logarithm of survival odds versus logarithm of time (ln (ln ((S (t)/1-S (t)) vs ln (t)) provides graphical assessment of AFT assumption[6].
All regression models were fitted using ENTER method. Models were compared in terms of goodness of fit (Akiake Information Criterion (AIC)). The lower the AIC, the better the fit is. All analyses were performed using Stata software. The level of significance for all tests is 0.05. The study protocol was adopted by the university ethics committee of Kerman University of Medical Sciences. Informed consent of the parents, before entering their infant in the study was obtained.
Ethical consideration
The study protocol was approved by local ethical committee of Kerman University of Medical Sciences. Registry code K/90/328 and Ethical Approval document is IRCT201202273250N6. All the parents signed informed consent before participating in the study. CONSORT flow Diagram for clinical trial papers is shown in Fig. 1
Fig. 1.

CONSORT Flow Diagram
Findings
Mean (standard deviation) gestational age in NIPPV and NCPAP groups was 32.17 (2.1) and 32.05 (2.9) respectively. Nearly 44% of patients were candidate for surfactant use (48% in NIPPV and 40% in NCPAP group). In addition, more than two thirds of patients had received steroid, and three-forths of infants were born by cesarean section. No difference between groups was seen in terms of surfactant use, steroid use, type of delivery, gender, and gestational age (Table 1).
Table 1.
Comparison of background characteristics of patients in NIPPV and NCPCP groups
| Variable | Treatment | NIPPV Frequency (%) |
NCPAP Frequency (%) |
P-value |
|---|---|---|---|---|
| Surfactant use | Yes | 29 (48.3) | 24 (40.0) | 0.4 |
| No | 31 (51.7) | 36 (60.0) | ||
| Steroid use | Yes | 50 (83.3) | 44 (73.3) | 0.2 |
| No | 10 (16.7) | 16 (26.7) | ||
| Type of delivery | Cesarean Section | 49 (81.7) | 42 (70.0) | 0.2 |
| Normal Vaginal | 11 (18.3) | 18 (30.0) | ||
| Gender | Boy | 32 (53.3) | 31 (51.7) | 0.8 |
| Girl | 28 (46.7) | 29 (48.3) | ||
| Gestational age | Mean (SD) | 32.17 (2.1) | 32.05 (2.9) | 0.8 |
SD: Standard Deviation; NIPPV: Nasal Intermittent Positive Pressure Ventilation; NCPAP: Nasal Continuous Positive Airway Pressure
Applying the test of interaction with time tests, the PH assumption holds for all variables (data not shown). Fitting the Cox model, we have seen that infants who received NCPAP were 4.23 (95% C.I: 1.87–9.59) times more likely to fail than those that received NIPPV (P=0.001). This model provided the highest AIC value at 294.9 (Table 2).
Table 2.
Estimation of Hazard Ratio for treatment at each model
| Exponential (PH) |
Exponential (AFT) |
Weibull model (PH) |
Weibull model (AFT) |
Log logistic model (AFT) |
Cox (PH) |
|
|---|---|---|---|---|---|---|
| HR | 4.6 (2, 10.58) |
- | 4.43 (1.94-10.12) |
- | - | 4.23 (1.84-9.59) |
| AF | - | 0.22 (0.09, 0.50) | - | 0.12 (0.03-0.44) |
0.14 (0.05-0.41) |
- |
| P. Value | <0.001 | <0.001 | <0.001 | 0.002 | <0.001 | 0.001 |
| AIC | 229.36 | 225.17 | 217.97 | 294.9 |
PH: Proportional Hazard, AFT: Acceleration Factor Time, HR: Hazard Ratio, AF: Accelaration Factor
Fitting the PH exponential model, the estimated hazard rate of failure for infants received NCPAP and NIPPV were estimated at 0.06 and 0.013 respectively (Fig. 2, top panel). These rates were constant over time and gave HR at 4.60 (95% C.I: 2.00-10.58) with P<0.001. Fitting the AFT form, the AF was estimated at 0.22 which indicates that survival time of infants that received NCPAP was 0.22 (95% C.I: 0.09-0.50) times that of those who got NIPPV (Table 2).
Fig. 2.
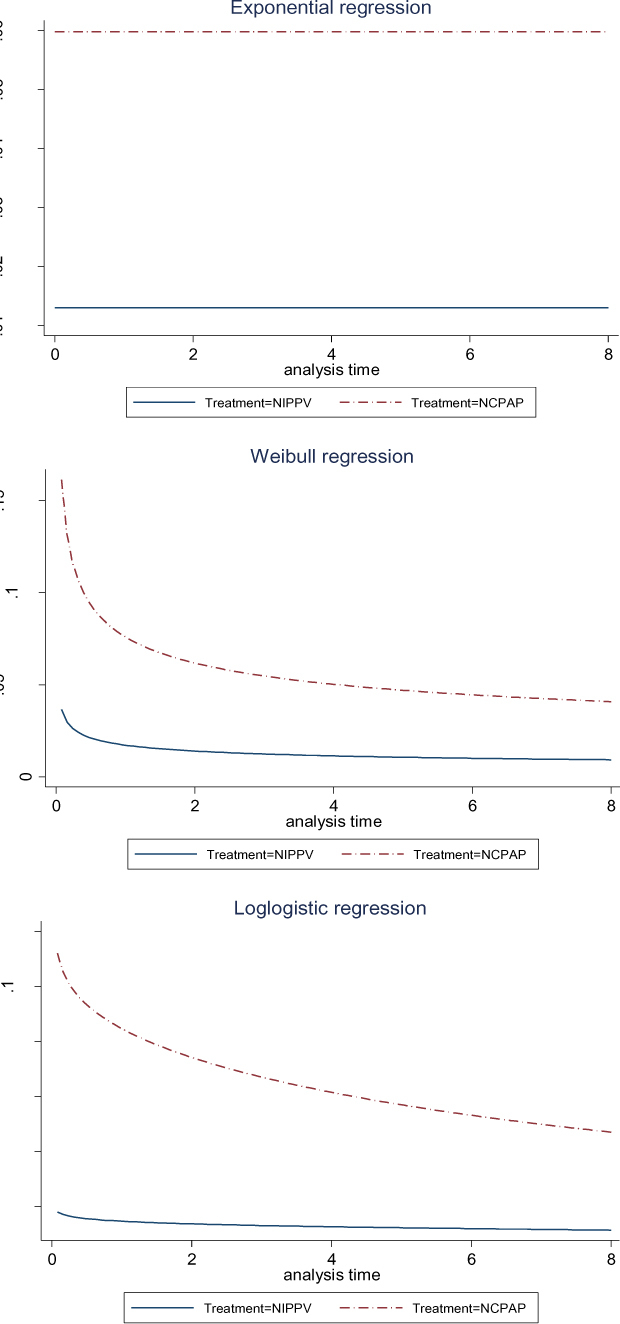
Plot for hazard ratio applying Exponential (top panel), Weibull (middle panel), and log-logistic (bottom panel) distributions
In the next step, Weibull regression model was fitted. Equality of P with one was highly rejected with P <0.001. This suggested that the exponential model was not an appropriate choice. Fig. 3 suggests that AFT assumption was hold by the data. Fig. 2 middle panel clearly suggested a decreasing hazard rate over time, in both groups. This decrease was sharper in NCPAP group, as the hazard rate in this group at the start was around 4 times higher. HR and AF corresponding to Weibull models were 4.43 (95% C.I: 1.94–10.12) and 0.12 (95% C.I: 0.03-0.44) respectively, which were highly significant. The AIC for this model was lower than Cox and exponential models.
Fig. 3.

Plot of the log negative log Kaplan-Meier survival estimates against the log of time
Fitting log-logistic AFT model, we estimated AF at 0.14 (95% C.I: 0.05-0.41) which was highly significant. This indicates that survival time of infants that received NCPAP was 0.14 times that of those who got NIPPV. Fig. 2 middle panel shows decreasing risk in NCPAP group. Hazard rate in NIPPV group was much lower than in NCPAP group, from the first hour. AIC corresponding the log-logistic model was lower than all other models.
Discussion
Our results demonstrate the benefit of parametric survival models, over traditional Cox regression model, in terms of modeling of shape of hazard function. Several studies applied the traditional Cox proportional hazard model for infant mortality[3,12–13]. However, plotting hazard rate functions, we clearly saw decreasing hazard of treatment failure. In many situations the use of the parametric models is more effective than the Cox model[14], as such models allow flexibility in modeling of hazard rate. In addition, they provided AF which compares survival times across treatment arms[15].
In our study, the performance of the log logistic model was superior to all other semiparametric and parametric models in terms of AIC. After that, performance of the Weibull model was better than other approaches.
Application of parametric survival models in the analysis of infant and child morbidity has been addressed by other authors. In a study in Kenya the Weibull model was used to explore tha factors that govern the child mortality. It has been shown that the biodemographical factors, relative to socioeconomic and sociocultural factors, were much important in explaining infant mortality[16]. In another study in Nigeria relationship of low birth weight and other factors on infant mortality were estimated using Weibull hazard function. A strong inverse association between low birth weight and infant survival has been seen[17].
Another aspect of our work was to compare two treatment options in management of newborn infants. We have seen that NIPPV was more successful than NCPAP in terms of reduction of rate of endotracheal ventilation. In the Weibull and log logistic models the difference was more obvious. Especially at the initial time in the NCPPV group the risk of failing is high. This suggests that the appropriate management of infants in the first hours is crucial.
Acknowledgment
The authors wish to thank the personals of NICU of Afzalipour hospital, affiliated to Kerman University of Medical Sciences, for their assistance
Conclusion
Our experience suggests that the parametric survival models are not popular among researchers. However, such models might provide better fit and extract more details about benefits of treatment options. We do recommend application of parametric models as well as standard Cox model, to make the most use of the data.
Authors’ Contribution
Concept and design: M.R. Baneshi, B. Bahmanbijari
Acquisition of the data: B. Bahmanbijari, R. Mahdian
Data analysis and interpretation: M.R. Baneshi, R. Nikbakht, S. Haji-Maghsoudi
Manuscript preparation: All authors
Critical revision of the manuscript: M.R. Baneshi, B. Bahmanbijari
All authors approved final version of the manuscript
Conflict of Interest
None
References
- Hougaard P.Fundamentals of survival data. Biometrics 1999; 55(1):13–22. [DOI] [PubMed] [Google Scholar]
- Ahmed FE, Vos PW, Holbert D. Modeling survival in colon cancer: a methodological review. Mol Cancer 2007; 6:15. [DOI] [PMC free article] [PubMed] [Google Scholar]
- Peña R, Wall S, Persson LA. The effect of poverty, social inequity, and maternal education on infant mortality in Nicaragua, 1988–1993. Am J Public Health 2000; 90(1):64–9. [DOI] [PMC free article] [PubMed] [Google Scholar]
- Ronsmans C.Birth spacing and child survival in rural Senegal. Int J Epidemiol 1996. 25(5):989–97. [DOI] [PubMed] [Google Scholar]
- Rahmathullah L, Tielsch JM, Thulasiraj RD, et al. Impact of supplementing newborn infants with vitamin A on early infant mortality: community based randomised trial in southern India. BMJ 2003; 327(7409):254. [DOI] [PMC free article] [PubMed] [Google Scholar]
- Kleinbaum, DG.Klein M.Survival Analysis.2nd ed. New York: Springer; 2005; Pp: 260–270. [Google Scholar]
- Hernán MA, Cole SR, Margolick J, et al. Structural accelerated failure time models for survival analysis in studies with time‐varying treatments. Pharmacoepidemiol Drug Saf 2005;14(7):477–91. [DOI] [PubMed] [Google Scholar]
- Orbe J, Ferreira E, Núñez-Antón V.Comparing proportional hazards and accelerated failure time models for survival analysis. Stat Med 2002;21(22): 3493–510. [DOI] [PubMed] [Google Scholar]
- Hess KR.Assessing time‐by‐covariate interactions in proportional hazards regression models using cubic spline functions. Stat Med 1994;13(10):1045–62. [DOI] [PubMed] [Google Scholar]
- Kiefer NM. Economic duration data and hazard functions. J Economic Literature 1988;26(2):646–79. [Google Scholar]
- Hosmer Jr, DW, Lemeshow S, May S.Applied survival analysis: regression modeling of time to event data. Hoboken, NJ: Wiley-Interscience; 2011; Pp: . [Google Scholar]
- Cobra C1, Muhilal, Rusmil K, et al. Infant survival is improved by oral iodine supplementation. J Nutr 1997; 127(4):574–8. [DOI] [PubMed] [Google Scholar]
- Kristensen I, Aaby P, Jensen H, et al. Routine vaccinations and child survival: follow up study in Guinea-Bissau, West Africa Commentary: an unexpected finding that needs confirmation or rejection. BMJ 2000; 321(7274):1435–8. [DOI] [PMC free article] [PubMed] [Google Scholar]
- Carroll KJ. On the use and utility of the Weibull model in the analysis of survival data. Control Clin Trials 2003;24(6):682–701. [DOI] [PubMed] [Google Scholar]
- Blossfeld, H-P, Rohwer G. Techniques of event history modeling: new approaches to causal analysis Mahwah, NJ: Lawrence Erlbaum; 1995. [Google Scholar]
- Omariba, DWR., Beaujot R, Rajulton F. Determinants of infant and child mortality in Kenya: an analysis controlling for frailty effects. Population Research and Policy Review 2007;26(3):299–321. [Google Scholar]
- Uthman OA. Effect of low birth weight on infant mortality: analysis using Weibull hazard model. Int J Epidemiol 2008;6(1):8. [Google Scholar]