Abstract
The microclimate pH (μpH) distribution inside poly(lactic-co-glycolic acid) (PLGA) microspheres was monitored quantitatively over an acidic range as a function of several formulation variables. A ratiometric method by confocal laser scanning microscopy with Lysosensor yellow/blue® dextran was adapted from those previously reported, and μpH distribution kinetics inside PLGA microspheres was examined during incubation under physiologic conditions for 4 weeks. The effects of polymer molecular weight (MW) and lactic/glycolic acid ratio, microspheres size and preparation method, and polymer blending with poly(ethylene glycol) (PEG) were evaluated. The μpH kinetics was accurately sensed by the dye over a broadly acidic range (2.8 < μpH < 5.8) to compliment our previously reported method detecting neutral μpH. μpH was found be more acidic and variable inside PLGA with lower MW and lactic/glycolic acid ratio during incubation for 4 weeks. A more acidic environment was found in larger size microspheres with lower MW polymers, but microsphere size effects for lactic-rich polymers were not significant during 4 weeks. Importantly, PLGA 50/50 microspheres prepared by the oil-in-oil emulsion method were less acidic than those microspheres prepared by double emulsion, and blending PLGA 50/50 with 20% PEG increased μpH significantly with most aqueous pores exhibiting a pH > 5 throughout the incubation period. Hence, coupling this method with that previously developed with a neutral pH-sensitive dye, SNARF-dextran (5.8 – 8.0), should provide us in the future with microclimate pH mapping over the entire useful pH range (2.8–8.0) for optimization of PLGA delivery of pH-sensitive bioactive substances.
Keywords: Microclimate pH, Confocal laser scanning microscopy, Poly(lactic-co-glycolic acid), Microspheres, pH distribution, Poly(ethylene glycol)
Introduction
With the tremendous growth of biotechnology and the recent explosion of human genomic information, protein drugs are being developed at a fascinating rate. In order to eliminate the inconvenience of repeated injections, enhance their therapeutic effect, and increase patient compliance, poly(lactic-co-glycolic acid) (PLGAs), as biodegradable and biocompatible polymers, approved in numerous products by the US Food and Drug Administration,(1) have been extensively investigated as carriers for controlled delivery of peptides, proteins, and vaccine antigens.(2–8) However, due to the extended time of bioerosion of PLGA, insufficient stability of encapsulated bioactive substances during their release has been a principal obstacle for successful development of PLGA delivery systems.(9–12) Although it has long been recognized that a low pH can exist in PLGA delivery systems during incubation as a result of acidic polymer impurities and the build-up of acidic polymer degradation products,(1, 13–15) the acidic microclimate pH (μpH) has been definitely implicated only recently as a principal stress for the instability of encapsulated acid-labile proteins.(1, 9, 16) Controlling μpH by co-encapsulation of poorly soluble bases in the polymer system improved protein stability and release kinetics, as demonstrated in studies with bone morphogenetic protein-2,(16) basic fibroblast growth factor,(16) tetanus toxoid,(17) and tissue plasminogen activator.(18) Therefore, quantification of μpH and elucidation of important factors affecting μpH in polymer system are critical for furthering our understanding of PLGA delivery systems, and developing μpH control methodologies in formulation design.
Several techniques have been examined to quantify μpH in PLGA matrix, including 31P nuclear magnetic resonance (NMR),(19) electron paramagnetic resonance (EPR),(20) potentiometry,(21) and confocal fluorescence microscope imaging.(13, 22, 23) Besides the fact that the first three techniques can only provide the general picture of μpH, the NMR method was limited by the possibility and extent of 31P penetration through polymer matrix(19) and EPR relied on the mobility of spin-labeled protein that may be affected by viscosity changes in the microenvironment. Although potentiometric measurements can rapidly determine pH inside polymer electrode-coating films,(21) the correlation between pH measured between electrode surface and polymer coating and smaller size systems such as microspheres may be difficult, due to the unique microstructure and transport characteristics inside microspheres.
Confocal fluorescence microscope imaging, on the other hand, can directly visualize μpH details in small size polymer device such as microspheres by encapsulation with pH-sensitive probes. However, due to the effect of concentration on measured fluorescence intensity and the inconsistent distribution of dye concentration in aqueous pores, the methods of encapsulation of fluorescein by Shenderova et al.(13) was only semi-quantitative. In order to eliminate the concentration effect and measure acidic pH, Fu et al.(22) encapsulated two dextran conjugated dyes SNARF and NERF, and the images at two emission wavelength were taken and their intensity ratio was calculated and correlated with μpH. However, both of the dyes emitted in the green range (535 nm for NERF and 580 nm of SNARF), giving rise to poor resolution without a narrow bandwidth detector. Because of the high noise-to-signal ratio from the ratio images, the prediction of pH is also expected to be semi-quantitative. Recently, our group described the development of a ratiometric measurement by encapsulation of dextran-SNARF conjugates, which provided accurate pH maps in the neutral pH range (5.8 < μpH < 8.0).(23)
PLGA microspheres have been studied extensively during past two decades, for example, development of leuprolide acetate(24) (Lupron Depot®, Takeda Chemical) and human growth hormone(6) (Nutropin Depot®, Genetech). The advantage of direct subcutaneous or intramuscular injection without the surgical need of inserting implants and device removal after use, has made PLGA microspheres a particularly ideal delivery system. It has been found that besides other variables, polymer composition (i.e., lactic/glycolic acid ratio) (25) and molecular weight,(26) preparation method,(27) and blending with other polymers(28) all play the important roles in affecting protein release and stability from PLGA microspheres. Concomitantly, during these experiments, pH of the outside incubation medium was commonly monitored, and often found to decrease,(27, 28) suggesting acid liberation rate and μpH kinetics in the polymer can be altered by formulation variables to affect drug stability and release.
However, release media pH changes are only indirect reflections of μpH, and formulation design until now has suffered due to a lack of accurate measurement of the acidic μpH distribution kinetics. Therefore, in this study, we have expanded our neutral scale pH mapping (pH 5.8 – 8.0 (23)) and directly quantified acidic μpH (2.8 – 5.8) distribution inside PLGA microspheres noninvasively as a function of important formulation variables. With the obtained knowledge, we hope to not only further improve the understanding of μpH development and future theoretical analysis and validation, but also to provide a solid basis for future formulation design and estimation of protein instability pathways.
Materials and Methods
Materials
Poly(D,L-lactic-co-glycolic acid), end capped, 50/50 with an inherent viscosity (i.v.) of 0.2 and 0.6 dl/g, and 85/15 and 100/0 (both i.v. = 0.6 dl/g) were generously provided by Alkermes Inc. (Cambridge, MA). The fluorescent pH sensitive probe Lysosensor yellow/blue® dextran (MW = 10 kDa) was purchased from Molecular Probes (Eugene, OR). Poly(ethylene glycol) (PEG, MW = 17kD) was purchased from Sigma-Aldrich (Fluka) (St. Louis, MO) and poly(vinyl alcohol) (PVA, 9–10 kD, 80% hydrolyzed) was from Polysciences (Warrington, PA). All other chemicals were of analytical grade or higher and purchased from commercial suppliers.
Preparation of PLGA microspheres encapsulated with acidic pH sensitive probe
Dextran (MW = 10 kD) conjugated Lysosensor yellow/blue® as an acidic pH-sensitive probe was encapsulated in PLGA microspheres either by w/o/w or o/o solvent evaporation/extraction microencapsulation methods. In the w/o/w method, 100 μl dye solution was added to PLGA 50/50 (300 mg/ml for i.v. = 0.6 dl/g, 700 mg/ml for i.v. = 0.2 dl/g) or PLGA 85/15 or 100/0 (300 mg/ml) in CH2Cl2 solutions. The mixture was homogenized (Virtis IQ2, Gardiner, NY) at 7,500 or 5,000 rpm for 1 min in order to prepare microspheres with different sizes, and then 1 ml of 2% PVA solution was immediately added. After vortex, the final emulsion was poured into 100 ml of 0.5% PVA solution under stirring and hardened for 5 h at room temperature. The hardened microspheres were sieved and washed by water for three times, and then collected by centrifugation followed by lyophilization on a Labconco freeze dryer (Kansas City, MO) for 72 h. In the o/o method, the dye powder was prepared by dissolving dye in double distilled water and then followed by freeze-drying. The freeze-dried dye powder was suspended in PLGA 50/50 (i.v = 0.6 dl/g, 300 mg/ml or i.v. = 0.2 dl/g, 500 mg/ml) in acetonitrile solution, and homogenized at 5,000 rpm for 2 min. Then the mixture was added dropwise to 100 ml cottonseed oil containing 5% span 85 and hardened under stirring at 750 rpm at room temperature. After 5 hr, 100 ml petroleum ether (bp, 50–100°C) was added to cottonseed oil bath to further extract the remaining acetonitrile. After the additional 15 min of stirring, the microspheres were sieved, washed with petroleum ether, and lyophilized as described above. In some cases, PEG was added to the PLGA (50/50)/acetonitrile solution at 20% (w/w of PEG/PLGA).
Confocal laser scanning microscopy for microspheres imaging
A ratiometric method based on imaging with a Carl Zeiss LSM 510 confocal laser scanning microscope (CLSM, Carl Zeiss Microimaging, Inc., Thornwood, NY) was developed to map the microclimate pH distribution inside PLGA microspheres, similarly as described (23). The instrument was equipped with an Enterprise UV laser and a Carl Zeiss inverted Axiovert 100M microscope. The fluorescent dye was excited by UV laser at 364 nm and two filters (450 nm, 520 nm) were used in conjunction with a Plan-Neofluar 60× water immersion objective lens with numerical aperture of 1.2 to build images. The laser power was set at 150 μW, and the detection gain was set at 710. The pinhole was 169 μm, which resulted in an optical slice of less than 2.5 μm. The images were scanned by 8 bit plane mode at a scan speed of 6.40 μs/pixel and the image size was 512 × 512 pixels, which corresponded to an area of 150 μm × 150 μm.
Image processing for pH distribution
The images obtained were processed by LSM 510 software and analyzed by Image J software (developed at the U.S. national Institute of Health and available on the internet at http://rsb.info.nih.gov/ij). The ratio of pixel intensities of two images obtained from two wavelengths (450 nm, 520 nm) were calculated and correlated with pH from a standard curve independent of dye concentration. In order to eliminate the signal noise and obtain the accurate pixel value from the acquired images, the image processing procedures were evaluated first by checking the distribution of the fluorescent intensity, and the distribution of the intensity ratio of the standard pH solutions. The appropriate procedures were chosen to give the narrow Gaussian distribution function with a reasonably low standard error after fitting the pixel intensity distribution curve, similarly as previously described (23), and the average value was used to calculate the intensity ratio. The images were processed by repeated scan with frame averaging (n = 8), followed by neighborhood averaging and applying the lowpass filter with the 3 × 3 kernel size, and the threshold values were used to eliminate the fluorescent effects from lower or higher dye concentrations (indicated by 1 < pixel value < 245). This allows the measured image detail to evaluate exclusively in the concentration range of the standard curve. The photofading effect of the dye was found insignificant during the repeated scan.
Fluorescence intensity ratio vs. pH standard curve
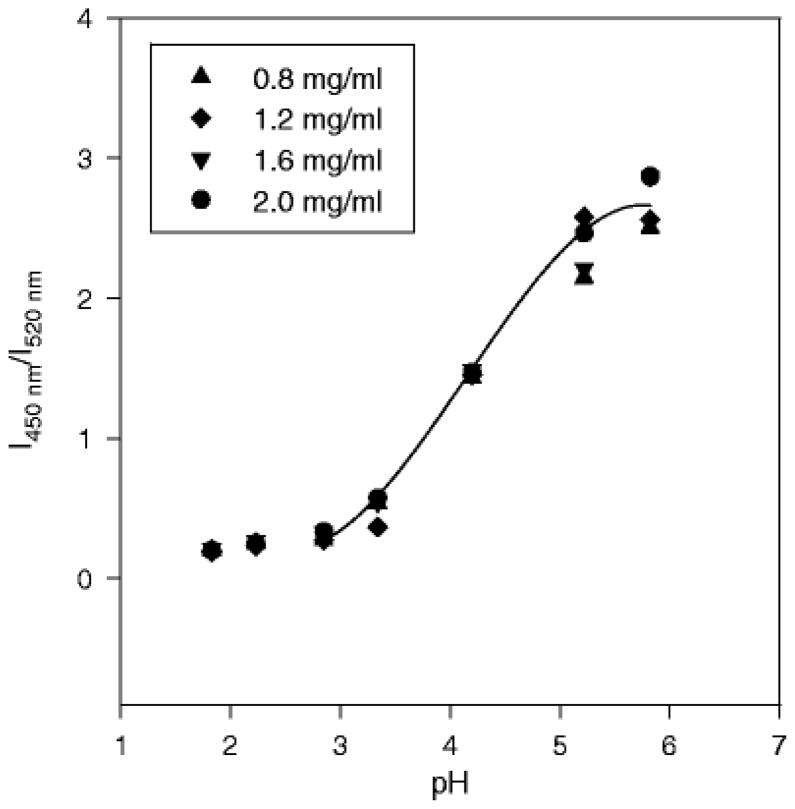
The standard curve of fluorescence intensity ratio vs. pH was determined by using a universal buffer from pH 1.8 to 5.8 (buffer solution contained various amounts of 0.2 M boric acid, 0.05 M citric acid, and 0.1 M trisodium phosphate),(29) and the concentration of Lysosensor yellow/blue dextran was 0.8, 1.2, 1.6, and 2.0 mg/ml.
Microclimate pH distribution kinetics inside PLGA microspheres
The microspheres (15 mg) were incubated in phosphate buffer saline containing 0.02% Tween 80 (PBST, pH = 7.4) at 37°C and under agitation at 100 rpm. At predetermined time points, the release media was replaced with fresh buffer and a small amount of microspheres were removed and placed under the confocal microscope while focusing at the microspheres center to obtain images. When plotting pH distribution curves for microspheres, images of microspheres (n = 20) were processed and the probability of pores having specific pH values was obtained by dividing the amount of pixels at the specific pH by total pixels in detectable aqueous pores. Varying amount of pixels in each processed image had either too low or high intensity ratios to be converted to μpH within the standard curve range. In such cases, those percentages were plotted at the boundaries of the μpH distributions accordingly.
Encapsulation efficiency of dye and dye release
The amount of dye encapsulated in PLGA microspheres was determined by direct recovery from the polymer matrix. Freeze-dried microspheres were dissolved in acetone. The mixture was vortexed and centrifuged, and then the supernatant was removed. After the above procedure was repeated three times, the remaining pellet was reconstituted in PBST and measured for its fluorescence intensity by a fluorescent spectrometer (Instruments S.A., Inc., Edison, NJ) using Ex 365 nm and Em 520 nm. The dye content was determined from the standard curve made by dissolving a known amount of dye in PBST. The encapsulation efficiency (actual loading/theoretical loading) was then calculated.
The released content of dye was also determined by fluorescence spectroscopy. Due to the possible change of medium pH during incubation,(28) the emission wavelength was chosen to correspond to the isosbestic point (pH-insensitive) of the dye. The insensitivity of dye solution to pH at Em 490 nm was evaluated and standard curve was prepared using Ex 365 nm and Em 490 nm. The fluorescence intensity of the removed release media in Microclimate pH distribution kinetics inside PLGA microspheres was monitored and the released dye content was calculated from the standard curve.
Results and Discussion
Confocal imaging of Lysosensor yellow/blue® and image processing
The critical importance of the use of dye conjugated with high molecular weight (10 kDa) dextran is to make the dye a long-term tracer and water-soluble macromolecule, which can prevent dye leaching out from polymer, and localize the dye in the aqueous pores similar to the behavior of proteins inside polymer delivery systems.(22) By contrast, small dyes without dextran conjugation often partition strongly in the polymer phase.(30) Lysosensor yellow/blue® is sensitive to acidic pH changes due to its pyridyl group. The protonation of its pyridyl group with increasing pH causes a shift in its emission spectrum to a shorter wavelength. The ratio of the fluorescence intensities at two emission wavelengths, I450nm/I520nm, is strongly dependent on acidic pH in solution. Some important instrument parameters (e.g., objective lens type and magnification, detection gain, and pinhole) needed to be adjusted to obtain the images of dye solutions within the concentration range from 0.8 to 2.0 mg/ml, which gave pixel values neither fluorescent saturated nor below the detection limit. A standard curve based on ratiometric measurement was prepared at the current experimental conditions. Images were processed as previously described,(23) and signal noise was significantly reduced to obtain narrow Gaussian distribution for the pH map of the standard pH solutions.(23) The pH was accurately determined within the range of ± 0.2 (data not shown), as found with SNARF-dextran in the neutral pH range (23).
Before characterization of hydrated microspheres, several controls were performed and a standard curve was prepared. No fluorescent interference was found in controls of the following, as indicated by the complete absence of a fluorescent signal from the microscope at 450 and 520 nm (data not shown): a) mixtures of polymer and dextran-dye in solid form, b) wet and dry PLGA microspheres without dye, and c) dry PLGA microspheres encapsulated with dye. The standard curve of pH vs. intensity ratio was determined using standard buffer solutions of pH 1.8 – 5.8 with dye concentrations of 0.8, 1.2, 1.6, 2.0 mg/ml. As seen in Fig. 1, a concentration-independent range was verified in the range from 0.8 to 2.0 mg/ml, and the pH sensitive range was 2.8 – 5.8. The ratio vs. pH curve was fit by the third-order polynomial function (r2 = 0.98). The pixel intensity values of the dye solutions at the lowest and highest concentrations at both emission wavelengths served as the threshold, and any value not within the range of Imax and Imin for both emission wavelengths was either not within the concentration range or the pH sensitive range of the standard curve.
Figure 1.
The pH sensitivity and concentration-independence of the standard curve of dextran conjugated Lysosensor yellow/blue®. The third-order polynomial curve fitting the data was Y = −0.15x3 + 1.84x2 −6.51x + 7.26, where Y = I450nm/I520nm; x = pH, r2 = 0.98.
Microclimate pH distribution in PLGA microspheres prepared by w/o/w
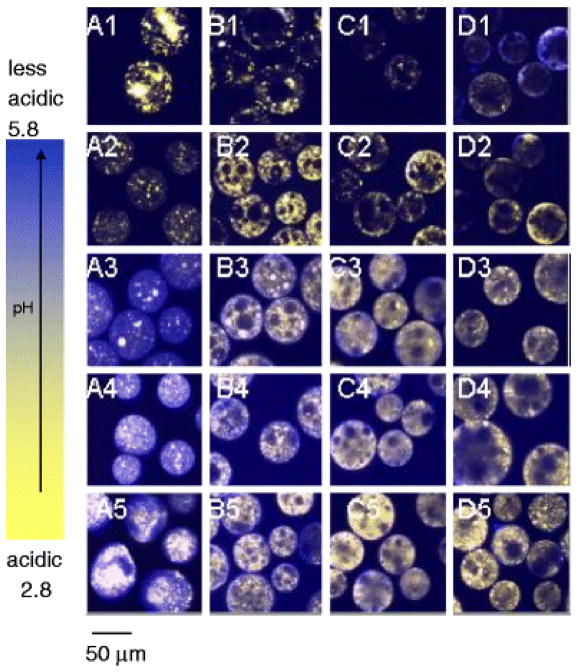
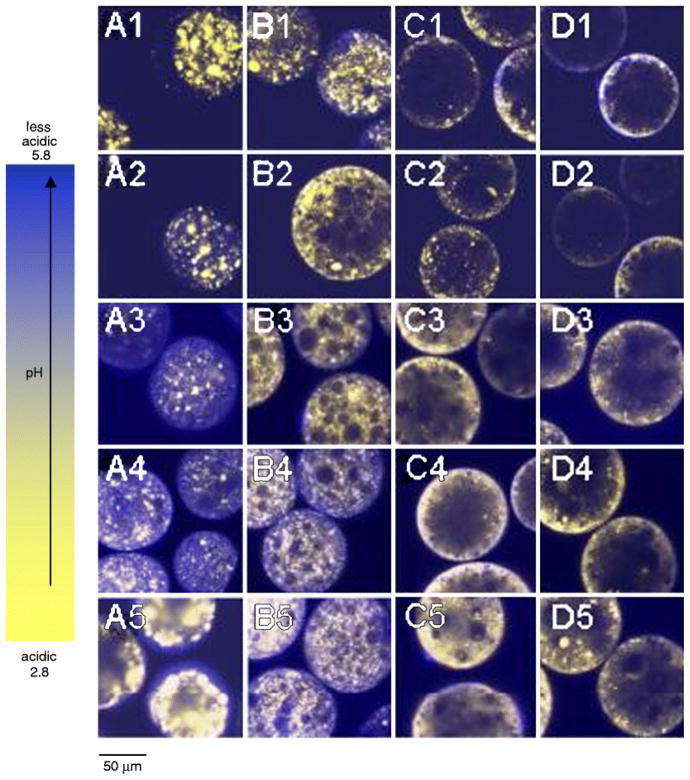
We have demonstrated previously that the acidic μpH existing in PLGA delivery systems during incubation could be quantitatively predicted by a mathematical model from the polymer matrix content of water-soluble acidic polymer impurities and the build-up of degradation products as well as several other variables (e.g., polymer-water partition coefficient of the same acidic species) (31). Therefore, polymers with different polymer molecular weight and composition are reasonably predicted to have distinguished μpH distribution kinetics due to their different hydrolysis and mass transfer properties. In addition, selection of the appropriate polymer material to achieve the expected drug release time scale is normally a first consideration in formulation design. Hence, the effect of polymer materials on μpH distribution kinetics in PLGA microspheres was investigated by monitoring a time sequence of microspheres images, and microspheres were prepared by w/o/w. The typical images of those microspheres during incubation for 4 weeks are shown in Figs. 2 and 3, with sizes of 45 – 65 μm and 90 – 125, respectively.
Figure 2.
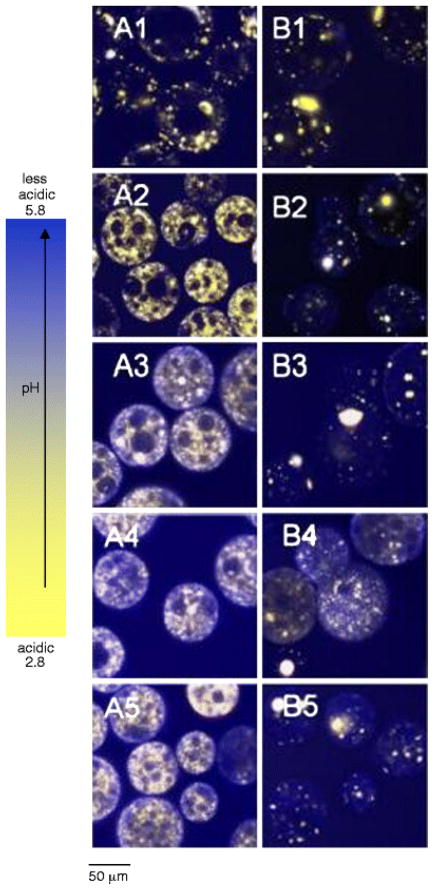
Typical processed confocal images of microspheres (size 45 – 65 μm) prepared by w/o/w during incubation at 37°C for 4 weeks for PLGA 50/50 (i.v. = 0.2 dl/g) (A), 50/50 (i.v. = 0.6 dl/g) (B), 85/15 (i.v. = 0.6 dl/g) (C), and 100/0 (i.v. = 0.6 dl/g) (D). Microspheres were incubated for 1 (A1 – D1), 7 (A2 – D2), 14 (A3 – D3), 21 (A4 – D4), and 28 (A5 – D5) days.
Figure 3.
Typical processed confocal images of w/o/w microspheres (size 90 – 125 μm) during incubation at 37°C for 4 weeks for PLGA 50/50 (i.v. = 0.2 dl/g) (A), 50/50 (i.v. = 0.6 dl/g) (B), 85/15 (i.v. = 0.6 dl/g) (C), and 100/0 (i.v. = 0.6 dl/g) (D). Microspheres were incubated for 1 (A1 – D1), 7 (A2 – D2), 14 (A3 – D3), 21 (A4 – D4), and 28 (A5 – D5) days.
Effect of PLGA molecular weight on μpH distribution kinetics
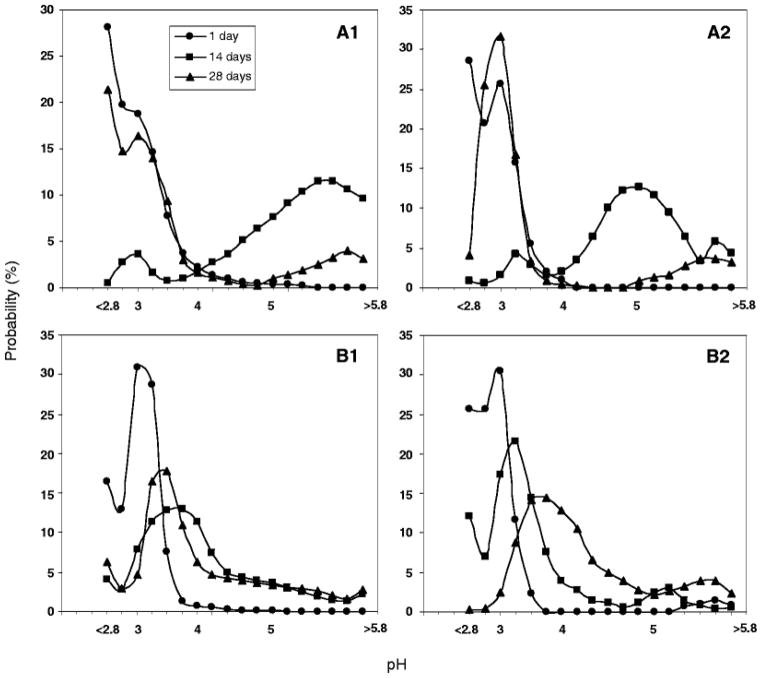
The μpH distribution curve is shown in Fig. 4 for PLGA 50/50 with low (i.v. = 0.2 dl/g) and high (0.6 dl/g) molecular weight (MW). Owing to water-soluble acid impurities (32), after 1 day incubation of low MW PLGA microspheres (Fig. 2A1–5) with size of 45 – 65 μm a mostly acidic μpH was recorded (average pH ~ 2.9) with some pores even out of the detection range (pH < 2.8) (Fig. 4A1). With increasing incubation time, the microspheres became less acidic with an average pH of 5.4 after incubation for 2 weeks. This pH rise is rationalized by the release of acids out of polymer and possibly to a lesser extent, penetration of buffer ions from outside medium. The effect was more pronounced for low MW PLGA, possibly because of a higher hydrophilicity and permeability to the acids. With longer incubation times, a region of neutral range pH around the microspheres’ surface resembling a “ring” can be observed after 4 weeks (Fig. 2A5). This phenomenon can also be clearly seen in larger size microspheres (Fig. 3A5). However, after 4 weeks of incubation, the average pH in the microclimate inside microspheres became acidic again with a value of 3.0, likely due to the fast hydrolysis rate of polymer and the accumulation of the produced acids in the microenvironment. The images not only provided pH distribution inside microspheres, but also illustrated the morphology changes of microspheres during incubation. After 4 weeks (Fig. 2A5), the morphology of microspheres showed the loss of structural integrity. By contrast, after 1 day of incubation, the average microclimate pH was less acidic (pH = 3.0) in the PLGA 50/50 microspheres with high MW (Fig. 2B). Also, fewer noticeable nonfluorescence emitting aqueous pores were observed, which appeared as black “holes” in the images (Figure 2B1). Although the pH also shifted toward the less acidic range (average pH = 3.6) after incubation for 2 weeks (Fig. 3B1), the pH was much more acidic when compared with the low MW polymer. This trend is again consistent with reduced polymer permeability to water-soluble acids as molecular weight increases. The continuous hydrolysis caused the pH inside microspheres to be more acidic again with the average pH of 3.4 after 4 weeks of incubation. A similar trend was also found in larger size (90–125 μm) microspheres (Figs. 4A2 and 4B2).
Figure 4.
Effect of polymer MW on μpH distribution kinetics inside w/o/w PLGA 50/50 microspheres (n = 20) during incubation for 4 weeks in PBST at 37°C for PLGA with i.v. = 0.2 dl/g (A) and 0.6 dl/g (B). Microsphere size was 45 – 65 μm (A1, B1) and 90 – 125 μm (A2, B2).
Effect of polymer lactic/glycolic acid ratio on μpH distribution kinetics
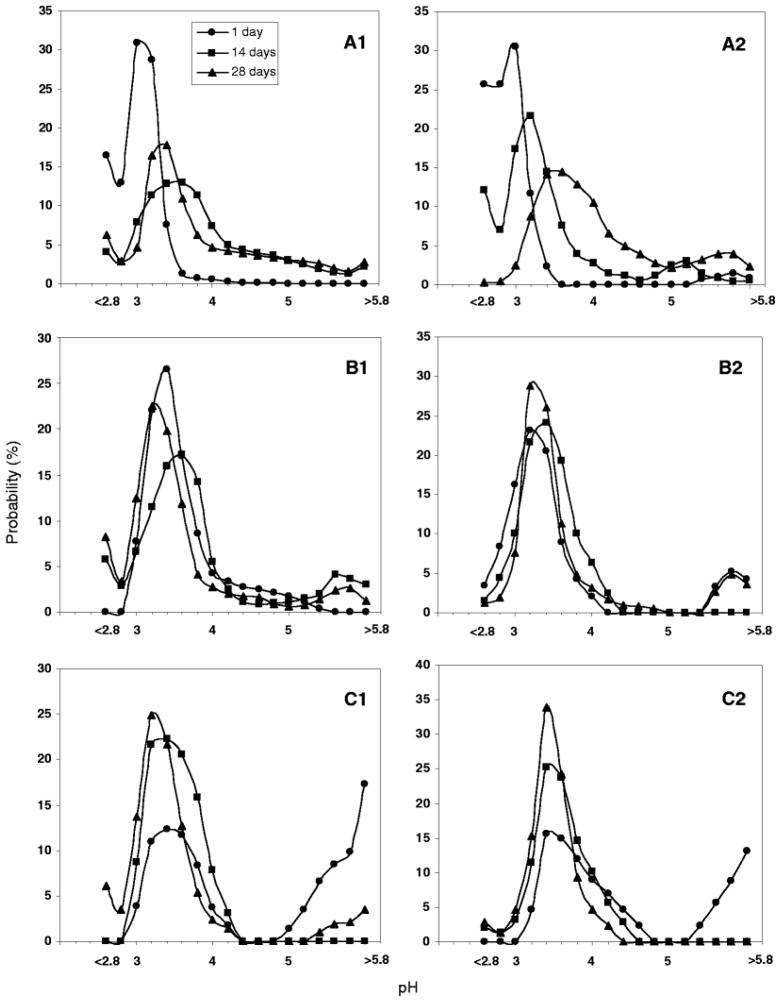
To assess the influence of lactic/glycolic acid ratio on μpH, PLGAs at constant inherent viscosity (i.v. = 0.6 dl/g) were examined at 50/50, 85/15, and 100/0 lactic/glycolic acid ratio. As shown in Fig. 5, after incubation for 1 day, with the increasing lactic acid content, the μpH became less acidic, shifting from an average pH of 3.0 inside 50/50 to 3.4 and 3.6 inside 85/15 and 100/0, and less detectable aqueous pores were found in the images (“black holes” in images) (Figs. 2 and 3). Again, the initial acidic pH was caused by the acid impurities from polymer materials and the polymer degradation. As incubation time proceeds, the less acidic environment is attributed to the slower degradation rate for higher lactic acid content polymers (0.103, 0.026, and 0.012 day−1 for 50/50, 85/15, 100/0, respectively(33)). Another interesting phenomenon was that μpH around surface areas of PLA microspheres was found to be > 5 and some pixels were even out of range (> 5.8) (Fig. 5C), which suggested that a larger content of dye was exposed at the PLA surface relative to other polymers. A similar observation that protein particles were more clearly exposed partially in PLA microspheres than in other polymers from SEM results has also been observed.(34) As shown in Fig. 5, after incubation for 2 weeks, for microspheres with the size of 45 – 65 μm, μpH in PLGA 50/50 became less acidic, shifting to an average pH of 3.6, as indicated above. After two more weeks, the pH became more acidic again, which was caused by the well-known build up of acid in polymer matrix due to continuous polymer degradation. A similar trend was found for PLGA 85/15. However, no significant shift in μpH was found for 100/0 after incubation for 2 weeks. This relatively constant pH can be possibly due to the combination effects of its slower polymer degradation rate and lower permeability to its degraded monomers (e.g., in side-by-side diffusion experiments, we have observed a much lower permeability of lactic acid in PLGAs relative to glycolic acid(35)), which resulted in the relatively constant content of acids in the polymer matrix.
Figure 5.
Effect of polymer composition (lactic/glycolic acid ratio) on μpH distribution kinetics inside w/o/w PLGA microspheres (n = 20) during incubation at 37°C in PBST for PLGA 50/50 (A), 85/15 (B) and 100/0 (C). Microsphere size was 45 – 65 μm (A1 – C1) and 90 – 125 μm (A2 – C2) and PLGA i.v. was 0.6 dl/g
Although the average pH was similar (3.2–3.4) for all the polymers after 4 weeks of incubation, a higher percentage of acidic aqueous pores appeared inside PLGA 85/15 and 100/0, as indicated in Figs. 5B1 and 5C1 and significant regions with pH < 3.4. This can be due to the higher permeability of PLGA 50/50 that facilitated acid diffusion out of polymer, which resulted in the appearance of some relatively more neutral pH (~ 5) pores, as shown in Fig. 5A. The confocal images (Figs. 2 and 3) also showed that at the initial stage, especially for 85/15 and 100/0, although the microspheres were hydrated, the formed aqueous pores were small and could not have significant dye dissolved inside, which resulted in empty holes or low dye concentration giving weak fluorescent intensity (“black hole”) and their pH could not be detected. It is also noted that with the increasing lactic acid content in polymer materials, more detectable aqueous pores distributed around the edge areas of microspheres at the initial stage, and the water pores at the inner side of microspheres kept growing from small to large and coalesced with neighborhood pores, and finally more detectable pores appeared on centric areas of microspheres after 4 weeks of incubation. This can be more obvious shown in large size microspheres, as in Fig.3. The appearance of the new dye loaded pores in the center of the microspheres can be rationalized by the continuous movement of dye within the microspheres as pores both open and close.(36)
Effect of microspheres size on μpH distribution kinetics
The effect of microsphere size (45 – 65 and 90 – 125 μm) on μpH distribution (Figs. 4 and 5) was found to be dependent on polymer materials. The common result for all polymers was that μpH was more acidic in larger size microspheres (90 – 125 μm) after incubation for 1 day except for PLA, which exhibited large domains of neutral pH above 5.8. However, after longer incubation times, no clear pattern of behavior was recorded. For example, the low MW PLGA 50/50 (i.v. = 0.2 dl/g) microspheres became more acidic in the larger size microspheres both after incubation for 2 and 4 weeks. In contrast, the high MW PLGA 50/50 (i.v. = 0.6 dl/g) exhibited less acidity after 4 weeks, but more acidity after 2 weeks in larger size microspheres. The effect of size on PLGA 85/15 and 100/0 microspheres was found less significant after 2 and 4 weeks of incubation, and there were more detectable pores in smaller size microspheres as there were more nonfluorescent “black holes” in images of larger size microspheres. After incubation for 1 day, the polymer degradation is expected to be insignificant, and acid content is mainly affected by the water-soluble acid impurities in the polymer and the rate of acid diffusion out of polymer. This limitation of diffusion is expected to result in the more acidic environment within larger microspheres, because of the longer diffusion pathlength. For example, because low MW PLGA 50/50 degraded most rapidly and showed higher permeability in both microspheres, the diffusion effect on pH controlled by the microsphere size became more pronounced. However, for high MW PLGA 50/50, because a more acidic environment in larger size microspheres facilitated autocatalytic degradation of the polymer, the increase in permeability with time would be expected to be more significant, providing an explanation for increased acid release for this polymer after 4 weeks. For PLGA 85/15 and 100/0, because of their relatively slower degradation rate and low permeability in both size microspheres, the effect of size was less significant over the time frame of the experiment.
Effect of microsphere preparation method on μpH distribution kinetics
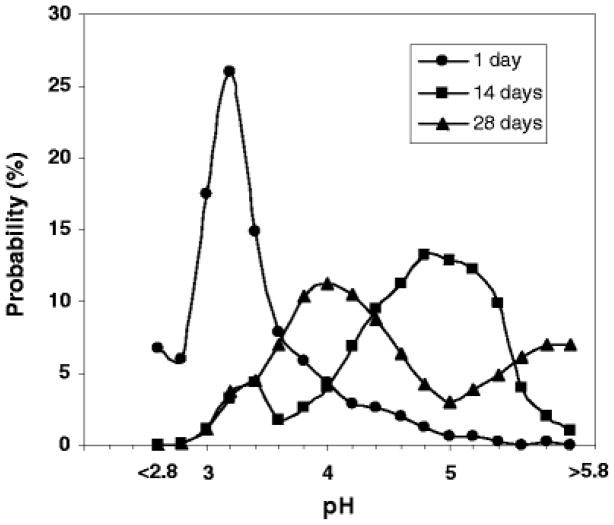
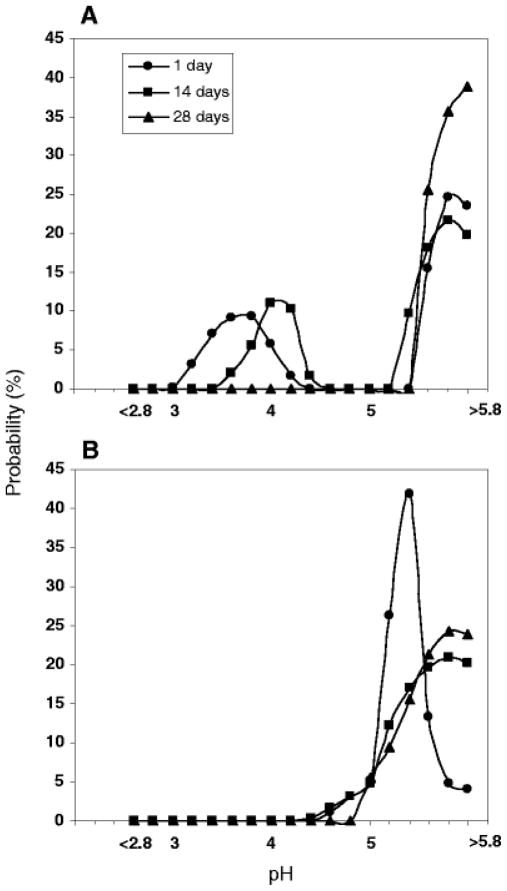
Images of PLGA 50/50 (i.v. = 0.6 dl/g) microspheres prepared by w/o/w and o/o were compared in Fig. 6. The microspheres studied were both in the size range of 45 – 65 μm. Less acidic μpH was observed inside microspheres prepared by o/o during incubation, as shown in Fig. 7. Compared to the average μpH of 3.0, 3.6, 3.4 inside microspheres prepared by w/o/w at 1, 14 and 28 days (Fig.4B1), average μpH inside microspheres prepared by o/o at 1, 14 and 28 days was 3.2, 4.8, and 4, respectively. In addition, there were also less detectable water pores in microspheres prepared by o/o, as shown in confocal images (Fig. 6). The results of less acidic environment inside o/o prepared microspheres monitored by confocal imaging were consistent with the previous result of protein stability.(28) Compared to microspheres prepared by w/o/w, the stability of bovine serum albumin (BSA) was improved significantly by the o/o method. Although no exact reasons were proposed for this improved stability in this report, the less acidic environment we monitored here likely was the cause of this improved BSA stability. The reasons why o/o prepared microspheres had less acidity remain unclear. Possible reasons include increased porosity and higher residual solvent, both of which would result in more rapid water-soluble acid diffusion out of the polymer matrix.
Figure 6.
Typical processed confocal images of PLGA 50/50 (i.v. = 0.6 dl/g) microspheres (size 45 – 65 μm) prepared by w/o/w (A) and o/o (B) methods during incubation at 37°C for 4 weeks. Microspheres were incubated for 1 (A1, B1), 7 (A2, B2), 14 (A3, B3), 21 (A4, B4), and 28 (A5, B5) days.
Figure 7.
μpH distribution kinetics inside PLGA 50/50 (i.v. = 0.6 dl/g) o/o microspheres during incubation in PBST at 37°C.
Microclimate pH distribution in microspheres prepared by PLGA/PEG blends
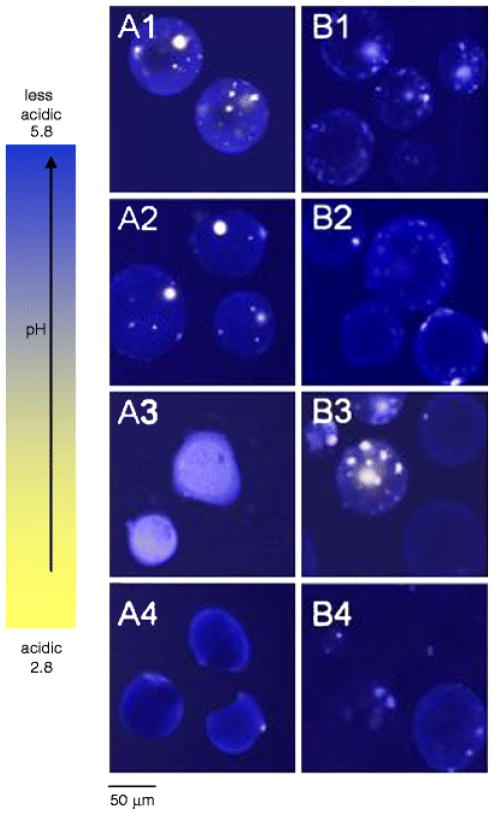
PEG at 20% by weight was blended with PLGA 50/50 (i.v = 0.2 dl/g and 0.6 dl/g) solutions and microspheres were prepared by the o/o method. Microspheres aggregated during preparation when polymer concentration was 700 mg/ml for the low MW polymer. Therefore, a lower concentration (500 mg/ml) was used for PLGA with i.v. 0.2 dl/g and the concentration of 300 mg/ml was used for PLGA with i.v. 0.6 dl/g, as done in the absence of PEG. The microenvironment in PLGA/PEG microspheres was much less acidic than PLGA microspheres without PEG, as shown in Figs. 8 and 9. The pH of most aqueous pores inside the high MW polymer exhibited pH > 5 during incubation for 4 weeks, and similar results were found for low MW PLGA/PEG blends, except there were some acidic pores at 1 day with average pH of 3.8 and 4.0 at 2 weeks, indicative of the higher hydrolysis rate when the MW becomes very low.(37) In both microspheres, the pH in some pixel domains was even out of the detection range (pH > 5.8).
Figure 8.
Typical processed confocal images of o/o microspheres prepared with polymer blends of PLGA 50/50 and 20 % PEG (size 45 – 65 μm) during incubation at 37°C for 4 weeks for PLGA 50/50 with i.v. = 0.2 dl/g (A) and 0.6 dl/g (B). Microspheres were incubated for 1 (A1, B1), 14 (A2, B2), 21 (A3, B3), and 28 (A4, B4) days.
Figure 9.
Effect of PEG blending on μpH distribution kinetics inside PLGA o/o microspheres during incubation for 4 weeks in PBST at 37°C for PLGA 50/50 with i.v. = 0.2 dl/g (A) and 0.6 dl/g (B). PEG was blended at 20% w/w
The relatively more neutral pH inside PLGA/PEG blends was previously proposed by Lavelle (38) and Jiang (28) as the evidence of significantly improved ovalbumin and BSA stability in PLGA/PEG microspheres (28, 38). The results here further provided direct evidence with the visually observable images of the microsphere microenvironment. Because of the high hydrophilicity and solubility of PEG in water, blending it with PLGA increases the water uptake (28), which may dilute the acid concentration inside the polymer system. The dissolution and diffusion out of PEG also likely creates more water channels that increased the permeability of polymer matrix, resulting in an increased rate of acid release. In addition, the plasticization effect of PEG may increase the apparent diffusivity of acids by increasing the polymer chain mobility. Complete incorporation of PEG into PLGA matrix in PLGA/PEG microspheres prepared by o/o has been confirmed previously by infrared spectroscopy analysis.(28) Therefore, less observable aggregated large size pores and relatively more homogeneous distribution of pH could be due to the homogeneous blending between PEG and PLGA, and the more hydrophilic property of polymer matrix facilitated the homogeneous diffusion and distribution of water molecules to form only evenly distributed small pores instead of clustered large pores. Because of the resolution limit of microscopy, those relatively smaller pores could not be individually visualized, and it only showed more homogeneous color emitted by dye.
Dye release from microspheres
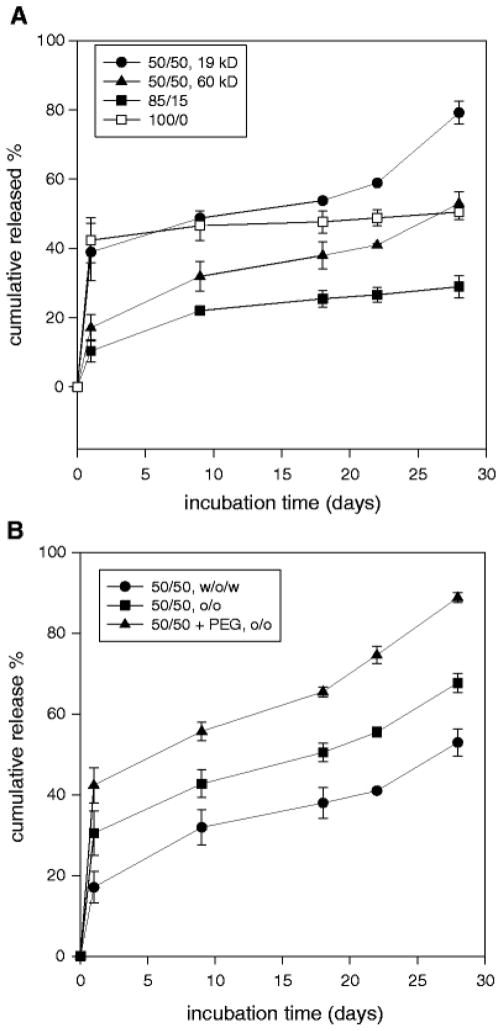
The loading efficiency was ~ 90% and ~40% for the o/o and w/o/w methods, respectively, with the slight variation among different formulations. Therefore, the different theoretical loading was used in these two methods in order to achieve similar actual loading in the final products, i.e., theoretical loading was 0.8% and 0.4% for w/o/w and o/o methods. In Fig. 10 the dye release from microspheres is displayed during 4 weeks of incubation. There was a 1 – 2 week induction period for PLGA 50/50 followed by faster dye release after 3 weeks, consistent with expected biomacromolecule release and indicative of dye availability for the microclimate pH measurement. However, there was little dye release from PLGA 85/15, and 100/0 after 1 week. Compared to microspheres prepared by w/o/w, there was a higher burst release for microspheres prepared by o/o method, and dye released faster thereafter. The addition of 20% PEG significantly increased dye burst release, and dye release was almost complete (~ 90%) after 4 weeks.
Figure 10.
Effect of PLGA MW and composition (w/o/w) (A) and microsphere preparation method with or without addition of PEG (o/o) (B) on dye release kinetics during incubation for 4 weeks in PBST at 37°C. Dye loading efficiency was 0.40, 0.41, 0.38, 0.36% for PLGA 50/50 (i.v. = 0.2 dl/g), 50/50 (i.v. = 0.6 dl/g), 85/15 (i.v. = 0.6 dl/g), and 100/0 (i.v. = 0.6 dl/g) (A), and 0.92 and 0.88% with and without PEG blending (B), respectively. All microspheres were 45 – 65 μm.
Acknowledgments
This work was supported by NIH HL 68345 and a Univ. of Michigan Barbour Fellowship to A.G. Ding.
References
- 1.Schwendeman SP. Recent advances in the stabilization of proteins encapsulated in injectable PLGA delivery systems. Crit Rev Ther Drug Carrier Sys. 2002;19:73–98. doi: 10.1615/critrevtherdrugcarriersyst.v19.i1.20. [DOI] [PubMed] [Google Scholar]
- 2.Schwendeman SP, Costantino HR, Gupta RK, Langer R. Peptide, protein, and vaccine delivery from implantable polymeric systems. Progress and challenges. In: Park K, editor. Controlled Drug Delivery. American Chemical Society; Washington, D. C: 1997. pp. 229–267. [Google Scholar]
- 3.Langer R, Vacanti JP. Tissue engineering. Science. 1993;260:920–6. doi: 10.1126/science.8493529. [DOI] [PubMed] [Google Scholar]
- 4.Langer R. Controlled release of a therapeutic protein. Nat Med. 1996;2:742–743. doi: 10.1038/nm0796-742. [DOI] [PubMed] [Google Scholar]
- 5.Mathiowitz E, Jacob J, Jong Y, Carino G, Chickering D, Chaturvedi P, Santos C, Vijayaraghavan K, Montgomery S, Bassett M, Morrell C. Biological erodable microspheres as potential oral delivery systems. Nature. 1997;386:410–414. doi: 10.1038/386410a0. [DOI] [PubMed] [Google Scholar]
- 6.Johnson OL, Cleland JL, Lee HJ, Charnis M, Duenas E, Jaworowicz W, Shepard D, Shahzamani A, Jones AJ, Putney SD. A month-long effect from a single injection of microencapsulated human growth hormone. Nat Med. 1996;2:795–9. doi: 10.1038/nm0796-795. [DOI] [PubMed] [Google Scholar]
- 7.Okada H, Toguchi H. Biodegradable microspheres in drug delivery. Crit Rev Ther Drug Carrier Sys. 1995;12:1–99. doi: 10.1615/critrevtherdrugcarriersyst.v12.i1.10. [DOI] [PubMed] [Google Scholar]
- 8.Okada H. One- and three-month release injectable microspheres of the LH-RH superagonist leuprorelin acetate. Adv Drug Del Rev. 1997;28:43–70. doi: 10.1016/s0169-409x(97)00050-1. [DOI] [PubMed] [Google Scholar]
- 9.Fu K, Klibanov AM, Langer R. Protein stability in controlled-release systems. Nat Biotechnol. 2000;18:24–25. doi: 10.1038/71875. [DOI] [PubMed] [Google Scholar]
- 10.Putney SD, Burke PA. Improved protein therapeutics with sustained-release formulations. Nat Biotechnol. 1998;16:478. doi: 10.1038/nbt0298-153. [DOI] [PubMed] [Google Scholar]
- 11.Putney SD, Burke PA. Improved protein therapeutic with sustained-release formulations. Nat Biotechnol. 1998;16:153–157. doi: 10.1038/nbt0298-153. [DOI] [PubMed] [Google Scholar]
- 12.Stern M, Ulrich K, Geddes DM, Alton EWFW. Poly (D, L-lactic-co-glycolic acid)/DNA microspheres to facilitate prolonged transgene expression in airway epithelium in vitro, ex vivo and in vivo. Gene Therapy. 2003;10:1282–1288. doi: 10.1038/sj.gt.3301994. [DOI] [PubMed] [Google Scholar]
- 13.Shenderova A, Burke TG, Schwendeman SP. The acidic microclimate in poly(lactic-co-glycolic acid) microspheres stabilizes camptothecins. Pharm Res. 1999;16:241–248. doi: 10.1023/a:1018876308346. [DOI] [PubMed] [Google Scholar]
- 14.Park TG. Degradation of poly(lactic-co-glycolic acid) microspheres: effect of copolymer composition. Biomaterials. 1995;16:1123–30. doi: 10.1016/0142-9612(95)93575-x. [DOI] [PubMed] [Google Scholar]
- 15.Uchida T, Yagi A, Oda Y, Nakada Y, Goto S. Instability of bovine insulin in poly(lactic-co-glycolic acid) (PLGA) microspheres. Chem Pharm Bull. 1996;44:235–236. doi: 10.1248/cpb.44.235. [DOI] [PubMed] [Google Scholar]
- 16.Zhu G, Mallery SR, Schwendeman SP. Stabilization of proteins encapsulated in injectable poly(lactic-co-glycolic acid) Nat Biotechnol. 2000;18:52–57. doi: 10.1038/71916. [DOI] [PubMed] [Google Scholar]
- 17.Jiang W, Schwendeman SP. Stabilization of tetanus toxoid encapsulated in PLGA microspheres. Proceed Int’l Symp Control Rel Bioact Mater. 2002;29:#142. doi: 10.1021/mp800027f. [DOI] [PMC free article] [PubMed] [Google Scholar]
- 18.Kang J, Schwendeman SP. Comparison of the effects of Mg(OH)2 and sucrose on the stability of bovine serum albumin encapsulated in poly(D,L-lactic-co-glycolic acid) implants. Biomaterials. 2002;23:239–245. doi: 10.1016/s0142-9612(01)00101-6. [DOI] [PubMed] [Google Scholar]
- 19.Burke PA. Determination of internal pH in PLGA microspheres using 31P NMR spectroscopy. Proceed Int’l Symp Control Rel Bioact Mater. 1996;23:133–134. [Google Scholar]
- 20.Brunner A, Mader K, Gopferich A. pH and osmotic pressure inside biodegradable microspheres during erosion. Pharm Res. 1999;16:847–53. doi: 10.1023/a:1018822002353. [DOI] [PubMed] [Google Scholar]
- 21.Shenderova A, Ding AG, Schwendeman SP. Potentiometric method for determination of microclimate pH in poly(lactic-co-glycolic) films. Macromolecules. 2004;37:10052–10058. [Google Scholar]
- 22.Fu K, Pack DW, Klibanov AM, Langer R. Visual evidence of acidic environment within degrading poly(lactic-co-glycolic acid) (PLGA) microspheres. Pharm Res. 2000;17:100–106. doi: 10.1023/a:1007582911958. [DOI] [PubMed] [Google Scholar]
- 23.Li L, Schwendeman SP. Mapping meutral microclimate pH in PLGA microspheres. J Control Rel. 2005;101:163–173. doi: 10.1016/j.jconrel.2004.07.029. [DOI] [PubMed] [Google Scholar]
- 24.Okada H, Doken Y, Ogawa Y, Toguchi H. Preparation of three-month depot injectable microspheres of leuprorelin acetate using biodegradable polymers. Pharm Res. 1994;11:1143–7. doi: 10.1023/a:1018936815654. [DOI] [PubMed] [Google Scholar]
- 25.O’Donnelland PB, McGinity JW. Preparation of microspheres by the solvent evaporation technique. Adv Drug Del Rev. 1997;28:25–42. doi: 10.1016/s0169-409x(97)00049-5. [DOI] [PubMed] [Google Scholar]
- 26.Boury F, Marchais H, Proust JE, Benoit JP. Bovine serum albumin release from poly(.alpha.-hydroxy acid) microspheres: effects of polymer molecular weight and surface properties. J Control Rel. 1997;45:75–86. [Google Scholar]
- 27.Jiang W, Schwendeman SP. Stabilization of a model formalinized protein antigen encapsulated in poly(lactic-co-glycolic acid)-based microspheres. J Pharm Sci. 2001;90:1558–1569. doi: 10.1002/jps.1106. [DOI] [PubMed] [Google Scholar]
- 28.Jiang W, Schwendeman SP. Stabilization and controlled release of bovine serum albumin encapsulated in poly(D, L-lactic) and poly(ethylene glycol) microsphere blends. Pharm Res. 2001;18:878–885. doi: 10.1023/a:1011009117586. [DOI] [PubMed] [Google Scholar]
- 29.Perrin D, Dempsey Boyd. Buffers for pH and metal ion control. Halsted Press; New York, N. Y: 1979. [Google Scholar]
- 30.Kang J, Schwendeman SP. Determination of Diffusion Coefficient of a Small Hydrophobic Probe in Poly(lactic-co-glycolic acid) Microparticles by Laser Scanning Confocal Microscopy. Macromolecules. 2003;36:1324–1330. [Google Scholar]
- 31.Ding AG, Shenderova A, Schwendeman SP. Prediction of microclimate pH in poly(lactic-co-glycolic acid) films. J Am Chem Soc. 2006;128:5384–5390. doi: 10.1021/ja055287k. [DOI] [PubMed] [Google Scholar]
- 32.Ding AG, Schwendeman SP. Determination of water-soluble acid distribution in poly(lactic-co-glycolic acid) J Pharm Sci. 2004;93:322–331. doi: 10.1002/jps.10524. [DOI] [PubMed] [Google Scholar]
- 33.Tracy MA, Ward KL, Firouzabadian L, Wang Y, Dong N, Qian R, Zhang Y. Factors affecting the degradation rate of poly(lactic-co-glycolic acid) microspheres in vivo and in vitro. Biomaterials. 1999;20:1057–1062. doi: 10.1016/s0142-9612(99)00002-2. [DOI] [PubMed] [Google Scholar]
- 34.Zhu G. PhD thesis. The Ohio State University; 1999. Stabilization and controlled release of proteins encapsulated in poly(lactic-glycolic acid) delivery systems. [Google Scholar]
- 35.Ding AG. PhD thesis. University of Michigan; 2005. Mechanistic evaluation of acidic microclimate pH development in biodegradable poly (lactic-co-glycolic acid) delivery systems. [Google Scholar]
- 36.Kang J, Schwendeman SP. Pore closing and opening in biodegradable polymers and their effect on the controlled release of proteins. Molec Pharmaceutics. 2007;4:104–118. doi: 10.1021/mp060041n. [DOI] [PubMed] [Google Scholar]
- 37.Hutchinson FG, Furr BJA. Biodegradable polymer systems for the sustained release of polypeptides. J Control Rel. 1990;13:279–94. [Google Scholar]
- 38.Lavelle EC, Yeh MK, Coombes AGA, Davis SS. The stability and immunogenicity of a protein antigen encapsulated in biodegradable microparticles based on blends of lactide polymers and polyethylene glycol. Vaccine. 1999;17:512–529. doi: 10.1016/s0264-410x(98)00229-1. [DOI] [PubMed] [Google Scholar]


