Abstract
Obstructive sleep apnea syndrome is one of the most common sleep disorders. To treat patients with this health problem, it is important to detect the severity of this syndrome and occlusion sites in each patient. The goal of this study is to test the hypothesis that the cure of obstructive sleep apnea syndrome by maxillomandibular advancement surgery can be predicted by analyzing the effect of anatomical airway changes on the pressure effort required for normal breathing using a high-fidelity, 3-D numerical model. The employed numerical model consists of: 1) 3-D upper airway geometry construction from patient-specific computed tomographic scans using an image segmentation technique, 2) mixed-element mesh generation of the numerically constructed airway geometry for discretizing the domain of interest, and 3) computational fluid dynamics simulations for predicting the flow field within the airway and the degree of severity of breathing obstruction. In the present study, both laminar and turbulent flow simulations were performed to predict the flow field in the upper airway of the selected patients before and after maxillomandibular advancement surgery. Patients of different body mass indices were also studied to assess their effects. The numerical results were analyzed to evaluate the pressure gradient along the upper airway. The magnitude of the pressure gradient is regarded as the pressure effort required for breathing, and the extent of reduction of the pressure effort is taken to measure the success of the surgery. The description of the employed numerical model, numerical results from simulations of various patients, and suggestion for future work are detailed in this paper.
Keywords: Obstructive Sleep Apnea Syndrome (OSAS), sleep apnea, Computational Fluid Dynamics (CFD), mesh generation, Maxillomandibular Advancement (MMA)
1 Introduction
The epidemiological data indicate that obstructive sleep apnea syndrome (OSAS), an important public health problem, is second only to asthma in the prevalence league table of chronic respiratory disorders [53]. There is increasing evidence that OSAS is associated with a considerable number of adverse sequelae, both behavioral and physical. Behavioral consequences include daytime sleepiness, impaired concentration, and neuro-psychological dysfunction, whereas physical consequences include cardiovascular disorders, particularly hypertension. Population-based studies [46] reveal that two percent of women and four percent of men over the age of 50 have symptomatic obstructive sleep apnea. Furthermore, approximately 1 in 5 adults has at least mild OSAS and 1 in 15 adults has OSAS of moderate or worse severity [54]. The prevalence of OSAS increases with age, with a 2- to 3-fold higher prevalence in older persons (≥ 65 years) compared with those in their middle age (30–64 years) [54].
There are various surgical procedures currently being considered for treating OSAS, such as maxillomandibular advancement (MMA) surgery [51], uvu-lopalatopharyngoplasty, laser midline glossectomy and lingualplasty, inferior sagittal mandibular osteotomy, and genioglossal advancement with hyoid my-otomy and suspension. In this paper, particular attention is given to MMA, in which the mandible and maxilla are cut and both palate and tongue are moved in the anterior direction, and thus providing maximal enlargement of the retrolingual airway and some expansion of the retropalatal airway. The objective of all surgical choices to increase the space of the breathing airway and to improve of the respiratory disturbance index (RDI), which is the simplest single parameter to identify abnormal breathing [51]. Prior to surgery, nocturnal assessment of respiratory and sleep parameters is essential for a proper evaluation of existing sleep-related breathing disorders [36]. In particular, full cardio-respiratory polysomnography allows physicians to determine whether nocturnal respiratory disturbances are associated with upper airway obstruction or are central in nature. In the treatment of OSAS, it is especially important to identify the severity of OSAS based on the RDI and the site of obstruction in each patient. Many studies [11][31][42] have attempted to assess and predict physical pathologies and the outcome of different treatments for OSAS. To enable such assessment and prediction with high accuracy, high-fidelity imaging techniques are necessary for acquiring the three-dimensional (3-D) detailed upper airway geometry of patients before and after the surgery. There are various upper airway imaging modalities [11][31][42][35][43][13], including nasopharyngoscopy, cephalometrics, Computed Tomography (CT), and Magnetic Resonance Imaging (MRI), which have been used to study the effects of respiration, weight loss, dental appliances, and surgery on the upper airway. The MRI and CT data allow quantification of the airway and surrounding soft tissue structures in 3-D. Although contemporary imaging studies provide significant insight into the structure and function of the upper airway, it is nevertheless still difficult to predict the physiological changes of the upper airway needed in treating each patient with OSAS, to plan the proper surgery, and to assess the outcome of the treatment [14][29][41][47]. Therefore, better diagnostic and planning methods must be developed to improve surgical outcomes. We will demonstrate that high-fidelity numerical simulations can be used 1) to construct 3-D airway models from the patient-specific CT image data, 2) to analyze the effect of anatomical airway changes on the pressure effort required for normal breathing, and 3) to correlate the airway space change to MMA treatment in OSAS patients.
With advances in computer hardware and maturity of numerical methodologies in solving various engineering problems, computational simulations of biofluids and biomechanics, which include 3-D flow in human nasal cavities and/or upper airways [52][19][33][55][32], have become more popular in the last decade. However, these numerical studies are limited to steady-state simulations of airflow through a rigid upper airway. This limitation can be caused by the inability of the employed numerical solver in handling the fluid-structure interaction and/or by the lack of time-dependent airway geometries either from imaging data or numerical models of the flexible tissue. Despite some computational fluid dynamics (CFD) studies being conducted to analyze the upper airway of patients with OSAS, most of the studies simulated either pre-operative or postoperative airway configurations or examined very few sample cases. To test our hypotheses, many cases need to be studied to achieve adequate statistical sampling, such as patients with different severity of OSAS, age groups, and body mass indices (BMIs). To avoid the effect of unwanted interference on the scans of the upper airway volume and the breathing effort, the patient must maintain the same head position and cannot have a completely closed airway when the CT images of pre- and post-operative upper airways are taken so that the surgical effect can be evaluated properly. These requirements lead to a stringent screening process in selecting appropriate test cases. Furthermore, there are several technical barriers that must be overcome before CFD simulations can be used for daily clinical evaluation. These barriers include: 1) the pre-processing step for CFD simulations, such as geometry construction and mesh generation of human airways which are geometrically complex, and 2) capturing the underlying complex flow physics, such as the effects of turbulence and/or transition, and moving boundaries of a flexible airway, with high-fidelity CFD simulations. Although some open-source or commercial software tools (e.g., [1][2]) can be used, the extraction of the upper airway from clinically-used, relatively-coarse image data is difficult and cannot be done automatically mostly because of the complexity of the nasal cavity. In addition, extraction methods have to be used in the correct order with parameters in a certain range [15]. Hence, the geometry construction process can be very time-consuming and prone to error. In addition, the spatial resolution and quality of the medical images, as well as the ambiguity of soft tissues in determining the boundary between the flow domain and the airway, can cause some uncertainties in constructing the airway geometry. To obtain numerical solutions of high accuracy, it is important for CFD simulations to have meshes of high quality. However, generating a high-quality mesh for a human airway, while maintaining its geometric fidelity, is still a challenging task. Our previous efforts in resolving the issues associated with geometry and mesh generation of the human upper airway were discussed earlier [15] and is briefly summarized in Section 2 for completeness. For numerical simulations, the CFD solvers employed need to be able to handle the complex airway geometry with ease and accurately capture vortices and flow separation induced within the airway without excessive numerical damping. The CFD solvers used in this study have been well validated and verified with benchmark test data and applied to various flow problems. The details of the CFD solvers will be described in Section 2. In addition, the airflow in the upper airway consists of laminar, turbulent, and transition flow regimes due to low to moderate Reynolds numbers and rough surfaces of the airway interior wall. For example, the air flow in the nasal cavity has very low speed due to large cross-sectional areas and is expected to be laminar. As the air enters the airway behind the uvula region, the flow speeds up substantially and is more random (including swirling and recirculation) in some cases, an indication of possible flow transition. The speed of air further increases as it passes through the closest narrowing of the velopharynx and subsequently emerges as a turbulent jet entering the downstream laryngeal airway. Some of the aforementioned flow features can be observed in the plots of streamline traces presented in Section 3. Though several models have been proposed to account for the effect of turbulence transition and relaminarization, there is no reliable and universal model to date [9]. Hence, in the present study, both laminar and turbulent flow simulations were conducted for all the cases analyzed to provide the lower and upper bounds of the breathing effort. In total, ten cases, including different age groups, BMIs, and severity of airway obstruction, were selected and analyzed to evaluate the pressure effort required for breathing, which is taken as the measure of the success of the MMA surgery.
2 Numerical Approaches
In the present study, the airway is assumed to be rigid because there is no time-dependent, patient-specific airway geometry available either from the CT data or numerical models of the flexible tissue. Since the flow speed in the upper airway is very low, the air is assumed to be incompressible. A set of governing equations used to model the transport phenomena of air flow through the upper airway includes continuity and Navier-Stokes equations, which are solved to satisfy the conservation of mass and momentum. The set of governing equations written in the vector form can be expressed as:
| (1) |
| (2) |
where and .
ρ is the fluid density, μ is the fluid viscosity, p is the pressure, V⃗ is the mean velocity vector, S⃗ is the vector source/sink term of the momentum equation, is the viscous stress tensor, is the unit tensor, δiδj are the dyadic products, δij is the kronecker delta, t is the time, ∇ is the vector differential operator, and the superscript T denote the transpose of a tensor. Two in-house CFD flow solvers are employed to solve an integral form of the above governing equations: a pressure-based flow solver (the UNIC code [4][44][6]), and a density-based flow solver (the HYB3D code [26][28]). Numerical simulations performed with the UNIC code assume the air flow is turbulent, whereas the flow is treated as laminar for those conducted with the HYB3D code. The numerical results obtained from these two CFD solvers with different numerical approaches and models (pressure-based vs. density-based and turbulent vs. laminar) can be used to verify one another since there is no experimental data available for validation. The descriptions of the numerical methodologies used by both CFD solvers are detailed in the following. The numerical approaches used for generating the geometry and mesh of anatomical airways are also briefly described herein.
2.1 UNIC code
To account for the turbulence effect, a time-averaging technique is applied to the aforementioned governing equations and results in the Reynolds-averaged continuity and Navier-Stokes equations, which are almost identical to Eqs. (1)–(2), except that in the new set of governing equations, the velocity components and pressure are time-mean quantities, and
where represents the sum of the viscous and Reynolds stress tensors, k is the turbulence kinetic energy, and μt is the eddy viscosity. It can be seen that extra unknowns are introduced from the Reynolds averaging process. An extended k-ε turbulence model [5] is used to close the system of equations. In this model, two additional governing equations are solved, which are shown below.
| (3) |
| (4) |
where and .
ε is the turbulence dissipation rate and σk, σε, Cμ, C1, C2, and C3 are the modeling constants [5]. The extended k-ε model implemented in UNIC has been validated in simulating turbulent flow problems that have similar flow characteristics to the upper airway flow, such as flow over a backward-facing step, curved pipe and channel flows, and swirling flow [4][5][7][8]. In the present study, a modified wall function approach [30][50] is employed to provide wall boundary layer solutions that are less sensitive to the near-wall grid spacing.
In order to handle problems with complex geometries, the UNIC code employs a cell-centered unstructured finite volume method [44][6] to solve for the governing equations in the curvilinear coordinates, in which the primary variables are the time-averaged velocity components, pressure, turbulence kinetic energy, and turbulence dissipation. A predictor and multi-corrector pressure-based solution algorithm [20][34] is employed in the UNIC code to couple the set of governing equations such that both compressible and incompressible flows can be solved in a unified framework without using artificial compressibility or a pre-conditioning method. The employed predictor-corrector solution method [4] is based on the modified pressure-velocity coupling approach of the SIMPLE-type [34] algorithm which includes the compressibility effects and is applicable to flows at all speeds. In this approach, the continuity equation is modified to link pressure changes to velocity gradients and density changes, which can be written as
| (5) |
where the superscripts n, n + 1, and * denote the value of flow variables at the previous, current, and immediate time steps, p′ and V⃗′ are the pressure correction and correction of velocity vectors, Dp is the inverse of the matrix of the coefficients of the convective terms in the finite difference form of the momentum equations, and γ and a are the ratio of specific heats and the speed of sound of the working fluid. For the incompressible fluid flow, βp is set to be zero since the magnitude of sonic speed is much larger than the value of pressure corrections.
A second-order central-difference scheme is employed to discretize the diffusion fluxes and source terms. For the convection terms, a second-order multidimensional linear reconstruction approach, suggested by Barth and Jespersen [3], is used in the cell reconstruction to evaluate fluxes at the cell face based on the cell-centered solution. To enhance the temporal accuracy, a second-order dual-time sub-iteration method is used for time-marching computations. A pressure damping term by Rhie and Chow [38] is applied to the mass flux at the cell interface to avoid the even-odd decoupling of velocity and pressure fields. All of the discretized governing equations are solved using the preconditioned Bi-CGSTAB [48] matrix solver, except the pressure-correction equation which has an option to be solved using a GMRES [40] matrix solver when the matrix is ill-conditioned. An algebraic multi-grid (AMG) solver [37] is included such that users can activate it to improve the convergence, if desired. In order to efficiently simulate problems involving a large number of meshes, the UNIC code employs parallel computing with domain decomposition, where exchange of data between processors is done using Message Passing Interface (MPI) [12]. Domain decomposition (partitioning the computational domain into several sub-domains handled by different computer processors) can be accomplished by using METIS [21] or a native partitioning routine in the UNIC code [6].
2.2 HYB3D code
The artificial compressibility formulation of the Navier-Stokes equation is taken as the governing equation for the air flow through upper airway. The integral form of this equation can be taken as [45]:
| (6) |
where Ω is the control volume, ∂Ω is the control surface, n⃗ is the outward pointing unit normal to the control surface with nx, ny and nz as the components along x, y, and z directions respectively, ds is the elemental control surface, and dV is the elemental volume. The solution, inviscid flux, and viscous flux vectors are defined as and , respectively. β is the artificial compressibility parameter is taken as 15, u, v, and w are the velocity components in the x, y, and z directions, respectively, θ is the velocity normal to the control surface and is defined as unx + vny + wnz, τij is the viscous stress along the i direction in a plane perpendicular to the j direction, and p is the pressure.
The governing equations given in Eq. (6) are solved using a cell-centered finite volume scheme based on generalized meshes. The convective flux at the cell-faces is calculated using Roe’s approximate Riemann solver [39]. Second order spatial accuracy in the discretization of the governing equations is achieved using a linear reconstruction of the flow variables, and limiter functions are employed to preserve the monotonicity [3][49]. The discretized form of the governing equations are solved in a parallel framework using MPI [12] for inter processor communication and METIS [21] to decompose the domain into multiple regions. More details on the numerical approach and validation are reported in [26][28][27][25][23][24][22][10].
2.3 Numerical Geometry and Mesh
Details of the reconstruction of upper airway geometric models as hybrid meshes from clinically-used CT data sets are described in [15]. The outcomes of the paper are summarized here. The geometry extraction and manipulation process are the most time-consuming and labor-intensive because of the low-resolution CT data sets compared to the complex human nasal cavity structure. Two important selection criteria for OSAS cases are discussed to create two reasonable pre- and postoperative upper airway models for every case. First, an airway can be very narrow at the pharynx, but should not be closed for calculating pressure efforts. Many OSAS patients have airway collapse at the end of exhalation when supine in the CT scanner. Second, each patient’s head position should be similar in the pre- and postsurgical CT data sets. Two airway models need to be created from the data sets to evaluate the surgical effect. If the head position is changed, the airway geometries are also changed, which will affect CFD results.
To extract patient-specific airway geometries from CT data, the open-source libraries, Insight Segmentation and Registration Toolkit [1] and Visualization Toolkit [2], are used. CT data is provided as a series of two dimensional axial slices through a subject. The slice thickness varies from 1.25 to 3.00 mm in each CT data set, but most are 2.50 mm thick. However, the nasal cavity, part of the upper airway geometry that is needed to develop the flow properly before it reaches the pharynx, is geometrically complex. The CT data slice thickness of 2.5 mm is insufficient to represent all of the details of the morphology of the nasal cavity and to automatically separate it from the sinuses. Two upper airway geometries, before and after the MMA surgery, are needed for each patient in order to evaluate the surgical effect. However, for a given patient, the nasal cavity configuration before surgery can be significantly different from that after surgery due to an unintentional effect of MMA surgery [15]. Therefore, in order to exclude the effect of nasal cavity change, the postoperative nasal cavity is superimposed on the preoperative upper airway model for each patient so that the air flows entering the pre- and postoperative pharynx are similar.
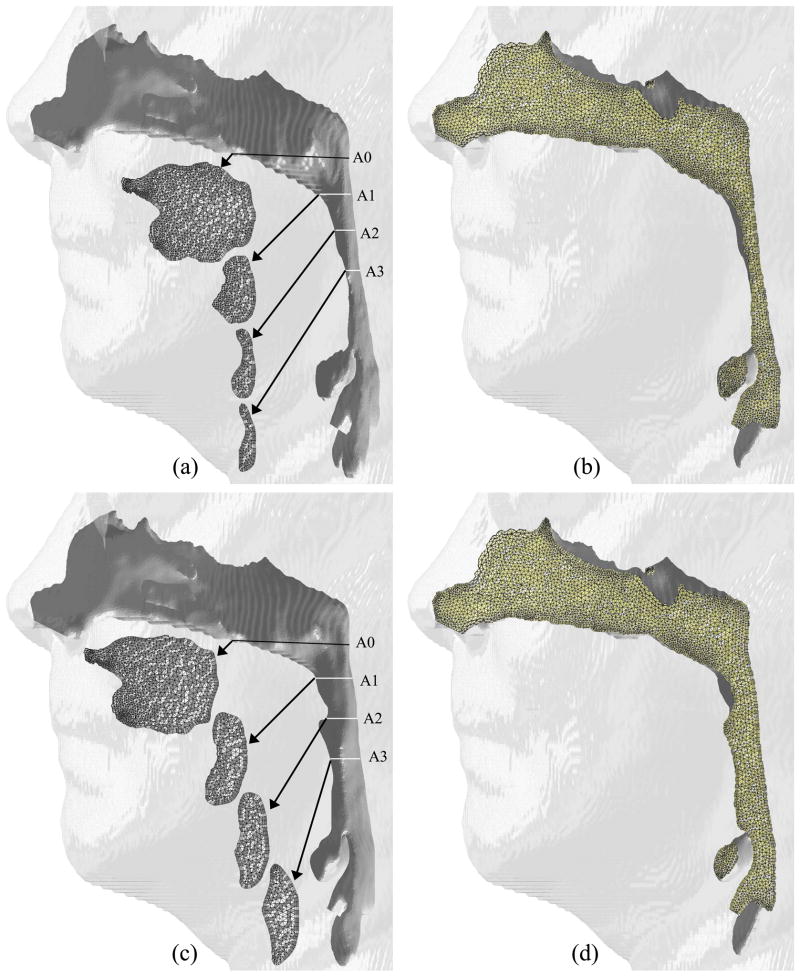
Once the geometry extraction and manipulation process is finished, an in-house grid generator is used to create 3-D hybrid volume meshes for the geometries. The employed grid generator is called the Mixed-Element Grid Generator in 3D (MEGG3D), developed by Ito et al. [18][17][16], which is a discrete surface-based unstructured surface and volume mesh generator with mesh modification and mesh quality improvement tools. The generated hybrid meshes, consisting of tetrahedra, prisms, and pyramids, of the upper airway for one of the test cases is shown in Figure 1.
Fig. 1.
Comparison of geometries and cross-sectional meshes for Case 1: (a, b) pre-and (c, d) postoperative airways.
3 Results and Discussions
In this study, we were able to obtain 10 mild-to-severe OSAS cases (RDI greater than 40) from a large pool of patients with different degrees of surgical improvement. These 10 selected cases also meet the aforementioned criteria for CFD simulations, such as same head position for both pre- and postoperative airway image scanning and no complete airway obstruction caused by holding the breath. These 10 cases are labeled Case 1, 5, 6, 12, 13, 15, 18, 19, 23, and 25. For each case, both pre- and postoperative upper airways were simulated to assess the MMA surgical effect. The 3-D numerical geometry and meshes for the pre- and postoperative MMA of Case 1 are shown in Figure 1 as an illustration. It should be noted that a short upstream section was added to the computational domain so that the effect of air entrance to the nostril could be included. In addition, a straight section of the airway (with a length of roughly ten times the airway exit diameter) was artificially added to the downstream of the computational domain so that the occurrence of flow reversal at the exit plan could be avoided. In our numerical simulations, a normal air volume flow rate of 700 ml/s (an averaged volume of air for one normal inspiration cycle for adults) was used to calculate the speed of air entering the nose, and an inlet air pressure was set to be ambient pressure (1 atm). The pressure effort (ΔP) is used as a measure to assess the surgical outcome. ΔP is defined as the difference between the pressure at different locations along the airway and that at the cross-section with the base plane through the hard palate, the A0 plane shown in Figs. 1(a) and (c), and required to counter airflow resistance. It is anticipated that with the same amount of air inspired, the upper airway of postoperative MMA requires less pressure effort (i.e. less resistance) than that of the preoperative MMA due to increase in the airway dimension (diameter and volume). The increase of the airway volume is a response to MMA surgery. Specifically, the region around the base of the tongue has the most increase. MMA surgery helps sleep apnea patients breathe easier (i.e. with less effort to breathe). For the numerical calculations with the UNIC code, the mass flow rate was specified and fixed at the inlet boundary, and the condition of mass flow rate conservation was imposed at the exit boundary so that the pressure at the exit plane is calculated as an unknown. Whereas, the air velocity was specified and fixed at the inlet boundary, the pressure was specified at the exit boundary, and the pressure at the inlet plane was calculated as an unknown in numerical simulations with the HYB3D code. Since the air was assumed to be incompressible (fixed inlet mass flow rate is equivalent to fixed inlet velocity), these two sets of boundary conditions have the same mathematical implication for the pressure effort.
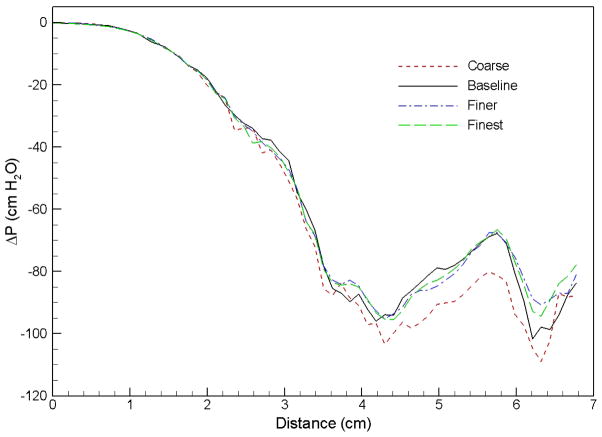
A grid sensitivity analysis was performed for the preoperative airway of Case 1 to determine the appropriate grid spacing for all cases simulated in the present study. Four meshes in different sizes were used in this grid study: coarse (117k nodes), baseline (164k nodes), finer (206k nodes), and finest (253k nodes). The pressure efforts along the preoperative upper airway computed using these 4 meshes are compared in Fig. 2. It can be seen that the results of the baseline, finer, and finest grids are almost identical. Hence, the baseline mesh is selected for the Case 1 preoperative airway, and the numerical mesh employed for other cases varies with the size of the airway so that the grid spacing of each mesh is similar to the baseline mesh. Overall, the number of cells for each mesh ranges from 290k to 620k, and the number of nodes varies from 110k to 200k. Parallel computing with eight to twelve processors are used to perform numerical simulations of each case depending on the employed mesh size.
Fig. 2.
Comparison of pressure effort distributions along the preoperative upper airway of Case 1 computed using different grid resolutions.
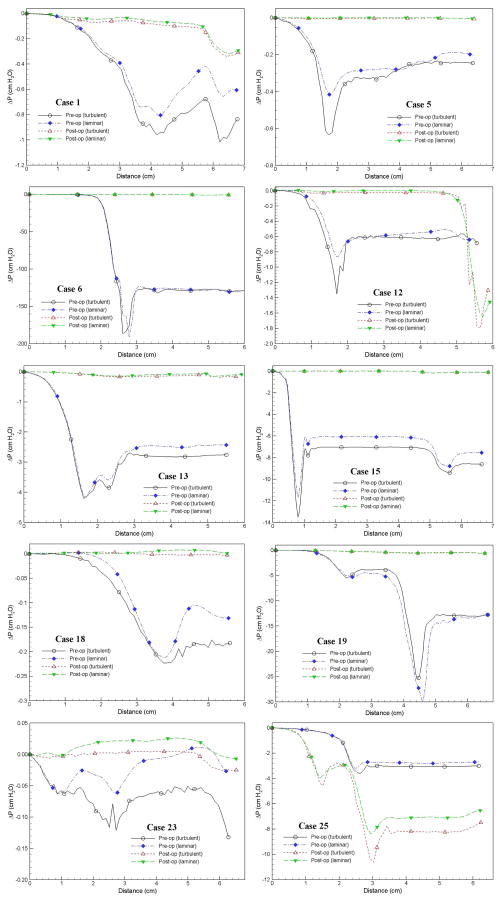
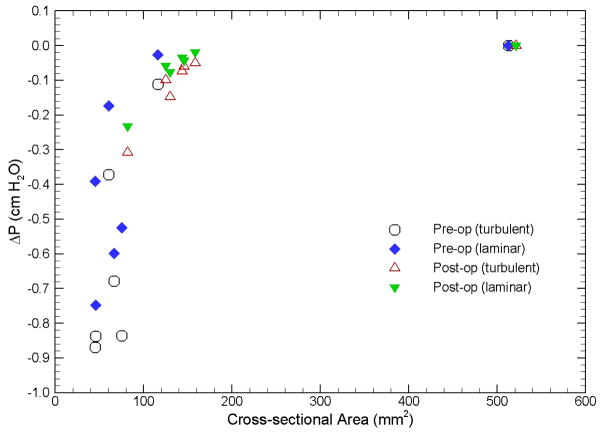
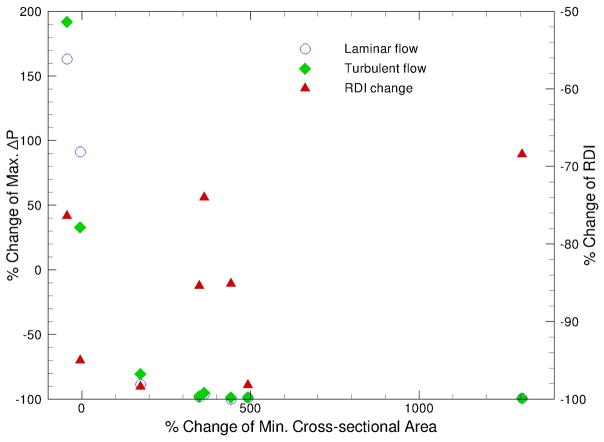
The pressure efforts along the pre- and postoperative upper airways of the selected 10 cases predicted by laminar and turbulent flow simulations are compared in Fig. 3. Several common characteristics can be observed in Fig. 3: i) higher degrees of airway obstruction require more pressure efforts to inspire the normal amount of air, ii) the pressure effort for patients with OSAS before the MMA surgery are larger than those after the surgery (except Case 25), iii) the extent of pressure effort reduction depends on the severity of airway obstruction and the increase of airway space and volume from the surgery, and iv) pressure efforts calculated from turbulent flow simulations are generally larger than those from laminar flow simulations (except the pre-operative airway of Case 19) due to additional air resistance induced by the turbulence effect. Figure 4, which plots the results of Case 1 as an example, demonstrates the general trend that the pressure effort decreases (i.e. easiness of breathing) as the airway cross-sectional area increases. The comparison of all simulated cases is also summarized in Table 1, which contains the BMI, the RDI obtained from breathing tests before and after the MMA procedure, and the cross-sectional area at different locations along the axial direction of the airway for each patient. In Table 1, the shaded cells are used to identify the maximum pressure effort calculated for pre- and postoperative airways of each patient. To help illustrate the surgical effect, the relationship between the percentage change of maximum pressure effort, i.e. (ΔPmax,post–op − ΔPmax,pre–op) / ΔPmax,pre–op, and the percentage change of minimum airway cross-sectional area, i.e. (Amin,post–op − Amin,pre–op) / Amin,pre–op, for all ten cases is plotted in Fig. 5. The percentage change of RDI versus the percentage change of minimum airway cross-sectional area is also shown in Fig. 5. A few things should be noted before interpreting this figure. First, Amin,pre–op and Amin,post–op are the minimum airway areas among the selected cross-sections listed in Table 1 for a given patient before and after the surgery, respectively. Hence, they are used for qualitative assessment only and may not represent the exact minimum cross-sectional area for the entire upper airway since the selected locations may not coincide with the narrowest airway (but should be very close). The positive value of area change indicates that the narrowest airway after the surgery has a larger cross-sectional area than that before the surgery, which is the expected surgical outcome. As mentioned earlier, the CT image is an instant measurement, and thus the airway cross-sectional area extracted from it is very sensitive to the breathing condition and stage during imaging. For example, in this study there are two cases with negative area change (i.e., area decrease), which are believed to be caused by inconsistent breathing conditions before and after the surgery at the instance of CT imaging. Since the change of the maximum pressure effort is directly computed from CFD simulations of numerical airway models, its value should also be regarded as instantaneous. Whereas, the RDI is an average of measured parameters during sleep over a period of time, and thus is less sensitive to the breathing stage and condition. Lastly, the negative value of maximum pressure effort change represents the reduction of pressure efforts after the surgery. It can be seen from Fig. 5 that the reduction of maximum pressure effort increases asymptotically as the expansion of the narrowest airway increases, which is expected surgical outcome. Moreover, the degree of improvement of breathing efforts is almost the same when the increase of the minimum airway cross-sectional area exceeds 3 fold. This can be very useful to physicians in planning the MMA procedure, but more studies are needed to gain more confidence about the range of this threshold. Physically, the relationship between the RDI change and the area change is expected to follow a similar trend as the pressure effort change. Unfortunately, this is not observed in Fig. 5 because RDI is an averaged quantity and may not be consistent with the instantaneous airway geometry as described earlier. Hence, in order to have a meaningfully compared against the RDI data, the time averaged results obtained from transient CFD simulations of flexible pre- and postoperative airways are required.
Fig. 3.
Comparison of pressure effort distributions along the pre- and postoperative upper airways.
Fig. 4.
Comparison of pressure effort vs. cross-sectional area of pre- and postoperative upper airways (Case 1).
Table 1.
Predicted pressure efforts at the different locations along the pre- and post-operative upper airways (ΔP: pressure effort [cm H2O]; Ar.: cross-sectional area of the airway [mm2]; Pr.: preoperative; Po.: postoperative; La.: laminar flow; Tu.: turbulent flow)
| 0 mm | 10 mm | 20 mm | 30 mm | 40 mm | 50 mm | ||||||||||||||||
|---|---|---|---|---|---|---|---|---|---|---|---|---|---|---|---|---|---|---|---|---|---|
|
| |||||||||||||||||||||
| Case | BMI | RDI | Ar. | ΔP | Ar. | ΔP | Ar. | ΔP | Ar. | ΔP | Ar. | ΔP | Ar. | ΔP | |||||||
| La. | Tu. | La. | Tu. | La. | Tu. | La. | Tu. | La. | Tu. | La. | Tu. | ||||||||||
| 1 | Pr. | 25.8 | 22.6 | 513 | 0 | 0 | 116 | −0.03 | −0.11 | 61 | −0.17 | −0.37 | 45 | −0.39 | −0.87 | 46 | −0.75 | −0.84 | 66 | −0.6 | −0.68 |
| Po. | 9.7 | 521 | 0 | 0 | 158 | −0.02 | −0.05 | 146 | −0.04 | −0.06 | 144 | −0.03 | −0.07 | 125 | −0.06 | −0.1 | 130 | −0.08 | −0.15 | ||
| 5 | Pr. | 26.0 | 38 | 515 | 0 | 0 | 88 | −0.1 | −0.18 | 77 | −0.35 | −0.36 | 183 | −0.28 | −0.33 | 146 | −0.28 | −0.25 | 166 | −0.23 | −0.25 |
| Po. | 8.2 | 632 | 0 | 0 | 410 | 0 | 0 | 502 | 0 | 0 | 490 | 0 | 0 | 719 | 0 | 0 | 652 | 0 | 0 | ||
| 6 | Pr. | 35.7 | 17.1 | 231 | 0 | 0 | 57 | −0.5 | −0.5 | 4 | −112.8 | −116.5 | 114 | −127.3 | −128.3 | 114 | −127.5 | −128.8 | 14 | −130.8 | −129.7 |
| Po. | 5.4 | 289 | 0 | 0 | 111 | −0.06 | −0.1 | 57 | −0.26 | −0.37 | 176 | −0.28 | −0.35 | 51 | −0.26 | −0.67 | 74 | −0.89 | −0.78 | ||
| 12 | Pr. | 31.8 | 14 | 366 | 0 | 0 | 45 | −0.12 | −0.73 | 105 | −0.66 | −0.61 | 151 | −0.59 | −0.61 | 171 | −0.55 | −0.63 | 298 | −0.58 | −0.68 |
| Po. | 0.7 | 451 | 0 | 0 | 163 | 0 | −0.03 | 337 | 0 | −0.02 | 282 | 0 | −0.03 | 225 | 0 | −0.03 | 43 | −0.11 | −1.3 | ||
| 13 | Pr. | 32.2 | 50 | 160 | 0 | 0 | 24 | −1.1 | −2.2 | 20 | −3.5 | −3.8 | 145 | −2.6 | −2.8 | 218 | −2.5 | −2.8 | 175 | −2.4 | −2.8 |
| Po. | 13 | 403 | 0 | 0 | 137 | −0.03 | −0.07 | 91 | −0.11 | −0.17 | 191 | −0.13 | −0.15 | 178 | −0.08 | −0.1 | 242 | −0.09 | −0.16 | ||
| 15 | Pr. | — | 94 | 125 | 0 | 0 | 24 | −6.7 | −7.8 | 216 | −6.1 | −7 | 130 | −6.1 | −7.1 | 96 | −6.2 | −7.1 | 22 | −8.8 | −9.4 |
| Po. | 1.7 | 188 | 0 | 0 | 262 | 0.01 | 0 | 602 | 0.01 | 0 | 449 | 0 | 0 | 139 | 0 | −0.08 | 132 | −0.13 | −0.12 | ||
| 18 | Pr. | 26.1 | 40.3 | 626 | 0 | 0 | 232 | 0 | −0.01 | 119 | −0.01 | −0.08 | 76 | −0.12 | −0.21 | 176 | −0.19 | −0.18 | 259 | −0.12 | −0.18 |
| Po. | 6 | 738 | 0 | 0 | 507 | 0 | 0 | 411 | 0 | 0 | 529 | 0 | 0 | 525 | 0.01 | 0 | 512 | 0.01 | 0 | ||
| 19 | Pr. | 27.0 | 48 | 471 | 0 | 0 | 70 | −0.6 | −0.5 | 22 | −5.3 | −4.8 | 17 | −5.2 | −3.9 | 9 | −27.3 | −25.2 | 43 | −13.6 | −12.9 |
| Po. | 7 | 476 | 0 | 0 | 165 | −0.03 | −0.05 | 78 | −0.17 | −0.24 | 42 | −0.27 | −0.4 | 58 | −0.4 | −0.54 | 78 | −0.34 | −0.46 | ||
| 23 | Pr. | 32.5 | 30.9 | 186 | 0 | 0 | 106 | −0.06 | −0.06 | 102 | −.03 | −0.09 | 207 | −0.04 | −0.07 | 213 | −0.01 | −0.06 | 196 | 0.01 | −0.06 |
| Po. | 0.5 | 346 | 0 | 0 | 280 | 0 | 0 | 295 | 0.02 | 0 | 530 | 0.02 | 0 | 490 | 0.02 | 0 | 411 | 0.2 | 0 | ||
| 25 | Pr. | 36.0 | 110 | 323 | 0 | 0 | 88 | −0.17 | −0.15 | 36 | −0.95 | −1.18 | 159 | −2.72 | −3 | 174 | −2.74 | −3.06 | 141 | −2.79 | −3.07 |
| Po. | 26 | 323 | 0 | 0 | 25 | −1.3 | −2.2 | 27 | −3 | −2.9 | 20 | −8.3 | −9.5 | 81 | −7.1 | −8.2 | 107 | −7.1 | −8.2 | ||
Fig. 5.
Change of max. pressure effort vs. change of min. cross-sectional area between pre- and postoperative upper airways.
To demonstrate the flow characteristics in the upper airway, the numerical results of some cases (Cases 1, 5, 12, 13, 19 and 25) are plotted in Figs. 6–13, which show the contours of pressure efforts and shear stresses at the flow-airway interface and the streamline traces of the airflow through each upper airway. Colors used to indicate the magnitude of the pressure effort in centimeters of water range from red (lowest effort) to blue (highest effort). Whereas, for the shear stress contours (in N/m2), red indicates the largest friction and blue indicates the smallest friction. Overall, for a given patient, it can be seen that at the narrowest airway location the airflow has the highest velocity and the largest friction loss, which leads to highest pressure effort. As stated earlier, the numerical results of Case 25 show that larger pressure efforts are required to inhale the same amount of air after the surgery than before the surgery, which is contradictory to the result of other cases. This is because the cross-sectional area of the postoperative airway is smaller than that of the pre-operative one, as can be seen in Fig. 13. However, the test results show that the RDI of this patient was improved from 110 to 26 as a result of the surgery. The trend of calculated pressure effort is consistent with the change of airway size, but is opposite to the test data of Case 25. It is suspected that the patient did not properly hold the breath during CT imaging, which yielded the pre- and postoperative airway geometry inconsistently. This shows a stiff constraint for case selection in numerical studies of rigid airways. In addition, it is observed that the pressure efforts for the preoperative airway of Case 19 predicted by laminar flow simulations are higher than those by turbulent flow simulations, which is not consistent with other results. The reason for this is that the flow reversal region of the laminar flow at the downstream of the narrowest airway passage is larger than that of the turbulent flow because the laminar flow has smaller momentum diffusion. This can be seen from the streamline traces shown in Fig. 12. A larger reversed flow region leads to a larger blockage effect for the laminar flow, and thus results in a larger pressure effort. Plots of other numerical results are very similar to those shown in Figs. 6–11, and thus are not included.
Fig. 6.
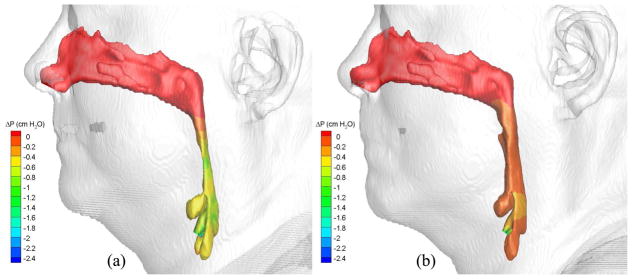
Pressure effort contours of air in the (a) pre- and (b) postoperative upper airways (Case 1, turbulent flow).
Fig. 13.
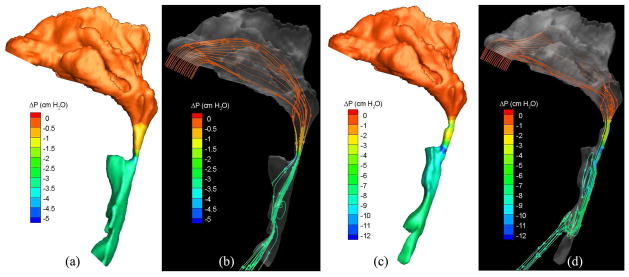
Pressure effort contours and streamline traces of air in the (a, b) pre- and (c, d) postoperative upper airways (Case 25, turbulent flow).
Fig. 12.
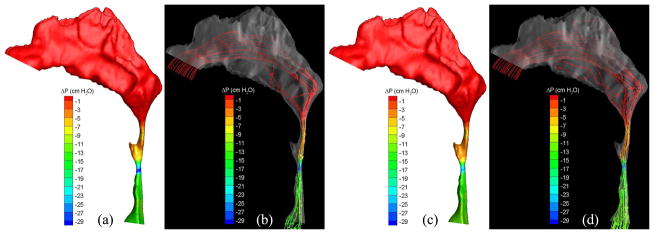
Pressure effort contours and streamline traces of air predicted by (a, b) laminar and (c, d) turbulent simulations (Case 19, preoperative).
Fig. 11.

Pressure effort and shear stress contours of air in the (a, b) pre- and (c, d) postoperative upper airways (Case 13, turbulent flow).
4 Conclusions
The numerical results demonstrate that the computational framework (including geometry and mesh generation and CFD simulations) developed in this study is capable of qualitatively predicting both the effect of airway obstruction on the breathing effort and the surgical effect on improving pressure efforts. Though the present study is limited to steady-state, rigid airway simulations, it proves our hypothesis and serves as a proof-of-concept investigation for future studies. Due to the severe constraints on airway selection, simulations of a larger number of cases cannot be performed to achieve better statistical sampling. Furthermore, this study shows non-uniform pressure loads on the airway, which lead to different degrees of airway deformation. In addition, the extent of airway deformation is also affected by the flexibility of the airway tissue, which varies among each individual, and in return alters the air pressure distribution. The comparison of our numerical results with the patient-specific RDI test data also reveals the inadequacy of steady-state, rigid airway simulation. The complex behavior of the elastic airway imposes three critical technical challenges on the numerical study of the surgical effect on patients with OSAS: 1) the need for a numerical framework to account for the fluid-structure interaction effect, in which local pressure loads on the airway and the airway geometry dynamically affect each other, 2) a numerical model developed from the patient-specific tissue property or empirical correlation to determine the extent of tissue deformation based on variation of local pressure load, and 3) acquiring hysteresis of the pressure effort or air volume flow rate during tidal breathings to provide appropriate boundary conditions for unsteady flow simulations. This work is a preliminary study for exploring the feasibility of applying high-fidelity CFD simulations to assess the surgical effect on the breathing effort of OSAS patients. Further development of numerical models to simulate unsteady flow phenomena in a flexible airway is necessary so that their numerical results can meaningfully help physicians to plan the appropriate medical procedure for treating patients with OSAS.
Fig. 7.
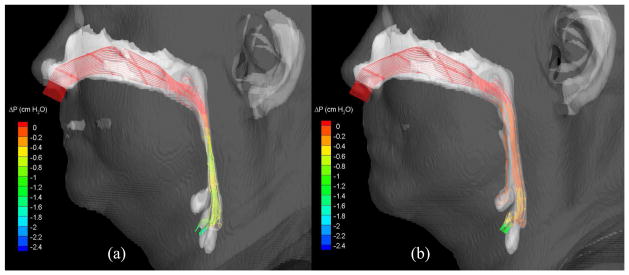
Streamlines (colored by pressure efforts) of air flowing through the (a) pre-and (b) postoperative upper airways (Case 1, turbulent flow).
Fig. 8.

Pressure effort and shear stress contours of air in the (a, b) pre- and (c, d) postoperative upper airways (Case 5, turbulent flow).
Fig. 9.
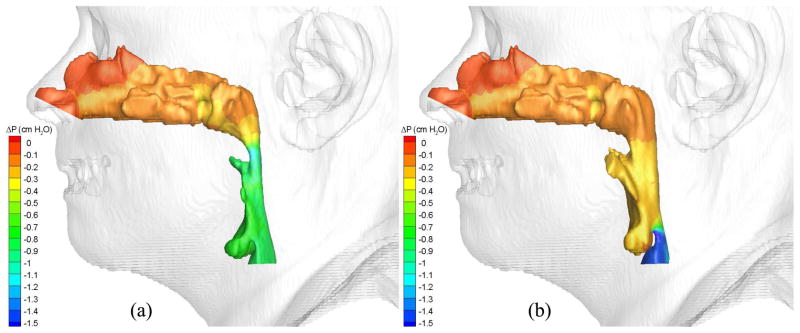
Pressure effort contours of air in the (a) pre- and (b) postoperative upper airways (Case 12, turbulent flow).
Fig. 10.
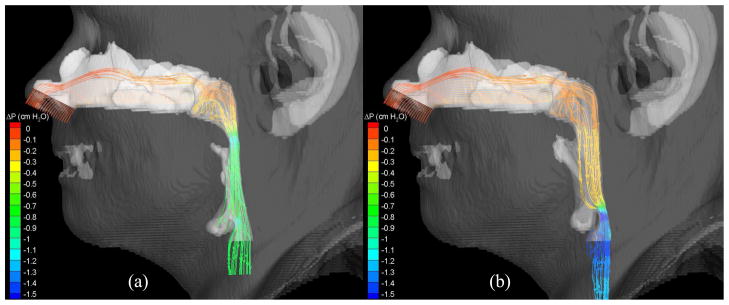
Streamlines (colored by pressure efforts) of air flowing through the (a) pre-and (b) postoperative upper airways (Case 12, turbulent flow).
Acknowledgments
This research is supported by the National Institute of Dental and Cran-iofacial Research (NIDCR) at the National Institutes of Health (NIH) No. 5R21DE017613-02. Assistance from Ms. Alison Green from the Department of Oral and Maxillofacial Surgery in collecting, screening, and transferring the pre- and postoperative images of patients is greatly appreciated. We also would like to thank Mr. Jacob Nelson for his assistance in performing some of the numerical simulations in this study. The work reported here involves intellectual property developed by Yasushi Ito, Alan Shih, and Bharat Soni and owned by Yasushi Ito, Alan Shih, Bharat Soni, and the UAB Research Foundation. This intellectual property has been licensed to Amplicode, Inc. in which Yasushi Ito and Alan Shih have a financial interest.
Footnotes
Publisher's Disclaimer: This is a PDF file of an unedited manuscript that has been accepted for publication. As a service to our customers we are providing this early version of the manuscript. The manuscript will undergo copyediting, typesetting, and review of the resulting proof before it is published in its final citable form. Please note that during the production process errors may be discovered which could affect the content, and all legal disclaimers that apply to the journal pertain.
Contributor Information
Roy P. Koomullil, Email: rkoomul@uab.edu.
Yasushi Ito, Email: yito@uab.edu.
Alan M. Shih, Email: ashih@uab.edu.
Somsak Sittitavornwong, Email: sjade@uab.edu.
Peter D. Waite, Email: pwaite@uab.edu.
References
- 1.Insight segmentation and registration toolkit (itk) doi: 10.1109/IEMBS.2007.4352434. URL http://www.itk.org/ [DOI] [PubMed]
- 2.Visualization toolkit (vtk) URL http://www.vtk.org/
- 3.Barth T, Jespersen D. The design and application of upwind schemes on unstructured meshes. 27th Aerospace Sciences Meeting, No. AIAA-1989-0366; 1989. [Google Scholar]
- 4.Chen Y-S. An unstructured finite volume method for viscous flow computations. Proceedings of the 7th International Conference on Finite Element Methods in Flow Problems, University of Alabama in Huntsville; Huntsville, AL. 1989. [Google Scholar]
- 5.Chen Y-S, Kim S-W. Tech Rep NASA-CR-179204. NASA; 1987. Computation of turbulent flows using an extended k-ε turbulence closure model. [Google Scholar]
- 6.Chen Y-S, Zhang S, Liu J. Tech Rep H-34345D. Engineering Sciences, Inc; Huntsville, AL: 2002. Stage separation performance analysis project final. report. [Google Scholar]
- 7.Cheng G, Chen Y, Garcia R, Williams R. Numerical study of 3-d inducer and impeller for pump model development, No. AIAA-1993-3003. 1993. [Google Scholar]
- 8.Cheng G, Farmer R, Chen Y. Numerical study of turbulent flows with compressibility effects and chemical reactions, No. AIAA-1994-2026. 1994. [Google Scholar]
- 9.Cheng G, Nichols R, Neroorkar K, Radhamony P. Validation and assessment of turbulence transition models. 47th AIAA Aerospace Sciences Meeting and Exhibit, No. AIAA-2009-1141; Orlando, FL. 2009. [Google Scholar]
- 10.Cheng GC, Koomullil RP, Soni BK. High fidelity field simulations using density and pressure based approaches. Applied Numerical Mathematics. 2005;55(3):264–282. applied Scientific Computing: Recent Approaches to Grid Generation, Approximation and Numerical Modelling. [Google Scholar]
- 11.Faber CE, Grymer L. Available techniques for objective assessment of upper airway narrowing in snoring and sleep apnea. Sleep and Breathing. 2003;7(2):77–86. doi: 10.1007/s11325-003-0077-9. [DOI] [PubMed] [Google Scholar]
- 12.Gropp W, Lusk E, Skjellum A. Using MPI. 2. MIT Press; Cambridge, MA: 1999. [Google Scholar]
- 13.Hoffman EA, Gefter WB. Multimodality imaging of the upper airway: Mri, mr spectroscopy, and ultrafast x-ray ct. Prog Clin Biol Res. 1990;345:291–301. [PubMed] [Google Scholar]
- 14.Isono S. Diagnosis of sites of upper airway obstruction in patients with obstructive sleep apnea. Nippon Rinsho. 2000;58(8):1660–1664. [PubMed] [Google Scholar]
- 15.Ito Y, Cheng GC, Shih AM, Koomullil RP, Soni BK, Sittitavornwong S, Waite PD. Patient-specific geometry modeling and mesh generation for simulating obstructive sleep apnea syndrome cases by maxillomandibular advancement. Mathematics and Computers in Simulation. 2011;81(9):1876–1891. doi: 10.1016/j.matcom.2011.02.006. [DOI] [PMC free article] [PubMed] [Google Scholar]
- 16.Ito Y, Shih AM, Soni BK. Hybrid mesh generation with embedded surfaces using a multiple marching direction approach. International Journal for Numerical Methods in Fluids. 2011;67(1):1–7. [Google Scholar]
- 17.Ito Y, Shih AM, Soni BK, Nakahashi K. Multiple marching direction approach to generate high quality hybrid meshes. AIAA Journal. 2007;45(1):162–167. [Google Scholar]
- 18.Ito Y, Shum PC, Shih AM, Soni BK, Nakahashi K. Robust generation of high-quality unstructured meshes on realistic biomedical geometry. International Journal for Numerical Methods in Engineering. 2006;65(6):943–973. [Google Scholar]
- 19.Jeong S-J, Kim W-S, Sung S-J. Numerical investigation on the flow characteristics and aerodynamic force of the upper airway of patient with obstructive sleep apnea using computational fluid dynamics. Medical Engineering & Physics. 2007;29(6):637–651. doi: 10.1016/j.medengphy.2006.08.017. [DOI] [PubMed] [Google Scholar]
- 20.Karki KC, Patankar SV. Pressure based calculation procedure for viscous flows at all speeds in arbitrary configurations. AIAA Journal. 1989;27:1167–1174. [Google Scholar]
- 21.Karypis G, Kumar V. METIS - A Software Package for Partitioning Unstructured Graphs, Partitioning Meshes, and Computing Fill-Reducing Orderings of Sparse Matrices Version 4.0. University of Minnesota, Department of Computer Science / Army HPC Research Center; Sep, 1998. [Google Scholar]
- 22.Koomullil R, Bhagat N, Ito Y, Noack R. Generalized overset grid framework for incompressible flows. 44th AIAA Aerospace Sciences Meeting and Exhibit, No. AIAA-2006-1146; Reno, NV. 2006. [Google Scholar]
- 23.Koomullil R, Cheng G, Soni B, Noack R, Prewitt N. Moving-body simulations using overset framework with rigid body dynamics. Mathematics and Computers in Simulation. 2008;78(5–6):618–626. applied Scientific Computing: Numerical Grid Generation and Field Simulation. [Google Scholar]
- 24.Koomullil R, Prewitt N. A library based approach for rigid body dynamics simulation. 18th AIAA Computational Fluid Dynamics Conference, No. AIAA-2007-4476; Miami, FL. 2007. [Google Scholar]
- 25.Koomullil R, Soni B, Singh R. A comprehensive generalized mesh system for cfd applications. Mathematics and Computers in Simulation. 2008;78(5–6):605–617. applied Scientific Computing: Numerical Grid Generation and Field Simulation. [Google Scholar]
- 26.Koomullil R, Thompson D, Soni B. Iced airfoil simulation using generalized grids. Applied Numerical Mathematics. 2003;46:319–330. [Google Scholar]
- 27.Koomullil RP. Ph D thesis. Department of Aerospace Engineering, Mississippi State University; May, 1997. Flow simulation system for generalized static and dynamic grids. [Google Scholar]
- 28.Koomullil RP, Soni BK. Flow simulation using generalized static and dynamic grids. AIAA Journal. 1999;37(12):1551–1557. [Google Scholar]
- 29.Launois SH, Feroah TR, Campbell WN, Issa FG, Morrison D, Whitelaw WA, Isono S, Remmers JE. Site of pharyngeal narrowing predicts outcome of surgery for obstructive sleep apnea. Am Rev Respir Dis. 1993;147(1):182–189. doi: 10.1164/ajrccm/147.1.182. [DOI] [PubMed] [Google Scholar]
- 30.Liakopoulos A. Explicit representations of the complete velocity profile in a turbulent boundary layer. AIAA Journal. 1984;22:844–846. [Google Scholar]
- 31.Metes A, Hoffstein V, Direnfeld V, Chapnik JS, Zamel N. Three-dimensional ct reconstruction and volume measurements of the pharyngeal airway before and after maxillofacial surgery in obstructive sleep apnea. J Otolaryngol. 1993;22(4):261–264. [PubMed] [Google Scholar]
- 32.Mihaescu M, Mylavarapu G, Gutmark EJ, Powell NB. Large eddy simulation of the pharyngeal airflow associated with obstructive sleep apnea syndrome at pre and post-surgical treatment. Journal of Biomechanics. 2011;44(12):2221–2228. doi: 10.1016/j.jbiomech.2011.06.006. [DOI] [PubMed] [Google Scholar]
- 33.Mylavarapu G, Murugappan S, Mihaescu M, Kalra M, Khosla S, Gutmark E. Validation of computational fluid dynamics methodology used for human upper airway flow simulations. Journal of Biomechanics. 2009;42(10):1553–1559. doi: 10.1016/j.jbiomech.2009.03.035. [DOI] [PubMed] [Google Scholar]
- 34.Patankar SV. Numerical Heat Transfer and Fluid Flow. Taylor & Francis; New York: 1980. [Google Scholar]
- 35.Pepin JL, Ferretti G, Veale D, Romand P, Coulomb M, Brambilla C, Lévy PA. Somnofluoroscopy, computed tomography, and cephalometry in the assessment of the airway in obstructive sleep apnoea. Thorax. 1992;47(3):150–156. doi: 10.1136/thx.47.3.150. [DOI] [PMC free article] [PubMed] [Google Scholar]
- 36.Peter JH, Becker H, Cassel W, Faust M, Ploch T, Riess M, Penzel T. Diagnosis of sleep apnea: initial experiences with a staged procedure. Pneumologie. 1989;43(Suppl 1):587–590. [PubMed] [Google Scholar]
- 37.Raw M. Robustness of coupled algebric multigrid for the navier-stkoes equations, No. AIAA-1996-0297. 1996. [Google Scholar]
- 38.Rhie C, Chow W. A numerical study of the turbulent flow past an isolated airfoil with trailing edge separation. AIAA Journal. 1983;21:1525–1532. [Google Scholar]
- 39.Roe PL. Approximate riemann solvers, parameter vector, and difference schemes. Journal of Computational Physics. 1981;43:357–372. [Google Scholar]
- 40.Saad Y, Schultz MH. Gmres: a generalized minimal residual algorithm for solving nonsymmetric linear systems. SIAM J Sci Stat Comput. 1986;7:856–869. [Google Scholar]
- 41.Saeki N, Isono S, Tanaka A, Nishino T, Higuchi Y, Uchino Y, Iuchi T, Murai H, Tatsuno I, Yasuda T, Yamaura A. Pre-and post-operative respiratory assessment of acromegalics with sleep apnea–bedside oximetric study for transsphenoidal approach. Endocr J. 2000;47(Suppl):S61–S64. doi: 10.1507/endocrj.47.supplmarch_s61. [DOI] [PubMed] [Google Scholar]
- 42.Schwab RJ. Upper airway imaging. Clinics in Chest Medicine. 1998;19(1):33–54. doi: 10.1016/s0272-5231(05)70430-5. [DOI] [PubMed] [Google Scholar]
- 43.Schwab RJ, Goldberg AN. Upper airway assessment: radiographic and other imaging techniques. Otolaryngol Clin North Am. 1998;31(6):931–968. doi: 10.1016/s0030-6665(05)70100-6. [DOI] [PubMed] [Google Scholar]
- 44.Shang H, Shih M, Chen Y, Liaw P. Flow calculation on unstructured grids with a pressure-based method. Proceedings of the 6th International Symposium on Computational Fluid Dynamics; Lake Tahoe, NV. 1995. [Google Scholar]
- 45.Sheng H, Sreenivas CKD, Gaither J, Marcum DL, Whitfield D, Anderson W. Three-dimensional incompressible navier-stokes flow computations about complete configurations using a multiblock unstructured grid approach. 37th AIAA Aerospace Sciences Meeting, No. AIAA-1999-0778; Reno, NV. 1999. [Google Scholar]
- 46.Strollo PJ, Rogers RM. Obstructive sleep apnea. N Engl J Med. 1996;334(2):99–104. doi: 10.1056/NEJM199601113340207. [DOI] [PubMed] [Google Scholar]
- 47.Turnbull NR, Battagel JM. The effects of orthognathic surgery on pharyngeal airway dimensions and quality of sleep. J Orthod. 2000;27(3):235–247. doi: 10.1179/ortho.27.3.235. [DOI] [PubMed] [Google Scholar]
- 48.van der Vorst HA. Bi-cgstab: a fast and smoothly converging variant of bi-cg for the solution of nonsymmetric linear systems. SIAM J Sci Stat Comput. 1992;13:631–644. [Google Scholar]
- 49.Venkatakrishnan V. On the accuracy of limiters and convergence to steady state solutions, No. AIAA-1993-0880. 1993. [Google Scholar]
- 50.Viegas JR, Rubesin MW, Horstman CC. On the use of wall functions as boundary conditions for two-dimensional separated compressible flows, No. AIAA-1985-0180. 1985. [Google Scholar]
- 51.Waite PD, Wooten V, Lachner J, Guyette RF. Maxillomandibular advancement surgery in 23 patients with obstructive sleep apnea syndrome. J Oral Maxillofac Surg. 1989;47(12):1256–61. doi: 10.1016/0278-2391(89)90719-2. discussion 1262. [DOI] [PubMed] [Google Scholar]
- 52.Xu C, Sin S, McDonough JM, Udupa JK, Guez A, Arens R, Wootton DM. Computational fluid dynamics modeling of the upper airway of children with obstructive sleep apnea syndrome in steady flow. Journal of Biomechanics. 2006;39(11):2043–2054. doi: 10.1016/j.jbiomech.2005.06.021. [DOI] [PubMed] [Google Scholar]
- 53.Young T, Peppard P. Epidemiology of obstructive sleep apnea. W. B. Saunders; London: 2002. pp. 31–43. [DOI] [PubMed] [Google Scholar]
- 54.Young T, Skatrud J, Peppard PE. Risk factors for obstructive sleep apnea in adults. JAMA. 2004;291(16):2013–2016. doi: 10.1001/jama.291.16.2013. [DOI] [PubMed] [Google Scholar]
- 55.Yu CC, Hsiao HD, Lee LC, Yao CM, Chen NH, Wang CJ, Chen YR. Computational fluid dynamic study on obstructive sleep apnea syndrome treated with maxillomandibular advancement. Journal of Craniofacial Surgery. 2009;20(2):426–430. doi: 10.1097/SCS.0b013e31819b9671. [DOI] [PubMed] [Google Scholar]


