

Abstract
One of the many services that intelligent systems can provide is the automated assessment of resident well-being. We hypothesize that the functional health of individuals, or ability of individuals to perform activities independently without assistance, can be estimated by tracking their activities using smart home technologies. In this paper, we introduce a machine learning-based method for assessing activity quality in smart homes. To validate our approach we quantify activity quality for 179 volunteer participants who performed a complex, interweaved set of activities in our smart home apartment. We observed a statistically significant correlation (r=0.79) between automated assessment of task quality and direct observation scores. Using machine learning techniques to predict the cognitive health of the participants based on task quality is accomplished with an AUC value of 0.64. We believe that this capability is an important step in understanding everyday functional health of individuals in their home environments.
Index Terms: Smart environments, Machine learning
I. INTRODUCTION
The maturing of ubiquitous computing technologies has allowed for application of these technologies to areas of critical need. One such area is ubiquitous monitoring of an individual’s cognitive and physical health. The possibilities of using smart environments for health monitoring and assistance are perceived as “extraordinary” [10] and are timely given the aging of the population [1][3].
We hypothesize cognitive impairment can be evident in everyday task performance. We also postulate that differences in task performance can be automatically detected between cognitively healthy (CH) individuals and those with dementia and mild cognitive impairment (MCI) using smart home and ubiquitous computing technologies. In one of the first projects to focus on this question, we investigate approaches for quantifying task performance and relate the automated scores to cognitive health of individuals.
Clinicians are interested in understanding everyday functioning of individuals to gain insights about difficulties that affect quality of life. Everyday functioning encompasses daily functional abilities such as cooking, managing finances, driving, and activities of daily living that individuals must complete to live competently and independently. In addition, deficits and changes in everyday functioning are considered as precursors to serious cognitive problems such as dementia and MCI [12]. As proxy measures for everyday functioning, clinicians use performance-based simulation measures administered in a laboratory and/or self-report and informant-report questionnaires of activities of daily living. Though these methods are thought to reflect activity performance in realistic settings, the assessment techniques are questioned for their ecological validity [6]. For example, self-report and informant-report are subject to reporter bias while data collected via simulation measures in a clinical setting may not capture subtle details of activity performance that occur in a home [22]. Among these methods, direct observation of the individual to determine everyday functional status is considered the most ecologically valid [6] [24].
When observing individuals performing everyday activities, clinicians can derive information about how well the individual is able to perform the activities. If important steps are skipped or performed incorrectly then the benefit of the activity is not realized and the mistake may be indicative of a health condition. Such activity mistakes may include forgetting to turn off the burner or taking a long time to complete a simple activity. When activities can be assessed in an individual’s own environment, they can help in characterizing daily behavior and pinpointing cognitive or physical difficulties.
In this paper, we propose a machine learning methodology to automatically quantify the quality of the performance of an activity with respect to how other individuals perform the same activity. We implement our approach to activity assessment in our smart home test bed and correlate our automated scores with measurements derived from direct observation of participant performances. Finally, we analyze correlation between activity quality and health diagnosis.
II. RELATED WORK
A smart home can be viewed as an environment in which computing and communications technologies employ artificial intelligence techniques to reason about and control our physical home setting [8]. In a smart home, sensor events are generated while residents perform their daily routines. A smart home is an ideal environment for performing automated health monitoring and assessment. Using this setting, no constraints are made on the resident’s lifestyle. As an example, Pavel et al. [17] hypothesized that change in mobility patterns are related to change in cognitive ability. They tested this theory by observing changes in mobility as monitored by motion sensors and found evidence to support the relationship between these changes and symptoms of cognitive decline. Lee and Dey [15] designed an embedded sensing system and presented information to older adults to determine if this information was useful to them in gaining increased awareness of their functional abilities.
The ability to perform automated assessment of task quality and cognitive health has recently been given a boost because activity recognition techniques are becoming more capable of accurately identifying the current task [7]. In our experiments, we rely upon environmental sensors including infrared motion detectors and magnetic door sensors to gather information about complex activities such as cooking, sleeping, and eating. The techniques we describe in this paper can also make use of wearable sensors such as accelerometers [23] as well as RFID tags and shake sensors [20].
While smart environment technologies have been studied extensively for the purposes of activity recognition and context-aware automation, less attention has been directed toward using the technologies to assess the quality of tasks performed in the environment. Some earlier work has measured activity correctness for simple sequential tasks. Cook et al. [9] developed a model to assess the completeness of activities. Similarly, Hodges et al. [14] correlate sensor events gathered during a coffee-making task with an individual’s neuropsychological score. Rabbi et al. [22] designed a sensing system to assess mental and physical health using motion and audio data. Allin and Ecker [2] used computer vision techniques to correlate motor statistic of stroke survivor’s motion obtained from multiple digital cameras with expert functional scores on the Arm Motor Ability Test.
In contrast to these other projects, we are analyzing data from parallel and interwoven activities and are correlating sensor features with scores derived from direct observation of performance on a complex task. This represents one of the first reported projects to use smart home technologies to automate such assessment for a large group of participants.
III. Background
The goal of this project is to perform automated assessment of tasks performed in a smart home. Given a sequence of sensor events that are generated while an activity is being performed, our algorithm will map the sequence onto a quantitative score. We assume that sufficient sensors exist to capture activity progression in detail and that the smart home captures the timing for each sensor event. In this project, we also assume that activities are complex with a number of independent sub-activities that may be interwoven with steps from other activities or sub-activities. This situation represents a challenge that recently has been addressed by the activity recognition community [21] [26].
A. The Test bed
Data is collected and analyzed using the Washington State University CASAS on-campus smart home test bed, an apartment that contains a living room, a dining area, and a kitchen on the first floor and two bedrooms, an office, and a bathroom on the second floor. The apartment is instrumented with motion sensors on the ceiling, door sensors on cabinets and doors, and item sensors on selected kitchen items. The test bed contains temperature sensors in each room, sensors to monitor water and burner use, and a power meter to measure electricity consumption. Item sensors are placed on a set of items in the apartment to monitor their use. Figure 1 shows the sensor layout in the CASAS smart home test bed. Activities for this study were performed in the downstairs of the apartment while an experimenter monitored the participant upstairs via a web camera and remotely communicated to the participant using a microphone and a speaker.
Fig. 1.
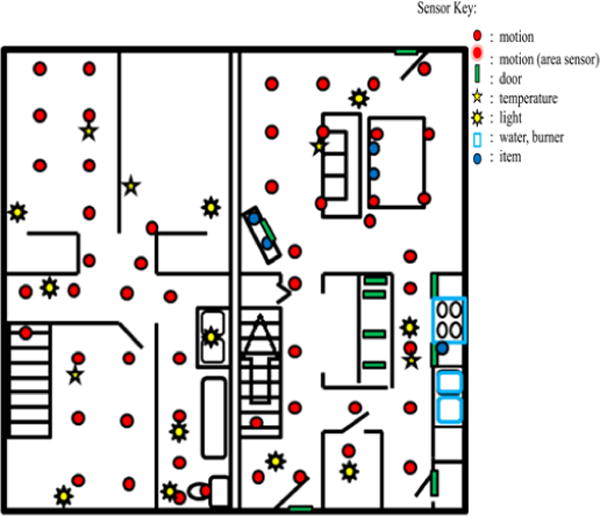
Apartment test bed floor plan and sensor layout.
Sensor events are generated and stored while participants perform activities. Each sensor event is represented by four fields: date, time, sensor identifier, and sensor message. The data files and corresponding video are examined by humans who annotate the data with the activity that is being performed that causes the sensor event to be generated. A sample of the collected sensor events, together with the corresponding labeled activities, is shown in Figure 2. The CASAS middleware collects sensor events and stores them in a SQL database. All software runs locally on a Dream Plug computer.
Fig. 2.
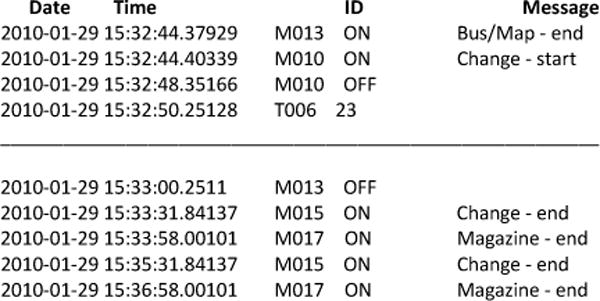
Sensor file format and sample annotation. Sensor IDs starting with M are motion sensors, D are door sensors, T are temperature sensors, and P are power usage sensors. The data is annotated with the start and end points of the subtasks. The sample annotation shows a participant interweaving the Magazine, Bus/Map, and Change tasks.
Formally, the input data to our algorithm is a sequence of sensor events, E, that is generated as an individual performs an activity, A, which is comprised of subtasks A1..An. A subtask Ai is represented by the corresponding sequence of n sensor events e1..en, the start time of the activity, the end time of the activity, and the activity label. Activity subtasks can be initiated in an arbitrary order and some activities or activity subtasks can be interwoven or parallelized. We state that activity A at sensor event ei is parallelized if there is more than one subtask open (started but not ended) at that time.
B. The Day Out Task
The ability to multi-task, or perform concurrent tasks or jobs by interleaving, has been said to be at the core of competency in everyday life [5]. We therefore designed a “Day Out Task” (DOT), a naturalistic task that participants complete by interweaving subtasks. Participants were told to imagine that they were planning for a day out, which would include meeting a friend at a museum at 10am and later traveling to the friend’s house for dinner. The eight subtasks that need to be completed to prepare for the day out are explained and participants are told to multi-task and perform steps in any order to complete the preparation as efficiently as possible. Participants are also provided with a list and brief description of each subtask that they can refer to during DOT completion. The eight subtasks are:
Magazine: Choose a magazine from the coffee table to read on the bus ride.
Heating pad: Microwave for 3 minutes a heating pad located in the kitchen cupboard to take on the bus.
Medication: Right before leaving, mime taking motion sickness medicine found in the kitchen cabinet.
Bus map: Plan a bus route using a provided map, determine the time that will be needed for the trip and calculate when to leave the house to make the bus.
Change: Gather correct change for the bus.
Recipe: Find a recipe for spaghetti sauce in a book and collect ingredients to make the sauce with a friend.
Picnic basket: Pack all of the items in a picnic basket located in the closet.
Exit: When all the preparations are made, take the picnic basket to the front door.
C. Experimental Setup
Participants initially completed standardized and experimental neuropsychological tests in a lab. A Neuropsychology faculty member analyzed the test data to diagnose participant’s cognitive health. Participants in the dementia group met DSM-IV-TR criteria for dementia [4], which includes the presence of multiple cognitive deficits that negatively affect everyday functioning and represent a decline from a prior level of functioning. Inclusion criteria for MCI were consistent with the diagnostic criteria defined by Petersen [18] [19] and with criteria outlined by the National Institute on Aging – Alzheimer’s Association workgroup [1].
After completing the clinical tests, participants attempted the DOT task in our smart home test bed. While participants were completing the DOT, two experimenters (trained graduate students) remained upstairs in the apartment, watching participant performances through live feed video. As participant completed the DOT, the examiners recorded the time each subtask began and ended, events being interweaved, and subtasks goals being completed (e.g., retrieves magazine). As the individuals perform activities in the smart home, generated sensors events are recorded. Research team members (graduate students) annotated the sensor data to relate events with the label of the subtask that the individual was performing when the event was triggered. Figure 2 shows a sample of the collected and annotated sensor data. Subtask accuracy scores and task sequencing scores were later assigned by coders after watching the video. Figure 3 illustrates this process.
Fig. 3.
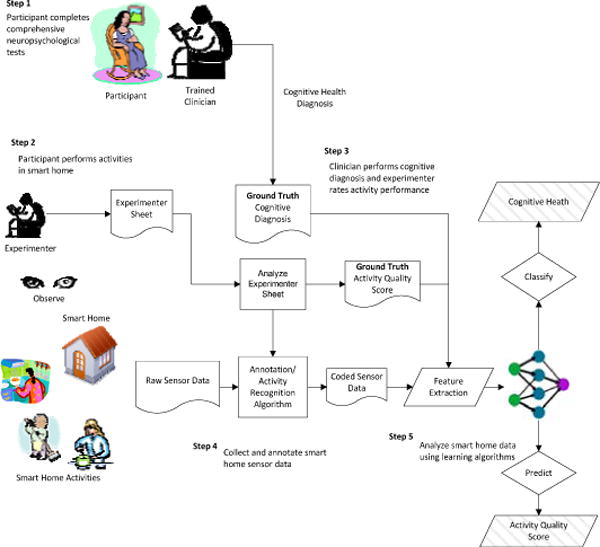
Automated task assessment steps.
To validate our approach for activity assessment, we include participants (N=179) who completed at least two of the eight DOT subtasks. Among the participants included for analysis, 145 were cognitively healthy, 2 were diagnosed with dementia and 32 were diagnosed with MCI. We excluded 14 dementia participants who could not complete at least two DOT subtasks. The participant pool included 141 females and 38 males, with 37 (N=37 CH) participants under 45 years of age (Young Young), 27 participants (N=4 MCI, N=23 CH) age 45–59 (MiddleAge), 84 (N=1 dementia, N=20 MCI, N=63 cognitively healthy) participants age 60–74 (YoungOld), and 31 (N=1 dementia, N=8 MCI, N=22 CH) participants age 75+ (OldOld). The participants who completed only two subtasks took 10.4 ± 3.44 minutes in average to complete DOT while participants who completed all subtasks completed DOT in 9.83±3.26 minutes to complete DOT. In average, participants took 10.33 ± 3.85 minutes to complete DOT task.
D. Task Scoring
Two trained neuropsychologists watched the video data and, in conjunction with examiner-recorded data, assigned a task accuracy score and a sequencing score. The task accuracy score was based on the correctness and completeness of each of the eight subtasks. A correct and complete subtask received a lower score while an incorrect, incomplete, or uninitiated subtask received a higher score. The scoring criteria are listed in Tables 1 and 2. The final accuracy score was obtained by summing the individual scores of each task and thus ranged from 8 to 32. The task sequencing score represents whether the participant sequenced six of the DOT subtasks correctly. Participants received 1 point for each correct sequence (e.g., put the heating pad in the microwave for 3 minutes as one of the first four subtasks). The normalized range of scores is 1 to 6 such that lower score indicates a more correct and/or efficient sequencing of subtasks. Two coders, blinded to group assignment, independently assigned scores to participants based on specific criteria as they directly viewed the participants’ task performance. Inter-rater reliability agreement for the accuracy and sequencing scores was 97.88% and 99.57%, respectively, and was calculated by dividing the number of responses by the total discrepancies due to double scoring [24]. Figure 4 shows the distribution of the direct observation scores, accuracy, and sequencing score grouped by participant cognitive diagnosis.
TABLE 1.
CODING SCHEME TO ASSIGN ACCURACY SCORE TO EACH SUBTASK
| Accuracy score | Criteria |
|---|---|
| 1 | Complete/Efficient |
| 2 | Complete/Inefficient |
| 3 | Incomplete/Inaccurate |
| 4 | Never Attempted |
TABLE 2.
CODING SCHEME TO ASSIGN SEQUENCING SCORE TO EACH SUBTASK. TOTAL SEQUENCING SCORE IS THE COUNT OF “YES” RESPONSES TO THESE CRITERIA.
| ID | Criteria |
|---|---|
| 1 | Heating pad started as one of first four activities. |
| 2 | Picnic basket retrieved as one of first four activities. |
| 3 | Cost of bus fare determined prior to first attempt at retrieving change. |
| 4 | Recipe read prior to retrieving first food item. |
| 5 | Motion Sickness pill taken near end. |
| 6 | Picnic basket moved to front door as one of last two activities. |
Fig. 4.
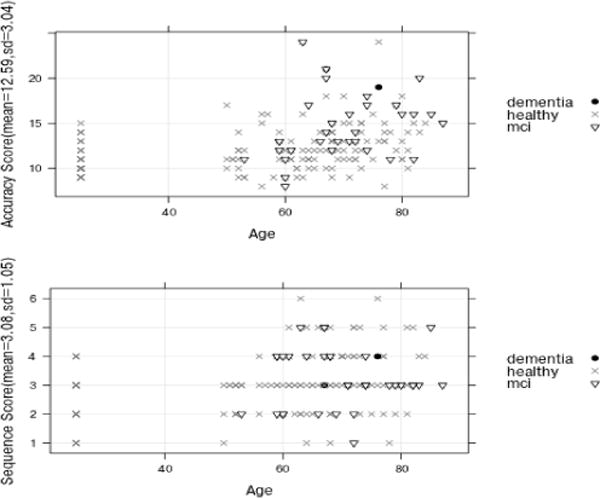
Distribution of the neuropsychologist direct observation scores, accuracy scores and sequencing scores, with participant’s cognitive diagnosis indicated by point type. Individual participants are organized by age on the x axis and by the corresponding score on the y axis.
IV. FEATURE EXTRACTION
To assess an individual’s performance on the DOT, we derive features from sensor data that reflect task performance and can be input to a machine learning algorithm to quantify task quality. We define DOT performance based on the nature of activity completion and execution of the activity subtasks. A participant efficiently executes DOT if he multitasks DOT subtasks and sequences them correctly. Similarly, time taken to complete the entire DOT activity and number of sensors triggered during activity completion explains the participant’s DOT performance. Features were chosen based on prior studies which found that, in comparison to cognitively healthy older adults, individuals with MCI complete everyday activities (e.g., locating nutrition information on food labels, making toast, medication management) more slowly and commit more errors, including errors of commission, omission [24], and task sequencing/tracking [25]. We note that in this study the activity start points and end points were generated by human annotators. However, we can use activity recognition algorithms to automate this step [26]. These features are explained below.
A. Duration
We use the duration feature to represent the total wall clock time that the participant takes to complete the entire set of DOT activities. The time to complete an activity can indicate participant’s age, mobility and overall cognitive health. If subtasks are executed independently then we can consider the time for each subtask as a separate feature. For the DOT, subtasks are interleaved and performed in parallel, so we consider time taken for the entire DOT.
B. Number of Sensors and Sensor Events
This feature reflects the spatial areas and objects that are manipulated while DOT is being performed. The number of sensors indicates the number of different sensor identifiers that generate events during the DOT, while the number of sensor events keeps track of the number of events that is generated by each unique sensor in the space. These counts provide insight on the type of activities that are being performed and how well the participant stays on the task. For example, some participants wandered out of the normal activity region, used incorrect tools for a subtask, or explored the same space, cabinet or region repetitively as they attempted to complete the appropriate subtask.
B. Parallelism
Participants in our study were encouraged to multitask the DOT subtasks as much as possible to complete the DOT quickly. The ability to multitask varied dramatically among individuals and was expected to present a challenge for those with dementia and MCI. We were therefore interested in quantifying the amount of parallelism or multitasking that existed in an individual’s performance of the DOT.
To quantify parallelism, we introduce a variable called activity level, ai, that represents the number of activities that are open (i.e., that have been started but not completed), at the time that sensor event i is generated. A set of activity levels {a1, a2,..,an} can be defined for all of the sensor events that were generated during the DOT. To represent this set more succinctly we employ run length encoding (RLE). A run for an activity level is a string of equal-valued activity levels. RLE encodes runs of activity levels as activity levels with corresponding counts, as shown in Figure 5. Based on run length encoding, we derive a M × N run length matrix P, where M is the maximum activity level and N is the length of the sensor sequence. Each element of the matrix, P(x,y), represents the number of runs of length y corresponding to activity level x, or the number of times that activity level x occurs y consecutive times. A similar technique has been used to analyze computed tomography volumetric data to capture various text characteristics [11].
Fig. 5.
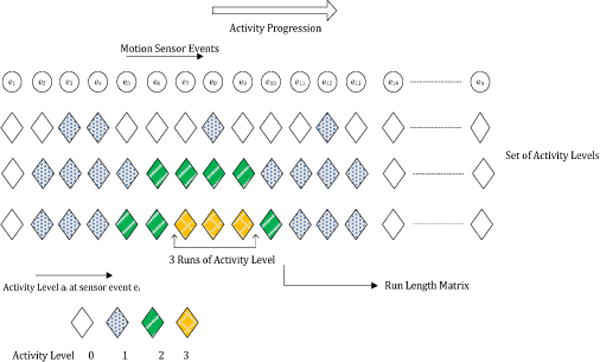
Sets of activity levels for three participants. The first item of the set represents activity level at the initial sensor event. As activity progresses, sets are augmented with activity levels for different sensor events. For example, during the eighth sensor event e8, participant III has activity level 3 and participant I has 1. The run length matrix takes this activity level set as input.
We introduce two measures, the High Activity-Level Run Measure (HALRM) and the Low Activity-Level Run Measure (LALRM), to capture a participant’s level of task parallelism that occurred over a sequence of sensor events. If a participant parallelizes subtasks for a longer period of time we expect his HALRM to be high, while if he does not parallelize subtasks his LALRM measure would be high.
| (1) |
| (2) |
Based on these two measures, we define the parallelizing index, Pindex, to represent the amount of task interweaving that is performed. Pindex is computed as the ratio of HALRM to LALRM, as shown in Equation 3.
| (3) |
As Equation 3 indicates, a higher parallelizing index indicates a higher level of parallelism in the activity. It does not reflect a higher quality of DOT. For example, a participant may have a high Pindex because he initiated many of the subtasks. On the other hand, he may leave subtasks incomplete or take a long time to complete the subtasks. The Pindex does provide particularly useful insights on task quality when combined with the other task features.
C. Number of Complete Activities
Not all participants completed all DOT subtasks. We thus introduce an ActivitiesCompleted feature which indicates whether the participant completed all of the DOT subtasks.
D. Pattern Sequencing
In the case of a complex activity such as the DOT, subtasks can be performed with many order variations. For instance, one participant might choose a magazine first, while another might start by first looking up a recipe. Participants are expected to parallelize subtasks for efficiency. However, some subtask sequences and parallelisms are more efficient than others. As an example, if a participant starts the DOT by microwaving a heating pad, they are able to complete other tasks while waiting for the microwave to finish. If they wait until the end of the DOT to microwave the heating pad this parallelism is not possible. We hypothesize that the sequence in which tasks are performed influences the amount of parallelism that can be achieved and thereby affects the efficiency of the overall task.
To represent task sequencing choices, we define a DOT sequencing vector s1, s2,..,s8 that encodes the order in which an individual started various tasks (in the DOT, there are 8 such tasks to choose from). For example, the sequencing vector (2, 3, 1, 4, 5, 6, 7, 8) indicates that the 2nd task in the set was initiated first, followed by the 3rd task, then the 1st task, and so forth. If an individual does not initiate a particular task, then the corresponding position in the vector sequence is treated as missing based on the sequences that were performed by others in the population.
E. Activity Interruptions
In the case of activities that involve waiting for an event (e.g., waiting for the Heating Pad to warm up), interrupting the activity to finish other tasks is both efficient and is an indication that the participant is capable of generating more complex plans that interweave multiple activities. However, for activities that take a short time to complete such as Change and Bus/Map, participants will likely complete the task without interruptions. To capture differences in interruptions on various activities, we define activity interruption features based on all DOT subtasks. For long activities, such interruptions may indicate that the participant is able to generate a complex and efficient DOT solution.
The set of extracted features is summarized and categorized in Table 3. We hypothesize that these smart home features will allow us to provide automated task quality scores that correlate with task scores obtained by direct observation.
TABLE 3.
DOT FEATURE SET
| Feature Set | Feature Type |
|---|---|
| DOT features | Duration, sensor counts, sensor events, activity completeness |
| Interruption features | Number of activity interruptions |
| Sequencing features | Sequence vector |
| Parallelism feature | Pindex |
V. AUTOMATED SCORING
DOT task accuracy and task sequencing scores are derived from direct observation of participant’s task performance. We used machine learning techniques to identify correlation between our automated feature set based on smart home sensor data and the direct observation scores. We describe two approaches to automated scoring: supervised learning and using unsupervised learning techniques.
A. Supervised Scoring Models
We formulate the automated scoring problem as a supervised learning problem in which a learning algorithm learns a function that maps the sensor-derived features to the direct observation scores. We use a support vector machine (SVM) with sequential machine optimization and bootstrap aggregation or bagging to learn the mapping. Support vector machines identify class boundaries that maximize the size of the gap between the boundary and data points. The bootstrap aggregation improves performance of an ensemble learning algorithm by training the base classifiers on randomly-sampled data from the training set. The learner averages individual numeric predictions to combine the base classifier predictions and generates an output for each data point that corresponds to the highest-probability label. We use both supervised regression and classification algorithms in our supervised scoring models.
B. Unsupervised Scoring Models
A score that is generated by a supervised learning algorithm predicts the quality of an activity in a way that emulates human-assigned scores. In contrast, unsupervised techniques use characteristics of the data itself to identify natural boundaries between activity performance classes. Here we derive unsupervised scores using a dimensionality reduction technique. Dimensionality reduction techniques reduce a high-dimensional dataset to one with a lower dimension. We use this to reduce the feature set to a single numeric score.
While we use Principal Component Analysis (PCA) to reduce the dimension, many reduction techniques would be appropriate for this task [16]. PCA is a linear dimensionality reduction technique that converts sets of features in a high-dimensional space to linearly uncorrelated variables, called principal components, in a lower dimension such that the first principal component has the largest possible variance, the second principal component has the second largest variance, and so forth. After reducing the dimension, we use min-max normalization to convert the variables to a uniform range.
C. Cognitive Assessment Models
In our final step, we evaluate the use of smart home techniques to automate the cognitive health assessment of participants based on sensor-based features that describe their activity performance. We map each participant to one of the three cognitive groups: Dementia (D), Mild Cognitive Impairment (MCI), or Cognitively Healthy (CH). To accomplish this, we extract the same sensor-based activity features that were used for the earlier experiments, as explained in Section 4. We obtain ground truth cognitive health labels for each participant from a battery of standardized and experimental neuropsychological tests that were administered in a clinical setting. We then train learning algorithms to learn a mapping from the sensor-based activity features to the cognitive health label (CH, MCI or D).
VI. EVALUATION
Our goal is to design smart home technologies to automate assessment of task quality and of cognitive health. We evaluate our approaches using data collected on a smart home test bed. We evaluate the two tasks separately. To evaluate the ability to automate assessment of task quality, we compare scores generated from our smart home algorithm with direct observation scores generated from neuropsychologists and to evaluate the ability to automate assessment of cognitive health, we compare diagnoses generated from our algorithms with diagnoses based on clinical tests.
We perform four experiments to evaluate our smart home-based task quality assessment algorithms. First, we measure the correlation between subsets of our smart home sensor features and direct observation scores (Section A.1). Second, we measure the correlation between the entire set of sensor features and direct observation scores (Section A.2). Third, we assess how well a SVM correctly classifies task quality, using the direct observation scores as ground truth labels (Section A.3). Finally, we determine how well the scores derived using unsupervised algorithm correlates with direct observation scores (Section B.1).
In addition, we evaluate learning algorithms using different participant groups that we construct based on their cognitive diagnosis (D, MCI, and CH) and number of subtasks they complete. Since the number of cognitively healthy participants is large, we further divide them to Older adults (Middle Age, Young Old, and Old Old) and Younger adults (Young Young). These sample groups have different heterogeneity. We refer to a sample group as heterogeneous if it contains examples of both well-conducted and poorly conducted activities. Training set containing instances of cognitively healthy individuals who commit fewer mistakes tend to be less heterogeneous as compared to training set containing instances of both cognitively healthy individuals and individuals with MCI who often commit more mistakes. Similarly, individuals who complete fewer subtasks normally commit more mistakes than individuals who complete a higher number of subtasks. By training learning algorithm using these sample subsets, we can understand how the heterogeneity impacts the performance of the learning algorithms and helps us to understand the features of these different groups.
We next evaluate the ability of our learning algorithm to map smart home activity sensor features to a cognitive health diagnosis. We train learning algorithms using smart home data and the cognitive health assessments provided by trained clinicians (Section C) and evaluate them using two metrics: the Area under the ROC curve (AUC) and the F-score.
ROC curves assess the predictive behavior of a learning algorithm independent of error cost and class distribution. We plot false positives vs. true positive at various threshold settings to obtain a ROC curve. The area under the ROC curve (AUC) provides a measure that evaluates the performance of the learning algorithm independent of error cost and class distribution [30]. Similarly, the F-score is the harmonic mean of the precision and recall and is defined as [30]:
A. Evaluation of Supervised Scoring Models
A.1 Feature Subset Correlation
For our experiment, we consider alternative feature subsets summarized in Tables 4 and 5. For each subset, we generate the correlation coefficient between the feature values derived from smart home sensor data and the experimenter direct observation scores (the accuracy score and sequencing score). In addition, we also analyze varying subsets of participants. Specifically, we consider subgroups of participants corresponding to the individuals with dementia (sample D), individuals with MCI (sample M), older adults (sample OA), and younger adults (sample YA). The objective of the experiment is to identify the correlation that exists between smart home task feature subsets for each participant and the activity quality score for the participant provided by trained clinicians and based on direct observation of the activity.
TABLE 4.
CORRELATIONS BETWEEN FEATURE SUBSETS, PARTICIPANT GROUPS, AND THE ACCURACY DIRECT OBSERVATION SCORE. SAMPLES ARE D=DEMENTIA, M=MCI, OA=COGNITIVELY HEALTHY OLDER ADULT, YA= COGNITIVELY HEALTHY YOUNGER ADULT
| Correlation coefficient (r) | |||||||
|---|---|---|---|---|---|---|---|
| Participant sample | {D,M,OA,YA} | {D,M,YA} | {OA,YA} | {YA} | {M,YA} | {M} | {M,YA} |
| Sample Size | 179 | 177 | 145 | 37 | 69 | 32 | 140 |
| DOT features | 0.58**ǂ | 0.57**ǂ | 0.57**ǂ | 0.52**ǂ | 0.54**ǂ | 0.44* | 0.55**ǂ |
| Interruption features | 0.31**ǂ | 0.32*ǂ | 0.25* | 0.21 | 0.27 | 0.40 | 0.36* |
| Sequencing features | 0.76**ǂ | 0.72**ǂ | 0.64**ǂ | 0.36* | 0.78**ǂ | 0.79**ǂ | 0.68**ǂ |
| Parallelism feature | 0.39**ǂ | 0.39**ǂ | 0.18* | 0.11 | 0.59**ǂ | 0.58**ǂ | 0.39**ǂ |
p<.05,
p<.005,
p<.05 with Bonferroni correction for n sample groups
TABLE 5.
CORRELATIONS BETWEEN FEATURE SUBSETS, PARTICIPANT GROUPS, AND THE SEQUENCING DIRECT OBSERVATIO SCORE. SAMPLES ARE D=DEMENTIA, M=MCI, OA= COGNITIVELY HEALTHY OLDER ADULTS, YA= COGNITIVELY HEALTHY YOUNGER ADULTS
| Correlation coefficient (r) | |||||||
|---|---|---|---|---|---|---|---|
| Participant sample | {D,M,OA,YA} | {M,OA,YA} | {OA,YA} | {YA} | {M,YA} | {M} | {M,OA} |
| Sample Size | 179 | 177 | 145 | 37 | 69 | 32 | 140 |
| DOT features | 0.10 | 0.01 | 0.21 | 0.21 | −0.01 | −0.27 | −0.08 |
| Interruption features | 0.43**ǂ | 0.42**ǂ | 0.45**ǂ | 0.47**ǂ | 0.28* | 0.22 | 0.34** |
| Sequencing features | 0.46**ǂ | 0.42**ǂ | 0.50**ǂ | 0.20 | 0.30* | −0.12 | 0.38**ǂ |
| Parallelism feature | 0.12 | 0.13 | 0.03 | 0.32 | 0.29* | 0.01 | 0.02 |
p<.05,
p<.005,
p<.05 with Bonferroni correction for n sample groups
From Tables 4 and 5, we see that correlations between most of the feature subsets and direct observation accuracy/sequencing scores are statistically significant. We find that the correlation between the smart home features and the observation-based accuracy score is stronger than the correlation with observation-based sequencing scores. A possible reason is that the task accuracy score quantifies the correctness and completeness of the eight DOT subtasks, which reflects the same type of information captured by smart home features. In contrast, the sequencing score quantifies how the DOT subtasks were sequenced, which is not as extensively captured by smart home features.
We find that feature subsets correlate differently with different training sample subsets. For instance, in Table 4 DOT features have stronger correlation with task accuracy score but parallelism feature has weak correlation when we train learning algorithms with cognitively healthy younger adult group (column {YA}). This indicates that a learning algorithm can better predict task accuracy with DOT features than parallelism features when training set contains examples of cognitively healthy individuals. Similarly, in Table 4 we see that the parallelism features correlates higher when sample subsets of training data contain individuals with MCI and younger adults (column {M,YA}) but does not when it contains cognitively healthy individuals(column {YA}) indicating that parallelism features can better represent differences between younger adults and MCI. Thus, we see that predictive power of a feature set depends on participant groups.
In addition, we visualize the relationship between selected feature types and the direct observation scores. Figure 6 plots the order in which subtasks were initiated within the DOT. As the figure shows, most participants placed Bus Map first in their sequence and almost all participants initiated the Exit subtask last. There is a fairly consistent choice of ordering among the subtasks for all participants, with the greatest variation occurring in positions 3, 6, and 7 of the sequence. We thus conclude that task sequencing plays an important role in such a complex activity as the DOT and should be analyzed as a part of overall task quality.
Fig. 6.
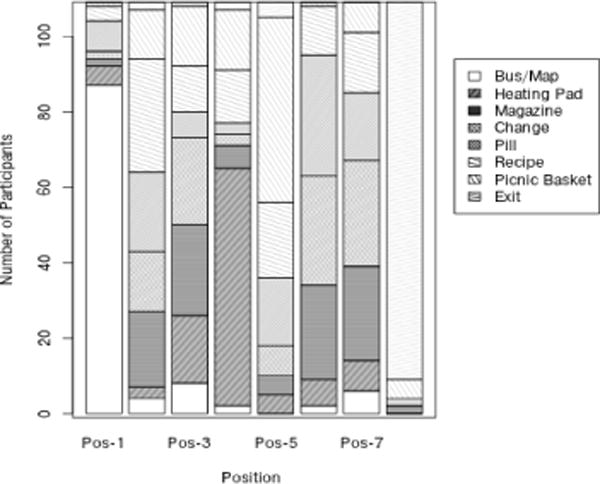
DOT subtask order for the participants who completed all 8 subtasks. The x axis represents the subtask sequence position (1..8). The y axis represents the number of participants. Each bar corresponds to the number of participants that put a particular subtask in the given position of the subtask sequence order.
In a separate step, we plot the relationship between Pindex (the parallelism feature) and the direct observation scores. As shown in the left plot in Figure 7, Pindex consistently increases with accuracy score. The figure also shows a relationship between Pindex and the sequence score, although it is not as distinct. We note that when a participant initiates but does not complete subtasks their task quality degrades which increases their Pindex score. Correspondingly, as mentioned in Table 1, their accuracy score increases as well.
Fig.7.
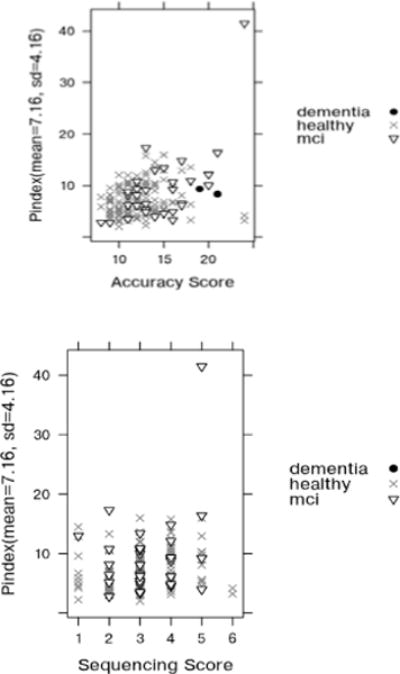
Scatter plot of Pindex vs. Accuracy Score (top) and Pindex vs. Sequencing Score (down) with participant’s cognitive diagnosis indicated by point type. The point in the upper right represents a participant who started all DOT subtasks but could only complete two of them.
A.2 Combined Feature Correlation
In this experiment, we use the SVM regression and bootstrap aggregation to learn a regression model that finds a fit between the combined set of feature values and the accuracy and the sequencing direct observation score. There are two objectives of this experiment. The first objective is to evaluate the correlation between the smart home DOT features and direct observation scores (accuracy and sequencing scores). The second objective is to study how the correlations between the smart home features and direct observation scores vary as different subsets of participants are considered. We first analyze the relationship for separate participant groups based on how many subtasks they completed then we look at the relationship for the participant groups based on their cognitive diagnosis. The results are summarized in Tables 6 and 7. In each table, the first row shows the correlation between the entire participant subgroup and the direct observation scores.
TABLE 6.
CORRELATIONS BASED ON NUMBER OF SUBTASKS COMPLETED
| #Completed subtasks | Sample size (n) |
Accuracy score | Sequencing score |
|---|---|---|---|
| 2 | 179 | 0.79**ǂ | 0.45**ǂ |
| 3 | 174 | 0.77**ǂ | 0.36**ǂ |
| 4 | 172 | 0.76**ǂ | 0.41**ǂ |
| 5 | 167 | 0.75**ǂ | 0.37**ǂ |
| 6 | 154 | 0.65**ǂ | 0.43**ǂ |
| 7 | 137 | 0.57**ǂ | 0.48**ǂ |
| 8 | 83 | 0.43**ǂ | 0.49**ǂ |
p<.05,
p<.005,
p<0.05 with Bonferroni correction for n sample groups
TABLE 7.
CORRELATIONS BASED ON COGNITIVE DIAGNOSIS
| Cognitive Diagnosis | Sample size (n) |
Accuracy score | Sequencing score |
|---|---|---|---|
| {D,M,OA,YA} | 179 | 0.79**ǂ | 0.45**ǂ |
| {M,OA,YA} | 177 | 0.80**ǂ | 0.43**ǂ |
| {OA,YA} | 145 | 0.75**ǂ | 0.57**ǂ |
| {YA} | 37 | 0.70**ǂ | 0.41**ǂ |
| {M,YA} | 69 | 0.81**ǂ | 0.27* |
| {M} | 32 | 0.75**ǂ | −0.09 |
| {M,OA} | 140 | 0.78**ǂ | 0.34**ǂ |
p<.05,
p<.005,
p<0.05 with Bonferroni correction for n sample groups
We find that the correlation depends on the heterogeneity in the samples. For example, the strongest correlation is found when examining the population subgroup that contains both MCI and cognitively healthy younger adults and the weakest correlation is found when examining only cognitively healthy individuals. Similarly, we find that the correlation decreases as participant subgroups that completed more subtasks are included. This is because having a large number of incorrect and inefficient tasks helps the learning algorithm to make better predictions due to the variation that is present in the data. The variations in the samples of cognitively healthy individuals who completed all subtasks are relatively low.
We also find that the correlation is consistently stronger for the accuracy score than the sequencing score. This is because the accuracy score takes into account the mistakes that an individual makes in a subtask while the sequencing score only considers how a participant initiated an activity. When we examine the correlation between the combined set of features and the direct observation scores for the entire population, we see that the coefficient is fairly high (r=0.79 for the accuracy score, p<0.005). This result indicates that automatically derived feature values generated from smart home data do provide valuable information that can be used to assess task quality and that the quality score is fairly consistent with those obtained through direct observation.
A.3 Supervised Classification of Task Quality
In this experiment, we train multiple learning models to classify task quality score. We choose the accuracy score as our basis of comparison with automated scores because the correlation coefficients between features derived from sensor data with the accuracy score were consistently higher than the correlation between features from the sensor data and the sequencing score. We divide the scores into two classes using equal-frequency binning. Table 8 shows the results of the experiments when all samples are included. All results are generated using leave one out cross validation. The machine learning models that are tested include an SMO-based support vector machine, a neural network, and a naïve Bayes classifier. We see that learning algorithms are indeed effective at classifying task quality based on direct observation scores.
TABLE 8.
PERFORMANCE OF THE CLASSIFIERS ON THE CLASSIFICATION OF TASK QUALITY
| Learning algorithm | Accuracy | F-score | AUC | |
|---|---|---|---|---|
| Class A | Class B | |||
| SVM | 80.45 | 0.84 | 0.76 | 0.85 |
| Neural Network | 79.33 | 0.82 | 0.74 | 0.85 |
| Naïve Bayes | 82.13 | 0.85 | 0.78 | 0.88 |
B. Evaluation of Unsupervised Scoring Models
In our next experiment, we analyze the correlation between unsupervised learning model-based generation of a sensor-derived score using Principal Component Analysis and the direction observation-based accuracy score and sequencing score. The objective of this experiment is to test the performance of unsupervised learning models in predicting DOT activity quality scores and determine if the performance of an unsupervised algorithm is comparable to that of a supervised learning algorithm. We first analyze the relationship for separate participant groups based on how many subtasks they completed then we look at the relationship for the participant groups based on their cognitive diagnosis. The results are summarized in Tables 9 and 10. Figure 8 shows the plot of the PCA score that is obtained by reducing the feature space to a single dimension as a function of the accuracy and sequencing scores.
TABLE 9.
CORRELATIONS BASED ON NUMBER OF SUBTASKS THAT ARE COMPLETED USING PCA
| #Completed subtasks | Sample size (n) | Accuracy score | Sequencing score |
|---|---|---|---|
| 2 | 179 | 0.57**ǂ | 0.23**ǂ |
| 3 | 174 | 0.46**ǂ | 0.14 |
| 4 | 172 | 0.45**ǂ | 0.13 |
| 5 | 167 | 0.50**ǂ | 0.13 |
| 6 | 154 | 0.48**ǂ | 0.13 |
| 7 | 137 | 0.47*ǂ | 0.10 |
| 8 | 83 | 0.43**ǂ | 0.10 |
p<.05,
p<.005,
p<.05 with Bonferroni correction for n sample groups
TABLE 10.
CORRELATIONS BASED ON COGNITIVE DIAGNOISIS COMPUTED USING PCA
| #Cognitive Diagnosis | Sample size (n) | Accuracy score | Sequencing score |
|---|---|---|---|
| {D,M,OA,YA} | 179 | 0.57**ǂ | 0.23**ǂ |
| {M,OA,YA} | 177 | 0.56**ǂ | 0.23**ǂ |
| {OA,YA} | 145 | 0.44**ǂ | 0.17 |
| {YA} | 37 | 0.06 | 0.47**ǂ |
| {M,YA} | 69 | 0.77**ǂ | 0.38* |
| {M} | 32 | 0.79**ǂ | 0.32* |
| {M,OA} | 140 | 0.51**ǂ | 0.17* |
Fig. 8.
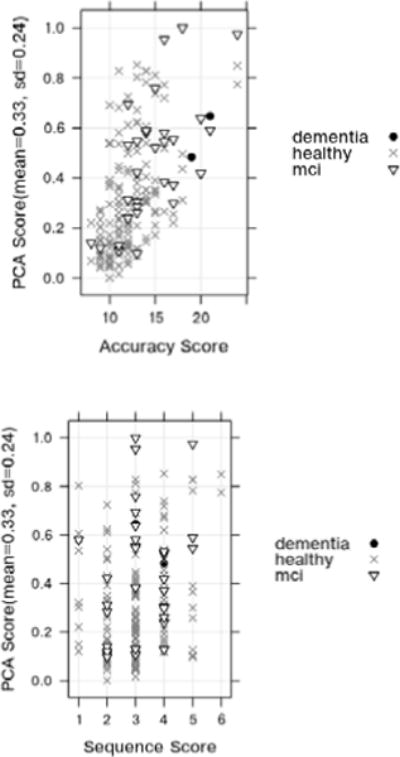
PCA score vs. Accuracy score (top) and PCA score vs. Sequencing score (down).
Similar to previous observations, we find that the correlation depends on the heterogeneity in the samples. For example, the strongest correlation is found when examining the population subgroup that contains both MCI and cognitively healthy younger adults. The correlation coefficient between the unsupervised score and the direct observation accuracy score is 0.57 (p<0.005). This indicates that a fairly strong positive correlation exists between the automated scores and experimenter-generated scores of task quality. Furthermore, this value is similar to the values generated for the SVM model, which indicates that task quality can be computed directly using smart home sensor data without relying on training from human-provided scores.
C. Evaluation of Cognitive Assessment Models
The second goal of this project is to design a learning approach to automate cognitive health assessment based on smart home features. For this study, we map each participant to one of three labels: CH, MCI, or Dementia (D). We use labels provided by clinical testing to train the learning algorithm. Note that this data is based on a battery of standardized and experimental neuropsychology tests administered in a laboratory setting and not on the smart home data. We handle the assessment as a set of binary classification problems.
Class imbalance is a challenge in learning a discriminative model between these three classes. While there are 145 cognitively healthy individuals, there are 32 individuals with MCI and only 2 participants with dementia. Part of this imbalance is because many dementia participants had difficulty completing basic everyday tasks independently. Class imbalance affects classification performance because machine-learning models tend to label the points with the majority class label. To address this issue, we use cost sensitive versions of machine learning algorithms for each of the base classifiers. A cost sensitive classifier assigns misclassification costs separately for individual class labels and reweights the samples during training according to this cost. This allows the classifier to achieve overall strong performance even when the training points are not evenly divided among the alternative classes [27], as is the case with this dataset.
We initially train a learning algorithm to label CH and MCI participants. We use PCA to reduce the dimensionality of the feature vector and train a cost-sensitive version of a support vector machine. We compare this with an alternative approach in which we handled the class imbalance by under-sampling the majority class so that the ratio of the Cognitively Healthy group to the MCI group is 2:1. The results of this experiment are summarized in Table 11. To compare automated diagnosis based on smart home features with diagnosis based on direction observation features, we train a learning algorithm to map direct observation scores to cognitive health diagnosis labels. The AUC value for this mapping is 0.68 in the best case (using naïve Bayes and under sampling). The predictive performance overall is not as strong as we would like to see for this case, in part because performance of CH and MCI participants is actually quite similar on familiar activities such as those used in the DOT. The individuals in these two groups do have quite a bit of overlap in functional performance as is evident in Figure 7.
TABLE 11.
PERFORMANCE OF THE MACHINE LEARNING CLASSIFIERS ON THE SUPERVISED CLASSIFICATION OF COGNITIVE HEALTH (MCI/COGNITIVELY HEALTHY)
| Learning algorithm | F-score | AUC | |
|---|---|---|---|
| Class A | Class B | ||
| PCA + SVM with Cost Sensitive Learning | 0.39 | 0.73 | 0.64 |
| Under sampling of Majority Class + Bagged SVM | 0.34 | 0.44 | 0.61 |
Our next objective is to compare the Cognitively Healthy group with the Dementia group. We have a limited number of data points for the dementia group because out of 16 dementia participants only 2 completed the DOT. Hence, we perform an exploratory experiment to compare these two groups by under-sampling the Cognitively Healthy class so that the ratio of Cognitively Healthy data points to Dementia data points is 4:1 and ensuring that one Dementia participant would be used each time for training and the other would be used for testing. The results are averaged and summarized in Table 12. As expected, these two groups are much easier to distinguish. To obtain stronger classification performance, we can include all participants with dementia and represent the sensor features as missing for participants with dementia and noting the number of tasks that were completed as 0. These experiments provide evidence that the learning algorithm can indicate the cognitive health of an individual based on activity performance.
TABLE 12.
PERFORMANCE OF THE MACHINE LEARNING CLASSIFIERS ON THE SUPERVISED CLASSIFICATION OF COGNITIVE HEALTH (DEMENTIA/COGNITIVELY HEALTHY)
| Learning algorithm | F-score | AUC | |
|---|---|---|---|
| Class A | Class B | ||
| Under sampling + Bagged SVM | 0.52 | 0.52 | 0.58 |
| Missing Values+ SVM | 0.93 | 0.99 | 0.94 |
VII. Observations
Researchers have hoped that ubiquitous computing technologies could be used to support health monitoring and aging in place. This study provides an indication that with smart home sensor data and machine learning algorithms it is possible to automatically predict the quality of daily activities.
One must carefully interpret the results that we have mentioned. We note that the correlation (r) between smart home features and task accuracy scores is statistically significant. We can conservatively analyze the correlation coefficient using a coefficient of determination. We square the correlation coefficient to obtain the coefficient of determination. A coefficient of determination of 0.62 (r=0.79) means that the 62% of the variation in the dependent variable can be explained by the variation in the independent variable. Our current results show that our method explains nearly 62% variations in the direct observational scores. Unexplained variation can be attributed to limitations of sensor system infrastructures and algorithms.
This implies that smart home technologies provides valuable information to assess the qualities of daily activities. In other hand, predicting cognitive health based on the performance on activities of daily living is an active research area in clinical research [24]. Thus, we believe that smart home based technologies can monitor activities of daily living and predict cognitive health of an individual. Our results indicate this as a possibility.
We observe from the experiments that the performance of automatic task quality prediction depends on the type of training samples. The learning algorithm offers accurate predictions when the training samples contain heterogeneous data points of both well-conducted activities and poorly-conducted activities. We observe that sequencing features are less indicative when all of the participant samples are cognitively healthy, while parallel features are indicative when we include MCI and younger adult participant samples. We therefore conclude that researchers need to carefully define and extract appropriate features from sensor data to use in building an assessment model. In addition, for our study the baseline for performance is a direct observation score based on coders observation of task performance. Two coders independently assigned scores to participants based on specific criteria as they directly viewed the participant’s task performance. We cannot ignore that there may be some error or bias in these direct observation scores. This error can be mitigated by increasing the number of clinicians scoring the activities or by automatically detecting and correcting for bias.
Our approach to perform automated cognitive health assessment using smart home sensors and algorithms has a few limitations. The first limitation is due to the coarse granularity of the home-based sensors. While environment sensors face fewer practical issues of user acceptance, placement, and battery charge, our algorithms would benefit from data provided by wearable, smart phone, and object sensors. Also, many participants with cognitive difficulties were not able to complete the activities. We can address this issue by increasing our sample of participants. We note that the complexity of DOT was necessary to capture differences in task performance between cognitively healthy and MCI participants, but additional tasks that are less complex but still involve multi-tasking can be devised for future studies.
Similarly, the limitations of experimental methodology are that assessment technique relies on participants completing scripted activities in a single smart home setting. These types of methods are argued to be ecologically valid [6] but participants can perform activities in an unnatural manner due to the unfamiliar environment, the scripted manner of the activity, or the awareness of being monitored. In addition, we use direct observation scores and clinician-based cognitive diagnosis as ground truth labels to train our learning models. Instead, we would like to learn models based on differences in natural activity performance between individuals who are known to be cognitive healthy and those who are known to have cognitive difficulties. Finally, some of the derived features rely on human annotation of sensor data. We can avoid this annotation step by using activity recognition algorithms that can recognize interleaved and parallel activities as well as activity steps.
The study described in this paper is a step toward our overall goal of performing cognitive health assessment in smart homes. The direct observation scores mentioned in this paper are based on a traditional form of assessment in which patients travel to a lab or doctor’s office and are tested by trained clinicians. In contrast, smart home systems continuously monitor individuals in their natural environment and provide ecologically valid feedback on their everyday functioning. Clinicians and caregivers can use this information to make informed decisions about patient care.
There are additional issues to consider when implementing assessment systems in homes and comparing activity performance between individuals. Clustering algorithms can group individuals together who have similar lifestyles and ways of performing activities and we can perform comparative assessment for these subgroups. Alternatively, we can use an individual as their own baseline to look for changes in activity performance over time that might indicate changes in cognitive health. We need to carefully consider which activities to recognize, track, and use for assessment in everyday home environments. While sleep, exercise, and social interactions are common activities to monitor, other complex activity groups that involve multi-tasking are useful for performing automated assessment.
The cognitive assessment activity data used for this study is available for download at http://ailab.wsu.edu/casas/datasets/assessmentdata.zip.
VIII. Conclusions and future work
In this work, we showed that machine-learning algorithms can be designed to perform automated assessment of task quality based on smart home sensor data that is collected during task performance. Our preliminary results indicate that smart homes and ubiquitous computing technologies can be useful for monitoring complex everyday functions and to automate assessment of daily activities. This capability is valuable for monitoring the well-being of individuals in their own environments.
In our current work, we have focused on one complex activity, the DOT. We believe that the general approach is extensible to monitor a variety of activities, particularly for analysis across a population of individuals. In future work, we want to automate assessment and detect changes in functional independence using a person’s own performance baseline by analyzing longitudinal sensor data.
Acknowledgments
The authors thank Selina Akhter, Thomas Cowger, Matt Kovacs, and Sue Nelson for annotating the sensor data and Alyssa Hulbert, Carolyn Parsey, Chad Sanders, Courtney McAllister, Joyce Tam, Adri Seelye and Jennifer Walker for collecting the data.
This material is supported by the Life Sciences Discovery Fund, by National Science Foundation grants 1064628 and 0852172, and by the National Institutes of Health grant R01EB009675.
Biographies

Prafulla N. Dawadi is currently a PhD student in the School of Electrical Engineering and Computer Science at Washington State University. His research interests include machine learning, data mining and smart environments.

Diane J. Cook is a Huie-Rogers Chair Professor in the School of Electrical Engineering and Computer Science at Washington State University. Her research interests include artificial intelligence, machine learning, and smart environments.

Maureen Schmitter-Edgecombe is a Professor in the Department of Psychology at Washington State University. Dr. Schmitter-Edgecombe received a B.S. from Bucknell University in 1988 and a M.S. and Ph.D. from the University of Memphis in 1991 and 1994, respectively. Dr. Schmitter-Edgecombe’s research focuses on evaluating attention, memory, and executive functioning issues in neurological normal and clinical populations with the goal of designing and assessing rehabilitation techniques.
Contributor Information
Prafulla N. Dawadi, Email: prafulla.dawadi@wsu.edu, School of Electrical Engineering and Computer Science, Washington State University, Pullman, WA.
Diane J. Cook, Email: djcook@wsu.edu, School of Electrical Engineering and Computer Science, Washington State University, Pullman, WA.
Maureen Schmitter-Edgecombe, Email: schmitter-e@wsu.edu, Department of Psychology, Washington State University, Pullman, WA.
References
- 1.Albert MS, DeKosky ST, Dickson D, Dubois B, Feldman HH, Fox NC, Phelps CH. The diagnosis of mild cognitive impairment due to Alzheimer’s disease: Recommendations from the National Institute on Aging Alzheimer’s Association workshops on diagnostic guidelines for Alzheimer’s disease. Alzheimer’s and Dementia: The Journal of the Alzheimer’s Association. 2011;7:270–279. doi: 10.1016/j.jalz.2011.03.008. [DOI] [PMC free article] [PubMed] [Google Scholar]
- 2.Allin S, Eckel E. Machine Perception for Occupational Therapy: Toward Prediction of Post-Stroke Functional Scores in the Home. Proc Rehabilitation Engineering & Assistive Technology Society of North America (RESNA) 2006 [Google Scholar]
- 3.Alzheimer’s disease International. World Alzheimer Report. 2009 www.alz.co.uk/research/worldreport.
- 4.American Psychiatric Association. Diagnostic and Statistical Manual of Mental Disorders. Psychiatric Press; 2000. [Google Scholar]
- 5.Burgess PW. Strategy application disorder: The role of the frontal lobes in multitasking. Psychological Research. 2000;63:279–288. doi: 10.1007/s004269900006. [DOI] [PubMed] [Google Scholar]
- 6.Chaytor N, Schmitter-Edgecombe M, Burr R. Improving the ecological validity of executive functioning assessment. Archives of Clinical Neuropsychology. 2006;21(3):217–227. doi: 10.1016/j.acn.2005.12.002. [DOI] [PubMed] [Google Scholar]
- 7.Cook DJ. Learning setting-generalized activity models for smart spaces. IEEE Intelligent Systems. 2012;27(1):32–38. doi: 10.1109/MIS.2010.112. [DOI] [PMC free article] [PubMed] [Google Scholar]
- 8.Cook DJ, Das SK. Smart Environments: Technologies, Protocols, and Applications. Wiley; 2004. [Google Scholar]
- 9.Cook DJ, Schmitter-Edgecombe M. Assessing the quality of activities in a smart environments. Methods of Information in Medicine. 2009;48(5):480–485. doi: 10.3414/ME0592. [DOI] [PMC free article] [PubMed] [Google Scholar]
- 10.Department of Health. Speech by the Rt Hon Patricia Hewitt MP, Secretary of State for Health. Proc Long-term Conditions Alliance Annual Conference. 2007 [Google Scholar]
- 11.Dong-Hui X, Kurani AS, Furst JD, Raicu DS. Run-length encoding for volumetric texture. Proc International Conference on Visualization Imaging and Image Processing. 2004:68–73. [Google Scholar]
- 12.Farias ST, Mungas D, Reed BR, Harvey D, Cahn-Weiner D, DeCarli C. MCI is associated with deficits in everyday functioning. Alzheimer Disease and Associated Disorders. 2006;20(4):217–223. doi: 10.1097/01.wad.0000213849.51495.d9. [DOI] [PMC free article] [PubMed] [Google Scholar]
- 13.Giovannetti T, Bettcher BM, Brennan L, Libon DJ, Burke M, Duey K, Wambach D. Characterization of everyday functioning in mild cognitive impairment: A direct assessment approach. Dementia and Geriatric Cognitive Disorders. 2008;25:359–365. doi: 10.1159/000121005. [DOI] [PubMed] [Google Scholar]
- 14.Hodges M, Kirsch N, Newman M, Pollack M. Automatic assessment of cognitive impairment through electronic observation of object usage. Proc International Conference on Pervasive Computing. 2010:192–209. [Google Scholar]
- 15.Lee ML, Dey AK. Embedded assessment of aging adults: A concept validation with stake holders. Proc International Conference on Pervasive Computing Technologies for Healthcare. 2010:22–25. [Google Scholar]
- 16.Maaten L, Postma E, Herik H. Dimensionality reduction: A comparative review. Tilburg University Technical Report, TiCC-TR 2009-005. 2009;10:1–35. [Google Scholar]
- 17.Pavel M, Adami A, Morris M, Lundell J, Hayes TL, Jimison H, Kaye JA. Mobility assessment using event-related responses. Proc Transdisciplinary Conference on Distributed Diagnosis and Home Healthcare. 2006:71–74. [Google Scholar]
- 18.Petersen RC, Doody R, Kurz A, Mohs RC, Morris JC, Rabins PV, Winblad B. Current concepts in mild cognitive impairment. Archives of Neurology. 2001;58:1985–2992. doi: 10.1001/archneur.58.12.1985. [DOI] [PubMed] [Google Scholar]
- 19.Petersen RC, Morris JC. Mild cognitive impairment as a clinical entity and treatment target. Archives of Neurology. 2005;62:1160–1163. doi: 10.1001/archneur.62.7.1160. [DOI] [PubMed] [Google Scholar]
- 20.Philipose M, Fishkin KP, Perkowitz M, Patterson DJ, Fox D, Kautz H, Hahnel D. Inferring activities from interactions with objects. IEEE Pervasive Computing. 2004;3:50–57. [Google Scholar]
- 21.Phua C, Sim K, Biswa J. Multiple people activity recognition using simple sensors. Proc International Conference on Pervasive and Embedded Computing and Communication Systems. 2011:313–318. [Google Scholar]
- 22.Rabbi M, Ali S, Choudhury T, Berke E. Passive and in-situ assessment of mental and physical well-being using mobile sensors. Proc International Conference on Ubiquitous Computing. 2011:385–394. doi: 10.1145/2030112.2030164. [DOI] [PMC free article] [PubMed] [Google Scholar]
- 23.Ravi N, Mysore P, Littman M. Activity recognition from accelerometer data. Proc Conference on Innovative Applications of Artificial Intelligence. 2005:1541–1546. [Google Scholar]
- 24.Schmitter-Edgecombe M, McAlister C, Weakley A. Naturalistic assessment of everyday functioning in individuals with mild cognitive impairment: The Day Out Task. Neuropsychology. 2012;26(5):631–641. doi: 10.1037/a0029352. [DOI] [PMC free article] [PubMed] [Google Scholar]
- 25.Sherod MG, Griffith HR, Copeland J, et al. Neurocognitive predictors of financial capacity across the dementia spectrum: Normal aging, mild cognitive impairment, and alzheimer’s disease. Journal of the International Neuropsychological Society. 2009;15(2):258–267. doi: 10.1017/S1355617709090365. [DOI] [PMC free article] [PubMed] [Google Scholar]
- 26.Singla G, Cook DJ, Schmitter-Edgecombe M. Recognizing independent and joint activities among multiple residents in smart environments. Ambient Intelligence and Humanized Computing Journal. 2010;1(1):57–63. doi: 10.1007/s12652-009-0007-1. [DOI] [PMC free article] [PubMed] [Google Scholar]
- 27.Sun Y, Kamel MS, Wong AKC, Wang Y. Cost-sensitive boosting for classification of imbalanced data. Pattern Recognition. 2007;40:3358–3378. [Google Scholar]
- 28.Vincent G, Velkoff V. The next four decades – the older population in the United States: 2010 to 2050. US Census Bureau; 2010. [Google Scholar]
- 29.Wadley V, Okonkwo O, Crowe M, Vance D, Elgin J, Ball K, Owsley C. Mild cognitive impairment and everyday function: An investigation of driving performance. Journal of Geriatric Psychiatry and Neurology. 2009;22(2):87–94. doi: 10.1177/0891988708328215. [DOI] [PMC free article] [PubMed] [Google Scholar]
- 30.Witten Ian H, Frank Eibe. Data Mining: Practical Machine Learning Tools and Techniques. San Francisco, CA: Morgan Kaufmann Publishers Inc; 2005. [Google Scholar]