

Abstract
♦ Background: The economic burden of treating end-stage renal disease (ESRD) continues to grow. As one response, effective January 1, 2011, Medicare implemented a bundled prospective payment system (PPS, including injectable drugs) for dialysis patients. This study investigated the 5-year budget impact on Medicare under the new PPS of changes in the distribution of patients undergoing peritoneal dialysis (PD), in-center hemodialysis (ICHD), and home hemodialysis (HHD).
♦ Methods: An Excel-based budget impact model was created to assess dialysis-associated Medicare costs. The model accounted for dialysis access establishment, the current monthly capitation physician payment for ESRD, Medicare dialysis payments (including start-up costs), training, oral drug costs, and the costs and probabilities of adverse events including access failure, hospitalization for access infection, pneumonia, septicemia, and cardiovascular events. United States Renal Data System (USRDS) data were used to project the US Medicare dialysis patient population across time. The baseline scenario assumed a stable distribution of PD (7.7%), HHD (1.3%) and ICHD (91.0%) over 5 years. Three comparison scenarios raised the proportions of PD and HHD by (1) 1% and 0.5%, (2) 2% and 0.75%, and (3) 3% and 1% each year; a fourth scenario held HHD constant and lowered PD by 1% per year.
♦ Results: Under the bundled PPS, scenarios that increased PD and HHD from 7.7% and 1.3% over 5 years resulted in cumulative savings to Medicare of $114.8M (Scenario 1, 11.7% PD and 3.3% HHD at year 5), $232.9M (Scenario 2, 15.7% PD and 4.3% HHD at year 5), and $350.9M (Scenario 3, 19.7% PD and 5.3% HHD at year 5). When the PD population was decreased from 7.7% in 2013 to 3.7% by 2017 with a constant HHD population, the total Medicare payment for dialysis patients increased by over $121.2M.
♦ Conclusions: Under Medicare bundled PPS, increasing the proportion of patients on PD and HHD vs ICHD could generate substantial savings in dialysis-associated costs to Medicare.
Keywords: End-stage renal disease, dialysis, Medicare, bundled payment, prospective payment system, financial impact analysis, economics
End-stage renal disease (ESRD) refers to the irreversible loss of kidney function, which often leads to the need for renal replacement therapy (RRT)—renal transplantation or dialysis. The number of patients with ESRD is rising rapidly across the world due to the aging population, extended life expectancy, and the global epidemic of diabetes mellitus (1,2). As of 2011, ESRD afflicted more than 2.8 million people worldwide (3). That population included more than 600,000 individuals in the United States (US), with the number of patients in the US growing at a rate of 4% annually (4).
In managing ESRD, many patients require lifelong dialysis due to inadequate kidney donation and failure to optimize transplantation. Two principal types of dialysis are peritoneal dialysis (PD) and hemodialysis (HD) (5). Peritoneal dialysis is almost exclusively done at home and HD can be performed in a dialysis center, at the hospital, or at home. Despite the convenience and economic and quality of life advantages associated with home-based dialyses, many systematic barriers, including educational, governmental, and provider, exist to the successful and effective delivery of home dialysis in the US (6). As a result, only 9.0% of US dialysis patients are currently using home and self-care therapies in 2011 with 1.3% of ESRD patients in the US receiving home HD (HHD) and 7.7% receiving PD, even though US nephrologists surveyed in 2001 felt on average that from a wellness perspective, PD and HHD should be given to almost half of patients with ESRD (7). The Chronic Kidney Disease RenalSoft Informatics Observational Study (CRIOS) study, a large prospective observational study, evaluated the medical and psychosocial eligibilities of a cohort of 1,303 chronic kidney disease (CKD) patients in stages III - V for PD, HD, and transplants and found that 78% of the CKD patients had neither medical nor psychosocial contraindications for PD (8). To increase the use of home-based dialysis services, a systematic literature review found that planned and timely discussion with CKD patients on their dialysis modality choices is critical (9).
The provision of dialysis to ESRD patients is very costly. Per-person per-year dialysis-related care costs in the US were on average $87,272 in 2011 (4). Overall, the 1.4% of Medicare patients with ESRD accounted for 7.2% of Medicare spending in 2011, with Medicare-related total ESRD expenditures (including Part D) of $34.4 billion (4). Further, with the aging population and growing prevalence of diabetes, obesity, and hypertension, the ESRD patient population treated in the US increased from just over 113,000 in 1985 to 601,801 in 2011 (4). In 2011, there were 112,812 incident dialysis patients (4). Currently, the US faces substantial budget constraints and strong pressure to reduce the cost to Medicare and other forms of health care coverage.
To help control costs, effective January 1, 2011, Medicare implemented a bundled prospective payment system (PPS) for dialysis patients under the Medicare Improvements for Patients and Providers Act (MIPPA). The bundle provides a risk-adjusted payment per dialysis patient to cover expanded services provided by dialysis providers as well as the use of drugs such as erythropoiesis-stimulating agents (ESAs) and intravenous vitamin D analogues where there had been concern of overuse (10-12). Evidence suggests that the bundled payment provides cost incentives for dialysis providers to increase the use of PD and decrease the use of relatively expensive drugs, including ESAs, and may also promote the use of HHD (13,14). Language in the implementation of the policy suggests that a goal for Center for Medicare and Medicaid Services (CMS) was to create a financial incentive to encourage home dialysis where feasible (15). There have been a few published studies regarding the budget impact of increasing the use of PD relative to in-center hemodialysis in Australia and other countries (16-18). In addition, Neil et al. estimated the dialysis-related cost savings to Medicare from an increase in the use of PD under the previous Medicare pay structure (19). This literature has consistently concluded that an increase in the use of PD would result in substantial savings. However, there are currently no estimates of the potential impact on Medicare under the new payment system of changes in dialysis modality mix. Further, the past estimate of cost savings in the US was based on a single year of data (2005) and did not consider changes in HHD or changes in the overall prevalence of ESRD.
In this context, the objective of this study was to estimate the 5-year financial impact on Medicare related to changes in the distribution of patients undergoing PD, in-center hemodialysis (ICHD), and HHD under the new PPS payment policy.
Methods
An Excel-based (Excel version 2007) budget impact model was developed to estimate the dialysis-associated Medicare costs assuming various dialysis modality distributions among PD, ICHD, and HHD over 5 years. The size of the population considered in the model came from projected counts of prevalent patients with ESRD covered by Medicare, combined with projections of future incidence rates, as well as rates of transplants and death among dialysis patients (4,20). Specifically, dialysis prevalence (per million population), as well as the dialysis mortality rate (per 1,000 patient years) and the transplant rate (per 100 patient years), were projected forwards using a simple linear trend (using the “Trend” function in Excel) based on reported estimates by the United States Renal Data System (USRDS) of these numbers from 2002 to 2011 (4). Very recent data suggested the incidence rate has been declining slightly. Considering that it is too early to predict whether the decline represents a long-term trend, we elected to use the most recent (2011) incidence rate held constant over the time horizon of the model. Partial-year patients, who include incident dialysis patients and those who depart from the dialysis population via transplant or mortality, were assumed to enter and leave the dialysis population uniformly through the year. Hence, the costs and events of partial-year patients were counted as half of those of full-year patients. Functionally, the model was constructed like a Markov model with annual cycles, but where the transition rates into and out of the dialysis population were allowed to vary year to year based on the projections. Costs are then estimated in the model each year based on population size times rate of event times cost.
Treatment costs are based on the 2013 CMS rates for the bundle ($240.36/treatment) plus the monthly capitation payment (MCP) for nephrologists, adjusted to reflect that Medicare pays training services and 80% of the costs of dialysis and that payments of the bundle are 1.51 times higher in the first 4 months for incident patients to account for the additional costs of starting dialysis (21,22). Since PD is typically 7 days a week, while HD typically has 3 sessions per week, the per-day costs of PD are equal to 3/7 of a session for HD. The perpatient training frequencies for PD and HHD patients were obtained from a previous study conducted by Avalere Health for Baxter, who analyzed data from the calendar year of 2011 from the Medicare 100% outpatient limited data set and was able to estimate the frequency of training services billed by dialysis facilities (23). The home dialysis training add-on payment by CMS was $33.44 per training session in 2013 and is $50.16 per training session starting in 2014 (24). The MCP to nephrologists for ESRD services was $237.48 for 2 to 3 face-to-face visits a month and $287.71 for 4 face-to-face visits a month for in-center dialysis patients. To estimate the total MCP for dialysis, we assumed 50% of each type of visit and calculated a MCP of $259.6 a month. The MCP for home dialysis was $237.14 in 2013 (25).
The model accounted for costs of adverse events including PD and HD access failure, the latter defined as catheter, graft, or device replacement, and hospitalization for HD- or PD-related access infection, septicemia, pneumonia, and cardiovascular (CV) events based on the latest available national cost estimates at the time the model was developed (26,27). In addition, as there was no information to suggest otherwise, the model assumed an equivalent use of oral medications across the modalities and projected costs based on oral drug payments that will not be included in the bundled PPS until at least January 2016 (28).
Adverse events are of particular importance in ESRD populations as illustrated by the attention they receive from the USRDS. The specific rates in the model were based upon the most recent data reported by the USRDS at the time of the model development, including access failure rates from 2007 (USRDS 2011, Volume 2, Table 2.c), hospitalization rates for pneumonia from 2008 (USRDS 2010, Volume 2, Figure 6.4), and rates of hospitalization for access infection, septicemia, and CV events from 2010 data (USRDS 2012, Volume 2, Figure 3.3) (29-31). Different USRDS Annual Data Reports were used to populate the model because data for certain events were available in some years, but not in other years. When rates of events were reported per 1,000 patient-years, we transformed these rates into annual probabilities using the following formula: prob = (1-exp[-count/1,000]) (32). In addition, we assume the same rates of events for HHD and ICHD because there were no reported results for a US population to suggest otherwise. For HD, the access failure numbers reflect a weighted average of replacement rates for regular catheters, arteriovenous (AV) fistula, and AV graft—based on counts of each modality reported by the USRDS (29,31).
Incident-year transplant costs were based on reported charges in a 2011 Milliman report, adjusted for inflation and average cost-to-charge ratios for the US (33-35). Costs to Medicare for transplant-related care for later years (up to 36 months after the month of transplantation for Medicare participant population) were based on Medicare per-patient inpatient/outpatient costs and physician supplier costs for functioning transplants reported by the USRDS in 2011, adjusted to 2013 using the US Medical Care Consumer Price Index (29,35).
The model used the same level of overall reimbursement from Medicare for HHD as it does for ICHD, although some Medicare administrative contractors may provide more than 3 treatments a week. The reason for using the same costs is that there is no official national Medicare policy regarding different rates of reimbursement for HHD. Further, there is no available information regarding actual cost differences for HHD in the US, and the prevalence of HHD patients is relatively small. All the costs in the model were adjusted to 2013 dollars and costs were not discounted across time.
In the baseline model, or reference case, the following distribution of dialysis modalities was used based on the most recent USRDS data at the time the model was developed: 7.7% PD, 1.3% HHD, and 91.0% ICHD (4). Three hypothetical scenarios were run. The first scenario was an increase in the use of PD of 1% per year combined with an increase in HHD of 0.5% per year. The second was an increase in PD of 2% per year combined with an increase in HHD of 0.75% per year, and the third was an increase of 3% per year for PD and an increase of 1% per year for HHD. For comparison, we also included a scenario that decreased PD by 1% each year combined with a constant rate of HHD. In each of the 4 hypothetical scenarios, ICHD percentages were adjusted so that the sum of the percentages of patients using the three modalities was 100%. More details on the model are provided in the Appendix.
Results
Table 1 below shows the sizes of the Medicare-covered dialysis population projected using the epidemiological parameters reported in USRDS Annual Reports with methods previously discussed. The resulting projections were around 356,000 dialysis patients covered by Medicare at the start of 2013 and the number was projected to increase to about 400,000 by the end of 2017.
TABLE 1.
Projected Dialysis Population Covered by Medicarea
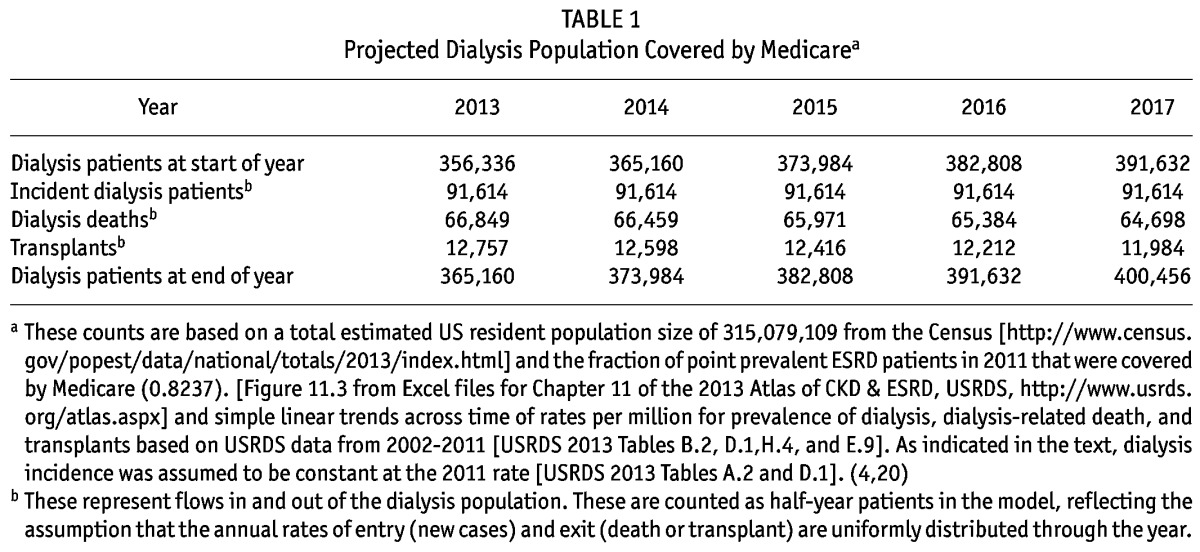
Table 2 displays the average annual probabilities of adverse events that were extracted from USRDS Annual Reports. For example, patients treated with PD had lower probability of hospitalization than patients treated with ICHD due to septicemia (0.075 vs 0.110), pneumonia (0.043 vs 0.080), and CV events (0.335 vs 0.405), but had higher probability of hospitalization due to access infections (0.211 vs 0.098). Table 2 also lists the average number of training sessions that PD and HHD patients received in 2011, based on results from the Avalere study (5.6 and 14.7 sessions/per patient respectively) (23).
TABLE 2.
Model Inputs
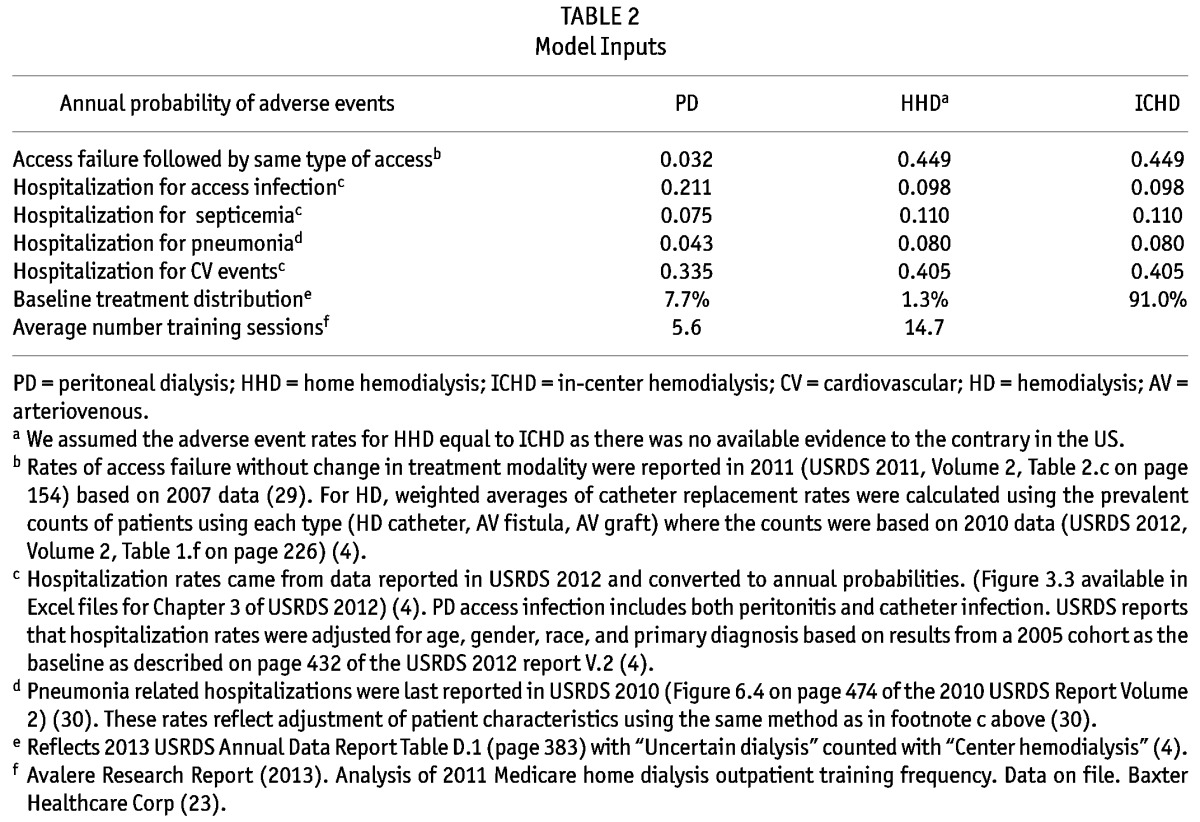
Table 3 shows the cost inputs used in the model. For example, the cost to Medicare is $82.41 per patient per day for patients treated with PD (7 days/week), and $192.29 per session (80% of the $240.36 mentioned earlier) for patients treated with HD (3 sessions/week). The training add-on was $33.44/session in 2013 and is $50.16 starting in 2014 for both PD and HHD. The average cost per hospitalization due to septicemia is estimated at $10,305. Note that new cases, dialysis deaths, and transplants are counted as partial-year dialysis patients and they also account for the changes in the start-of-year patients across time. Partial-year patients have half of the probabilities of experiencing an adverse event and half of all related costs.
TABLE 3.
Cost Inputs
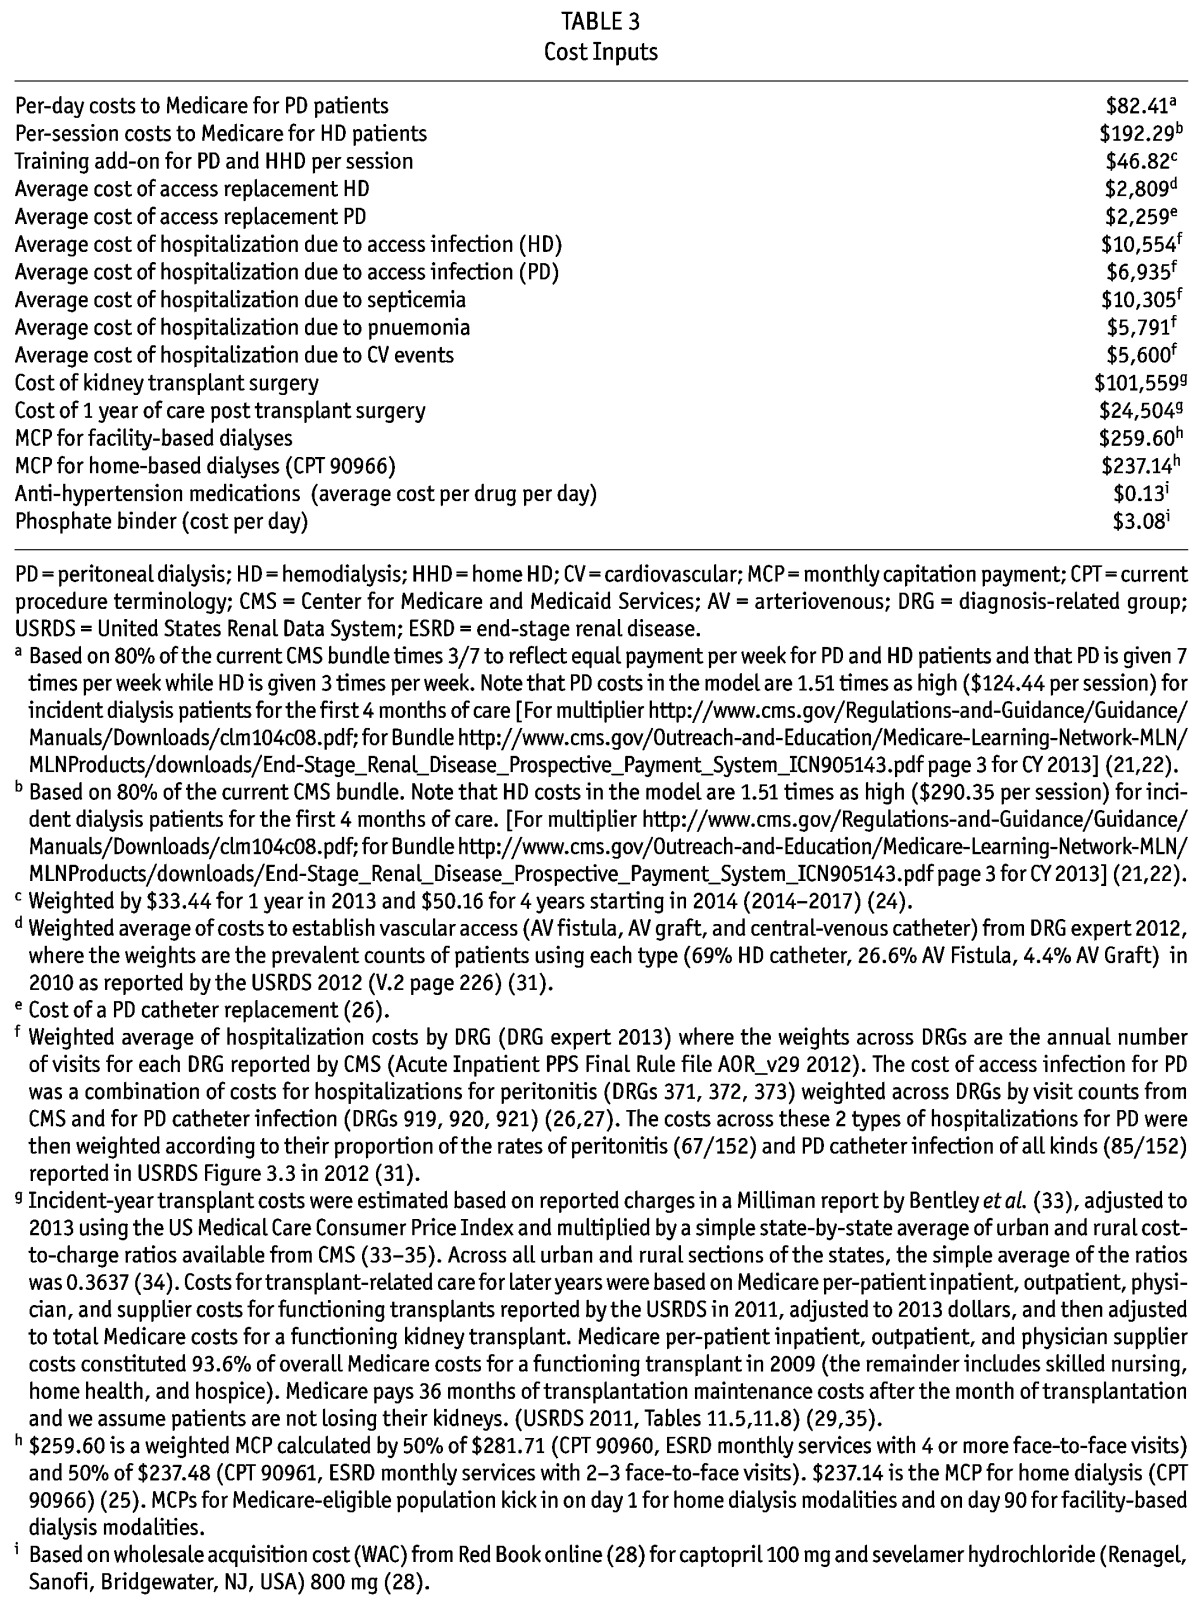
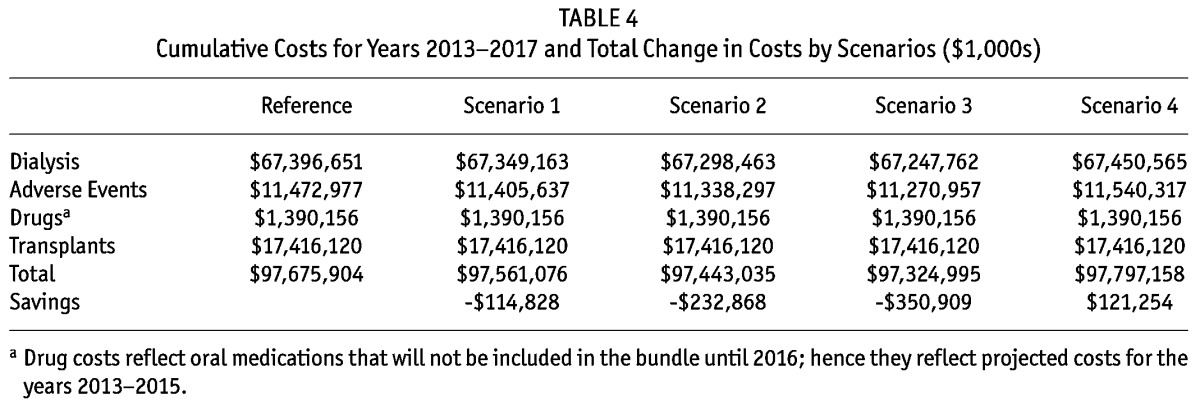
Table 4 below displays the cost results by category for the reference case and the 4 hypothetical scenarios. For the reference scenario, the estimated 5-year Medicare dialysis-associated spending for patients with ESRD was about $98 billion, including dialysis access establishment, the monthly capitation payment (MCP) for nephrologists, the training add-on, dialysis services, and hospitalization costs due to major adverse events associated with dialysis. With the different scenarios of low, medium, and high increases in the use of PD and HHD, the cumulative cost savings to Medicare varied from $114.8 to $350.9M over 5 years (2013 - 2017). In the scenario of lower PD and constant HHD, costs were projected to increase by over $121.2M. In each of the scenarios, adverse events make up a sizable portion of costs, and in our model reductions in adverse events make up a sizable portion of the savings from moving to PD from HD.
TABLE 4.
Cumulative Costs for Years 2013-2017 and Total Change in Costs by Scenarios ($1,000s)
Discussion
Our results suggest the potential for sizable reductions in Medicare costs under the Medicare bundled PPS if the use of PD continues to increase. Given consistent findings in the past of cost savings of PD in other settings, our results are not surprising, though they are smaller than savings projected by Neil et al. 2009 that were based on 2005 data under the old payment system (16-19). The primary reason for the smaller savings is that the new payment system bundled injectable drugs, including erythropoiesis-stimulating agents, which had been a significant source of cost differences between PD and HD. In addition, we used a conservative approach in constructing our model. We included all cost elements that have published differentiation information, including dialysis access establishment, training fees, dialysis services, MCP for nephrologists, part of oral drugs, and hospitalizations due to major adverse events. We did not include some cost elements such as nursing home, home services, hospice, inpatient dialysis, and hospitalization costs due to comorbidities, which may help minimize the selection bias of home- vs facility-based dialysis modalities.
The model was based on the most recently available information at the national level regarding costs and event rates following Medicare’s switch to the bundled payment. Functionally, the switch to the bundled payment served to equate the costs across modalities of providing dialysis care to patients with ESRD. We find substantial savings from the use of PD in a higher proportion of patients because patients on PD on average tend to have fewer and less-costly adverse events. This is consistent with CMS intentions to incentivize the use of home dialysis to help the Medicare program save money. Considering the mounting national debt, unfunded liabilities for Medicare, and the aging population, the savings could be particularly significant.
Currently the bundle does not include the cost of oral drugs except active vitamin D analogues, and the date for including those drugs in the bundle is January 2016. However, the savings to CMS expected from a shift to PD do not depend on how oral drugs are covered. This should not be taken to mean that drug costs are not important. In fact, a key feature of the bundle is that it includes injectable drugs. Following the switch to bundled payments, there have been reductions in the use of erythropoiesis-stimulating agents and more expensive vitamin D and iron, which has helped in terms of cost savings (14).
Further, in projecting savings from changes in the modality of dialysis, the model was conservative in its estimates of costs related to HHD because we assumed the same reimbursements and adverse events for HHD patients as those for ICHD. It is possible that HHD could result in further cost savings to Medicare if it leads to fewer adverse events. For example, a 2006 study in Canada found better catheter survival in HHD vs ICHD (36). However, our assumption of identical rates of adverse events between patients receiving HHD and ICHD may also underestimate the complications associated with HHD and lead to overestimate the savings if increases in the frequency of dialyses and the buttonhole technique resulted in higher vascular access complications that need intervention.
Limitations
This study has several limitations. First, it was constructed from Medicare’s perspective and included only Medicare base costs associated with dialysis. For example, we did not include patient out-of-pocket payments and case-mix adjustments. Second, for our purpose of estimating the financial impact of varying the dialysis modality mix, we included only dialysis-associated costs, such as dialysis services and MCP. Considering no published information exists to differentiate some other costs, such as inpatient dialysis and hospitalizations due to comorbidities, across the dialysis modalities, we did not include them in this analysis. As a result, our estimate of total annual spending by Medicare is less than that reported by USRDS (4). In addition, this model considered only major adverse events associated with dialysis modalities, not all possible adverse events, and only the hospitalization costs of those events were counted. Third, the different rates of adverse events across modalities were obtained from the USRDS annual data reports based on retrospective data analyses that may contain selection bias. It has been reported that patients starting with PD have (on average) fewer comorbidities and are generally younger and relatively healthy (37). Although USRDS reports controlled for age, gender, race, and primary diagnosis, other unobserved differences in severity and/or risk of events could imply less savings than we calculated. However, if patients who moved from ICHD to PD or HHD were similar to those already in PD, then our estimates would be more accurate, and this may be the case for the size of movements we project and if selection for those who move is based more on factors unrelated to adverse events such as knowledge regarding available dialysis modalities as opposed to severity of illness. Fourth, our model is a prevalence-based model and did not track patients moving from one modality to another modality. As a result, we do not include costs of switching from one modality to another. Large changes towards PD or HHD from ICHD would certainly involve training and other costs beyond the scope of this model. Further, transferring from PD to ICHD could also lead to additional costs to CMS that would diminish the savings. However, data published by Chui and colleagues reported that patients with PD-only and HD-to-PD still had significantly lower total healthcare costs at 1 and 3 years than patients with HD-only. Overall, the cost of patients with PD technique failure was lower than or equal to that of HD-only patients (38). Fifth, we assumed identical use of oral medications and equivalent transplantation rates among patients receiving PD, HHD and ICHD. Again, with respect to oral medications and transplant rates, there was no information available to assess these assumptions, and they could impact the estimates in either direction if they are incorrect. Sixth, home modalities are substantially under-utilized in the US due to awareness and education (39). However, the advantageous outcomes for home modalities vs ICHD are likely to be center-specific and may not be generalizable to other centers, especially newer ones. In addition, center size matters for both quality of dialysis care and achieving the right economies of scale.
Conclusions
Under Medicare bundled PPS, increasing the proportion of patients on PD and HHD vs ICHD could generate substantial savings in dialysis-associated costs to Medicare. However, ESRD treatment will continue to represent a substantial portion of costs in the Medicare system, and much of those costs reflect the costs of adverse events related to available treatment. Finally, costs are only one factor in modality choice and there remain numerous areas for future research related to patient-reported outcomes, and key clinical outcomes across modalities to help inform treatment decisions and related policy in this area.
Disclosures
The study was supported by funding from Baxter Healthcare Corporation, Deerfield, IL 60015 USA.
A previous version of this paper was presented at the International Society of Pharmacoeconomics and Outcomes Research, 17th Annual International Meeting, Washington, DC, June 5, 2012.
References
- 1. Coresh J, Selvin E, Stevens LA, Manzi J, Kusek JW, Eggers P, et al. Prevalence of chronic kidney disease in the United States. JAMA 2007; 298(17):2038–47. [DOI] [PubMed] [Google Scholar]
- 2. Chan KE, Pflederer TA, Steele DJ, Lilly MP, Ikizler TA, Maddux FW, et al. Access survival amongst hemodialysis patients referred for preventive angiography and percutaneous transluminal angioplasty. Clin J Am Soc Nephrol 2011. November; 6(11):2669–80. [DOI] [PMC free article] [PubMed] [Google Scholar]
- 3. Fresenius Medical Care. ESRD Patients in 2011: A Global Perspective. 2012. [Google Scholar]
- 4. United States, Department of Health and Human Services, National Institutes of Health, National Institute of Diabetes and Digestive and Kidney Diseases, US Renal Data System (USRDS). USRDS 2013 Annual Data Report: Atlas of Chronic Kidney Disease and End-Stage Renal Disease in the United States. Bethesda, MD: USRDS; 2013. [Google Scholar]
- 5. National Institute for Clinical Excellence (NICE). Technology Appraisal Guidance-No 48: Guidance on Home Compared with Hospital Haemodialysis for Patients with End-Stage Renal Failure. London, UK: National Institute for Clinical Excellence; 2002. [Google Scholar]
- 6. Golper TA, Saxena AB, Piraino B, Teitelbaum I, Burkart J, Finkelstein FO, et al. Systematic barriers to the effective delivery of home dialysis in the United States: a report from the Public Policy/Advocacy Committee of the North American Chapter of the International Society for Peritoneal Dialysis. Am J Kidney Dis 2011; 58(6):879–85. [DOI] [PubMed] [Google Scholar]
- 7. Mendelssohn D, Mullaney S, Jung B, Blake P, Mehta R. What do American nephrologists think about dialysis modality selection? Am J Kidney Dis 2001; 37(1):22–9. [DOI] [PubMed] [Google Scholar]
- 8. Mendelssohn DC, Mujais SK, Soroka SD, Brouillette J, Takano T, Barre PE, et al. A prospective evaluation of renal replacement therapy modality eligibility. Nephrol Dial Transplant 2009; 24(2):555–61. [DOI] [PubMed] [Google Scholar]
- 9. Harwood L, Clark AM. Understanding pre-dialysis modal ity decision-making: A meta-synthesis of qualitative studies. Int J Nurs Stud 2013; 50(1):109–20. [DOI] [PubMed] [Google Scholar]
- 10. Iglehart JK. Bundled payment for ESRD—including ESAs in Medicare’s dialysis package. N Engl J Med 2011. February 17; 364(7):593–5. [DOI] [PubMed] [Google Scholar]
- 11. Maddux FW. Impact of the bundled end-stage renal disease payment system on patient care. Blood Purif 2012; 33(1-3):107–11. [DOI] [PubMed] [Google Scholar]
- 12. Golper TA, Guest S, Glickman JD, Turk J, Pulliam JP. Home dialysis in the new USA bundled payment plan: implications and impact. Perit Dial Int 2011. Jan-Feb; 31(1):12–6. [DOI] [PubMed] [Google Scholar]
- 13. Hornberger J, Hirth RA. Financial implications of choice of dialysis type of the revised Medicare payment system: an economic analysis. Am J Kidney Dis 2012. August; 60(2):280–7. [DOI] [PubMed] [Google Scholar]
- 14. Hirth RA, Turenne MN, Wheeler JR, Nahra TA, Sleeman KK, Zhang W, et al. The initial impact of Medicare’s new prospective payment system for kidney dialysis. Am J Kidney Dis 2013; 62(4):662–9. [DOI] [PubMed] [Google Scholar]
- 15. Federal Register Volume 75, Number 155 (Thursday, August 12, 2010), [Rules and Regulations]. [Online.] http://www.gpo.gov/fdsys/pkg/FR-2010-08-12/pdf/2010-18466.pdf Accessed June 2, 2013.
- 16. Haller M, Gutjahr G, Kramar R, Harnoncourt F, Oberbauer R. Cost-effectiveness analysis of renal replacement therapy in Austria. Nephrol Dial Transplant 2011; 26(9):2988–95. [DOI] [PubMed] [Google Scholar]
- 17. Howard K, Salkeld G, White S, McDonald S, Chadban S, Craig JC, et al. The cost-effectiveness of increasing kidney transplantation and home-based dialysis. Nephrology 2009;14(1):123–32. [DOI] [PubMed] [Google Scholar]
- 18. Neil N, Walker DR, Sesso R, Blackburn JC, Tschosik EA, Sciaraffia V, et al. Gaining efficiencies: resources and demand for dialysis around the globe. Value Health 2009; 12(1):73–9. [DOI] [PubMed] [Google Scholar]
- 19. Neil N, Guest S, Wong L, Inglese G, Bhattacharyya SK, Gehr T, et al. The financial implications for Medicare of greater use of peritoneal dialysis. Clin Ther 2009; 31(4):880–8. [DOI] [PubMed] [Google Scholar]
- 20. US Census. Population Estimates. US Department of Commerce. 2014. [Online.] http://www.census.gov/popest/data/national/totals/2013/index.html Accessed February 6, 2014.
- 21. Centers For Medicare & Medicaid Services. Medicare Claims Processing Manual 2012. [Online.] http://www.cms.gov/Regulations-and-Guidance/Guidance/Manuals/Downloads/clm104c08.pdf Accessed May 31, 2013.
- 22. Centers For Medicare & Medicaid Services. End-Stage Renal Disease Prospective Payment System: Payment System Fact Sheet Series. 2012. [Online.] http://www.cms.gov/Outreach-and-Education/Medicare-Learning-Network-MLN/MLNProducts/downloads/End-Stage_Renal_Disease_Prospective_Payment_System_ICN905143.pdf Accessed April 18, 2013.
- 23. Avalere Health Study Reports. Analysis of 2011 Peritoneal Dialysis Training costs and frequency. Baxter data available on file. 2013. [Google Scholar]
- 24. Centers for Medicare & Medicaid Services. CMS Finalizes Policies and Payment Rates for End-Stage Renal Disease Prospective Payment System for CY 2014. [Online.] https://www.cms.gov/Newsroom/MediaReleaseDatabase/Fact-Sheets/2013-Fact-Sheets-Items/2013-11-22-2.html Accessed February 12, 2014.
- 25. Centers for Medicare & Medicaid Services. Physician Fee Schedule Search. [Online.] http://www.cms.gov/apps/physician-fee-schedule/search/search-criteria.aspx Accessed February 8, 2014.
- 26. Centers For Medicare & Medicaid Services. Addendum B Final OPPS Payment by HCPCS Code January 2013. [Online.] http://www.cms.gov/Medicare/Medicare-Fee-for-Service-Payment/HospitalOutpatientPPS/Addendum-A-and-Addendum-B-Updates.html Accessed May 31, 2013.
- 27. Canter KV, Caffrey BT. DRG Expert: A comprehensive guide-book to the MS-DRG classification system. OptumInsight, Inc. 2013. [Google Scholar]
- 28. RedBook Online. Thompson Reuters (Healthcare) Inc. 2013. [Google Scholar]
- 29. United States, Department of Health and Human Services, National Institutes of Health, National Institute of Diabetes and Digestive and Kidney Diseases, US Renal Data System (USRDS). USRDS 2011 Annual Data Report: Atlas of Chronic Kidney Disease and End-Stage Renal Disease in the United States. Bethesda, MD: USRDS; 2011. (Table 2.c) [Google Scholar]
- 30. United States, Department of Health and Human Services, National Institutes of Health, National Institute of Diabetes and Digestive and Kidney Diseases, US Renal Data System (USRDS). USRDS 2010 Annual Data Report: Atlas of Chronic Kidney Disease and End-Stage Renal Disease in the United States. Bethesda, MD: USRDS; 2010. (Figure 6.4) [Google Scholar]
- 31. United States, Department of Health and Human Services, National Institutes of Health, National Institute of Diabetes and Digestive and Kidney Diseases, US Renal Data System (USRDS). USRDS 2012 Annual Data Report: Atlas of Chronic Kidney Disease and End-Stage Renal Disease in the United States. Bethesda, MD: USRDS; 2012. [Google Scholar]
- 32. Fleurence RL, Hollenbeak CS. Rates and probabilities in economic modelling: transformation, translation, and appropriate application. Pharmacoeconomics 2007; 25(1):3–6. [DOI] [PubMed] [Google Scholar]
- 33. Bentley TS, Hanson S. 2011 US organ and tissue transplant cost estimates and discussion. [Online.] http://insight.milliman.com/article.php?cntid=7625 Accessed May 31, 2013.
- 34. Centers For Medicare & Medicaid Services. Table 8 of FY 2013 IPPS Final Rule home Page Items. [Online.] http://www.cms.gov/Medicare/Medicare-Fee-for-Service-Payment/AcuteInpatientPPS/FY-2013-IPPS-Final-Rule-Home-Page-Items/FY2013-Final-Rule-Tables.html Accessed April 18, 2013.
- 35. US Medical Care Cost Inflation. [Online.] http://www.forecast-chart.com/inflation-medical-care-cost.html Accessed May 1, 2013.
- 36. Perl J, Lok CE, Chan CT. Central venous catheter outcomes in nocturnal hemodialysis. Kidney Int 2006; 70(7):1348–54. [DOI] [PubMed] [Google Scholar]
- 37. Shih YCT, Guo A, Just PM, Mujais S. Impact of initial dialysis modality and modality switches on Medicare expenditures of end-stage renal disease patients. Kidney Int 2005; 68(1):319–29. [DOI] [PubMed] [Google Scholar]
- 38. Chui BK, Manns B, Pannu N, Dong J, Wiebe N, Jindal K, et al. Health care costs of peritoneal dialysis technique failure and dialysis modality switching. Am J Kidney Dis 2013; 61(1):104–11. [DOI] [PubMed] [Google Scholar]
- 39. Mehrotra R, Marsh D, Vonesh E, Peters V, Nissenson A. Patient education and access of ESRD patients to renal replacement therapies beyond in-center hemodialysis. Kidney Int 2005; 68(1):378–90. [DOI] [PubMed] [Google Scholar]