

Abstract
Early-goal-directed therapy (EGDT) consists of early, aggressive fluid resuscitation and is known to improve survival in sepsis. It is unknown how often EGDT leads to subsequent fluid overload and whether post-EGDT fluid overload affects patients’ outcomes. Our hypothesis was that septic patients treated with EGDT were at risk for fluid overload and that fluid overload would be associated with adverse outcomes. We conducted a retrospective cohort of 405 consecutive patients admitted with severe sepsis and septic shock to the medical intensive care unit of a tertiary care academic hospital from January 2008 to December 2009. Baseline demographics, daily weights, fluid status, clinical or radiographic evidence of fluid overload, and medical interventions (thoracentesis, paracentesis, diuretic use, and ultrafiltration) were abstracted and associations explored using univariate and multivariate logistic and linear regression analyses. At day 1, 67% of patients developed evidence of fluid overload and in 48% fluid overload persisted to day three. Inter-rater agreement for presence of fluid overload was substantial (kappa=0.7). An increased trend in weight was noted in those with persistent clinical and radiologic evidence of fluid overload, but not with recorded positive fluid balance. When adjusted for baseline severity of illness, fluid overload was associated with increased use of fluid-related medical interventions (thoracentesis and diuretics) and hospital mortality (OR 1.92 [1.16-3.22]). In patients with severe sepsis and septic shock treated with EGDT, clinical evidence of persistent fluid overload is common and is associated with increased use of medical interventions and hospital mortality.
Keywords: fluid overload, sepsis, protocol-based resuscitation, morbidity, mortality
Introduction
Septic shock, a condition of hypoperfusion in the setting of infection, is a common cause of intensive care admissions and is associated with a high mortality and morbidity, including end-organ dysfunction and failures (1, 2). Fortunately, early-goal-directed therapy (EGDT) has been shown to decrease in-hospital mortality and improve morbidity by decreasing occurrence of severe organ dysfunction (3). The implementation of EGDT with the use of Surviving Sepsis Campaign bundles has been shown to reduce mortality, and both hospital and intensive care unit (ICU) length of stay (LOS) (4). EGDT requires aggressive fluid resuscitation in the first six hours of diagnosis based on specific hemodynamic parameters such as mean arterial pressure (MAP), central venous pressure (CVP), and central venous oxygen saturation (SCVO2) (3). These patients are at risk for fluid imbalance due to widespread systemic inflammation and increased tendency for capillary leak (5). The goal in septic shock management is to avoid hypovolemia and its associated complications, such as hypotension, renal injury, and multi-organ failure.
While this is important, especially in the early stages of septic shock, there are potential consequences of too much fluid accumulation, such as hypertension, peripheral edema, pulmonary edema, respiratory failure, and increased cardiac demand (6). Prior to EGDT, a small, retrospective study demonstrated that a net negative fluid balance was associated with reduced mortality in septic shock (7). In addition, septic patients with a higher cumulative fluid balance have more associated acute lung injury (ALI) and/or acute respiratory distress syndrome (ARDS) and worse ICU outcomes (8). Another study demonstrated those on norepinephrine with a positive fluid balance at 12 hours and at 4 days had an associated increased mortality (9). Finally the recent release of the ProCESS study demonstrated no improvement in 60-day mortality with protocol-based resuscitation (10). This suggests that further study is needed to understand why short-term gains in survival are not translating in to long-term gains. Given the above data on the harmful effects of fluid overload we hypothesized that patients receiving EGDT are at risk for fluid overload and that fluid overload may be associated with adverse outcomes. Our aim was to determine the potential morbidity and mortality associated with fluid overload in those receiving adequate EGDT for both sepsis and septic shock on days 1 and 3 regardless of vasopressor use.
Materials and Methods
We conducted a retrospective cohort study of 405 consecutive adults (≥ 18 years) admitted with severe sepsis and septic shock to the medical ICU of a tertiary care academic hospital from January 2008 to December 2009. This project was approved by the IRB (11-002605-02) without requirement for participant consent; however, patients who specifically opted out of clinical research (as allowed by Minnesota law) via signed document in the medical record were excluded. The study has therefore been performed in accordance with the ethical standards laid down in the 1964 Declaration of Helsinki and its later amendments. The diagnosis of severe sepsis and septic shock was based on the International Guidelines from the Surviving Sepsis Campaign (11). None of the authors have a conflict of interest with this research. For severe sepsis, the following were required on two consecutive measurements in a patient with suspected infection: two systemic inflammatory response syndrome (SIRS) criteria (temperature >38.3°C or <35.6°C, heart rate >90 beats/min, respiratory rate >20/min or white blood cell count >12.0 x 10³ or <4.0 x 10³); and sepsis-induced organ dysfunction or tissue hypoperfusion (systolic blood pressure ≤90 mmHg or MAP ≤70 mmHg or a fall of >40 mmHg from baseline or serum lactate ≥4 mmol/L regardless of the blood pressure). Septic shock was defined as above with persistent hypotension despite a 30 mL/kg fluid bolus (12). Patients without a diagnosis of severe sepsis or septic shock, those in whom care was withdrawn within six hours of onset, those not consenting to medical research, and readmissions were excluded (Figure 1). Additionally, those that did not receive adequate EGDT as defined below were excluded so as not to confound mortality. Crystalloid was the type of fluid used for resuscitation. Medical interventions such as thoracentesis, paracentesis, diuretic use (furosemide and/or metolazone), and ultrafiltration were documented; all interventions were utilized at the discretion of the ICU physician. Exclusions to particular interventions were made to account for baseline conditions. For example, patients on chronic dialysis (n=39) were excluded from the “need for ultrafiltration”; patients on outpatient diuretics (n=112) were excluded from the “acute need for diuretics”; liver failure patients (n=34) were excluded from the “need for paracentesis” analysis; and patients with known congestive heart failure (CHF) (n=40) were excluded from the “need for thoracentesis.” Database was constructed and iteratively tested. Two authors (DK and JP) independently assessed clinical evidence of fluid overload criteria in 40 (10%) patients to estimate Cohen's kappa.
Figure 1.
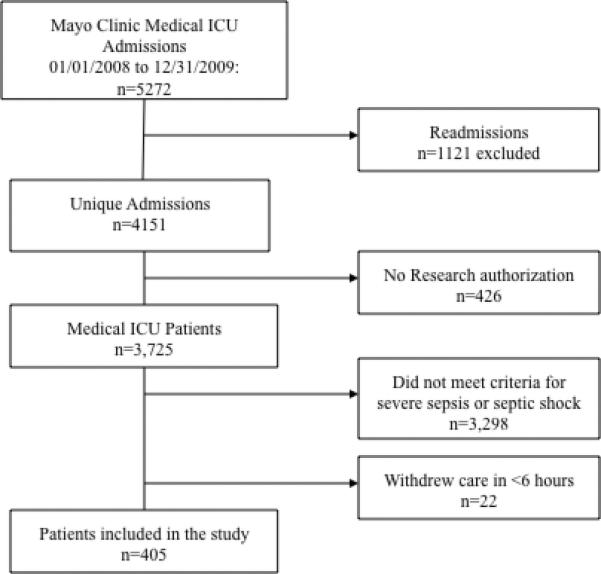
Study flow diagram demonstrating screening and inclusion/exclusion for the study.
Definitions
Adequate EGDT was defined as SCVO2 ≥70%, CVP ≥8 mmHg, MAP ≥65 mmHg, urine output ≥0.5 mL/kg/hour, and/or improvement in lactate within 6 hours (3). If resuscitation goals were achieved after six hours, patients were excluded, as EGDT was considered unsuccessful. Fluid balance and weights (in kilograms [kg]) were recorded at day 1 and day 3. Day 1 and day 3 were defined as 24 hours and 72 hours after admission, respectively. Net fluid balance was defined as the difference between the daily input and output recorded over a 24-hour period. Weight change is the difference between the weight at day 1 or day 3 as compared to the admission weight. Development of new pitting edema, crackles, or anasarca as compared to admission per ICU staff or resident physician documentation was reported as clinical evidence of fluid overload at either day 1 or day 3. If data was missing, then the physical exam findings were presumed to be absent. Chest x-ray findings of fluid overload were based on radiologist report of pulmonary vascular congestion, pulmonary edema, and/or pleural effusion, which had to be new as compared to an admission chest x-ray. The findings of consolidation were not considered as radiographic evidence of fluid overload. The radiologist was not aware of this study. If a patient had physical exam findings and/or chest x-ray findings consistent with fluid overload as noted above at day 1, they were categorized into the group with clinical evidence of fluid overload at day 1, which will be referred to as fluid overload hereafter. If these findings were seen at both day 1 and day 3, patients were classified as persistent fluid overload. Those that did not were categorized as no fluid overload.
Outcomes of interest included whether there was an association between fluid overload and the use of medical interventions (thoracenteses, paracenteses, diuretics use, and ultrafiltration), 30-day ICU readmission, ICU LOS, hospital LOS, and hospital mortality.
Statistical Analysis
All data are summarized as absolute number, mean (standard deviation [SD]), median (interquartile range [IQR]) or percentages. Chi-square test and Wilcoxon rank sum test were used to compare baseline characteristics of patients with evidence of fluid overload and no evidence of fluid overload. Logistic regression models were used to assess the association of fluid overload on medical interventions, ICU readmission, and hospital mortality. Linear regression models were used for both ICU and hospital LOS. Variables were considered for the multivariate logistic or linear regression models if they occurred before the development of the outcomes of interest, had a p-value ≤0.2 in the univariate analysis, and were clinically plausible. The multivariate analyses were adjusted for baseline acute physiology and chronic health evaluation (APACHE) IV, initial lactate, initial bicarbonate, admission weight, and comorbidities such as CHF, depending on the outcomes of interest. The APACHE IV uses the following variables: 1) Age; 2) Chronic health conditions (cirrhosis, hepatic failure, etc); 3) Acute physiologic score (APS) variables (heart rate, blood pressure, creatinine, bilirubin, etc); 4) ICU admission diagnosis; 5) ICU admission source; 6) LOS before ICU admission. This tool has been validated and found to be a better predictor of hospital mortality in critically ill patients than the APACHE III (13). When appropriate, the odds ratio (OR) and 95% confidence intervals (CI) were calculated. Two sided p-values of <0.05 were considered statistically significant. JMP statistical software (version 9.0.1, SAS, Cary, NC) was used for all data analyses.
Results
Demographics
During this study period, there were 5272 MICU admissions of which 1121 were readmissions, 426 did not provide research consent, and 3320 did not meet inclusion criteria, thus 405 patients were included in this study (Figure 1). Baseline demographics are summarized in Table 1. Those with clinical evidence of fluid overload had a higher BMI than those without. The sequential organ failure assessment (SOFA) score were the same but the APACHE III score and APACHE IV were statistically different. The three most common sources of infections were respiratory (37.2%), urinary (19.8%), and soft tissue (13.3%).
Table 1.
Baseline and Patient Characteristics in those with and without clinical evidence of fluid overload
| No Clinical Evidence of Fluid Overload (n=133) | Clinical Evidence of Fluid Overload Day 1 (n=272)a | Clinical Evidence of Persistent Fluid Overload (n=182)b | |
|---|---|---|---|
| Age, median (IQR) | 69 (55-80) | 71 (58-81) | 72 (59-81) |
| Male, n (%) | 80 (60) | 152 (55.9) | 102 (56) |
| BMI, median (IQR) | 27.4 (22.9-31.9) | 28.7 (23.5-34.4)* | 29.5 (23.7-36.3)* |
| Comorbidities, n (%) | |||
| Hypertension | 73 (54.9) | 163 (60) | 115 (63.2) |
| Diabetes mellitus | 53 (39.9) | 105 (38.6) | 80 (44) |
| Chronic kidney disease | 25 (18.8) | 77 (28.3)* | 55 (30) |
| Chronic dialysis | 10 (7.5) | 29 (10.7) | 21 (11.5) |
| Congestive heart failure | 9 (6.8) | 31 (11.4) | 20 (11) |
| Liver failure | 8 (6) | 26 (9.6) | 20 (11)* |
| Medications, n (%) | |||
| Outpatient diuretics | 23 (17.3) | 89 (32.8)* | 61 (33.5)* |
| Severity of Illness | |||
| Severe Sepsis, n (%) | 50 (37.6) | 113 (41.5) | 83 (40.3) |
| Septic Shock, n (%) | 83 (62.4) | 159 (58.5) | 123 (59.8) |
| SOFA, day 1, mean (SD) | 6.74 (3.81) | 6.93 (3.89) | 6.98 (4.03) |
| APACHE III, baseline, mean (SD) | 58.5 (19.2) | 59 (19.9) | 57.3 (21.5)* |
| APACHE IV predicted hospital mortality (%), mean (SD) | 12.3 (12.9) | 15.5 (14.8)* | 16.6 (15)* |
| Charlson score, mean (SD) | 4.5 (2.93) | 5.25 (3.31)* | 5.32 (3.29) |
| Vasopressors, n (%) | 81 (60.9) | 159 (58.5) | 106 (58.2) |
| Mechanical ventilation, n (%) | 37 (27.8) | 99 (36.4) | 76 (41.8) |
| Source of Infection, n (%) | |||
| Abdomen | 30 (22.6) | 41 (15.1) | 31 (17) |
| Respiratory | 43 (32.3) | 108 (39.7) | 71 (39.2) |
| Urinary | 30 (22.6) | 50 (18.4) | 35 (19.2) |
| Laboratory Results | |||
| Positive cultures, n (%) | 91 (68.4) | 184 (67.6) | 125 (68.7) |
| Lactate, mean (SD) | 3 (2.4) | 2.79 (1.99) | 2.74 (1.88) |
| Bicarbonate, mean (SD) | 23 (5.57) | 22.5 (5.38) | 22.6 (5.36) |
| Patient Outcomes | |||
| ICU LOS, median (IQR) | 1.90 (1.18-3.8) | 2.31 (1.35-5.39) | 2.37 (1.31-5.23)* |
| Hospital LOS, median (IQR) | 8.36 (5.0-14.5) | 8.69 (5.26-15.1) | 8.58 (5.16-15.6) |
| Hospital mortality, n (%) | 17 (13.5) | 76 (27.9)* | 61 (29.6)* |
Comparison between those with clinical evidence of fluid overload at day 1 and those without
Comparison between those with persistent evidence of fluid overload and those without
p<0.05
APACHE, acute physiology and chronic health evaluation; SOFA, sequential organ failure assessment
Clinical evidence of fluid overload
The development of fluid overload was seen in 271 patients (67%) at day 1 and 182 patients (48%) had persistent fluid overload. The inter-rater agreement was substantial (kappa = 0.7) (14). In this cohort, 35 (10%) underwent thoracentesis, 32 (4%) paracentesis, 30 (10%) ultrafiltration for fluid removal, and 127 (44%) received diuretics. Only three of the pleural fluid cultures came back positive and six resulted in a change in management. Chest x-rays were obtained at admission in 372 patients (92%). Both clinical and radiographic findings of fluid overload were seen in 76% (n=206) at day 1 and 77% (n=141) in persistent fluid overload at day 3. For those that did not have both findings, in the group with fluid overload at day 1, 34 (52%) had physical exam findings only and 32 (48%) had radiographic findings only. Likewise, in those with persistent fluid overload, 23 (56%) and 18 (44%) had physical and radiographic findings alone, respectively. At day 1, 52% had pulmonary vascular congestion and/or pleural effusions as reported by chest x-ray findings (n=149). By day 3, 10% had new documented pleural effusions (n=14). Crackles and pitting edema were documented in 26% and 40% at day 1 and 28% and 43% at day 3, respectively. No data on clinical evidence of fluid overload was missing at day 1. At day 3, only 6% (n=21) was missing. For those with a respiratory infection and fluid overload at day 1 (n=108), 64 had clinical findings alone, 24 had radiographic findings alone, and 20 had both findings. Similarly, in those with persistent fluid overload (n=71), 51 had clinical findings alone, 13 had radiographic findings alone, and 7 had both. Clinical and radiologic evidence of fluid overload was not associated with recorded positive fluid balance at either day 1 or day 3 (Table 2). There was a difference in weight in those with persistent fluid overload with statistical significance noted at day 1, but not day 3 (Table 2). Those without fluid overload received more fluid (in mL) at both day 1 and day 3; those with persistent fluid overload and fluid overload at day 1 received approximately the same amount of fluids at day 1 and day 3 (Table 2).
Table 2.
Fluid Balance and Weight in those with and without Clinical Evidence of Fluid Overload
| No Clinical Evidence of Fluid Overload (133) | Clinical Evidence of Fluid Overload Day 1a | Clinical Evidence of Persistent Fluid Overloadb | |
|---|---|---|---|
| Fluid balance in mL, day 1 | 5793 (3135-8007) | 4859 (2792-7140) p=0.1 | 4981 (2586-7108) p=0.19 |
| Fluid balance, day 3 | 7132 (4242-10396) | 6983 (4035-11161) p=0.84 | 6969 (4108-11125) p=0.9 |
| Fluids received in mL, day 1 | 5337(1976-7087) | 4481 (2480-6865) p=0.02 | 4586 (2342-6922) p=0.1 |
| Fluids received in mL, day 3 | 500 (133-1495) | 477 (210-960) p=0.78 | 472 (233-938) p=0.31 |
| Admit weight in kg | 76 (63.6-92.8) | 83.1 (65.9-101.3) p=0.03 | 84.7 (68-106) p=0.003 |
| Weight at day 1 in kg | 82.7 (64.8-94.7) | 81 (67.6-103) p=0.25 | 85.9 (71.1-110) p=0.01 |
| Weight at day 3 in kg | 83.5 (70.2-98.2) | 84.2 (70.1-106) p=0.49 | 87.7 (70.1-111) p=0.07 |
| Weight change in kg, day 1 | 0.0 (−0.1-4.8) | 0 (−0.7-4.2) p=0.88 | 0.0 (−0.3-4.7) p=0.43 |
| Weight change in kg, day 3 | 4.9(0.0-8.0) | 4.1(0.0-9.5) p=0.61 | 4.5 (0.0-9.5) p=0.34 |
Day 1 and day 3 are defined as 24 and 72 hours after admission, respectively. Weight change is the difference between the weight at day 1 or day 3 as compared to admission weight in kilograms (kg). All values expressed as median with the interquartile range in parentheses.
Data was available in 100% of the patients for fluid balance at both day 1 and day 3 and admit weight. However, approximately 55-56% and 50-53% of patients in this cohort had a recorded weight at day 1 and day 3, respectively in fluid overload at day 1 and persistent fluid overload.
Comparison between those with clinical evidence of fluid overload at day 1 and those without
Comparison between those with persistent evidence of fluid overload and those without
Outcomes of Interest
Table 3 describes the results of both the univariate and multivariate analyses. Those with fluid overload at day 1 and persistent fluid overload had increased use of thoracentesis with an adjusted OR of 3.40 (1.37-10.3, p=0.007) and 3.83 (1.74-9.15, p=0.0007), respectively. The need for acute diuretics were increased in those with persistent fluid overload, which remained statistically significant with multivariate analysis (OR 1.66 (1.01-2.74, p=0.045). Interestingly, paracentesis was more common in those without fluid overload though this was not statistically significant. The mean difference in ICU LOS was +0.54 days (p=0.24) in those with fluid overload at day 1 and +0.39 days (p=0.39) in those with persistent fluid overload. The 30-day ICU readmission in this sample was 18%, and the difference in readmission rate was not found to be statistically significant in patients with and without fluid overload. Ninety-five (24%) died during the hospitalization which was significantly higher in those with both fluid overload at day 1 and persistent fluid overload with an adjusted OR of 2.27 (CI 1.31-4.09, p=0.003) and 1.92 (CI 1.16-3.22, p=0.01).
Table 3.
Medical Interventions and Secondary Outcomes in those with Clinical Evidence of Fluid Overload: Univariate and Multivariate Analyses
| UNIVARIATE ANALYSES | Clinical Evidence of Fluid Overload Day 1 (n=272) | Clinical Evidence of Persistent Fluid Overload (n=182) | |
| Medical interventions, OR (95% CI) | |||
| Thoracentesisa | 3.38 (1.28-8.95) | 3.10 (1.44-6.68) | |
| Paracentesisb | 0.58 (0.19-1.77) | 0.57 (0.17-1.94) | |
| Ultrafiltrationc | 1.41 (0.66-3.02) | 2.17 (1.06-4.43) | |
| Diureticsd | 1.15 (0.71-1.86) | 1.77 (1.09-2.87) | |
| Secondary Outcomes | |||
| ICU LOS, mean difference (days) | 0.54 (−0.38-1.46) | 0.39 (−0.51 – 1.30) | |
| Hospital LOS, mean difference (days) | 0.99 (−2.25 – 4.22) | 1.55 (−1.64 – 4.74) | |
| 30-day ICU readmission, OR (95% CI) | 1.07 (0.62-1.84) | 1.40 (0.839-2.34) | |
| Hospital mortality, OR (95% CI) | 2.33 (1.34-4.05) | 1.89 (1.16-3.09) | |
| MULTIVARIATE ANALYSES | Medical interventions, OR (95% CI) | ||
| Thoracentesisa, e | 3.40 (1.37-10.3) | 3.83 (1.74-9.15) | |
| Ultrafiltrationc, e | --- | 1.90 (0.90-4.19) | |
| Diureticsd, f | --- | 1.65 (1.00-2.72) | |
| Secondary Outcomes | |||
| 30-day ICU readmission, OR (95% CI)e | --- | 1.61 (0.94-2.79) | |
| Hospital mortality, OR (95% CI)e | 2.27 (1.31-4.09) | 1.92 (1.16-3.22) | |
Univariate analysis conducted on all outcomes of interest. Multivariate analyses was only conducted on those with a p value <0.2 in the univariate analysis.
excluded CHF (n=40)
excluded liver failure (n=34)
excluded chronic dialysis (n=39)
excluded outpatient diuretics (n=112)
adjusted for APACHE IV, initial lactate, admit weight
adjusted for APACHE IV, initial lactate, initial bicarbonate, CHF, admit weight
Discussion
In a contemporary cohort of patients with severe sepsis and septic shock treated with standardized protocol of EGDT, clinical evidence of fluid overload was common and associated with increased medical interventions (thoracenteses and diuretics) and increased hospital mortality. To our knowledge, this is the first study to evaluate the downstream effects of fluid overload after EGDT, specifically the use of fluid overload-related medical interventions and mortality. It is well known that EGDT improves early mortality in the treatment of septic shock. However, downstream management of excess fluid may be equally important in the management of septic patients.
Our study found an increase in hospital mortality in those with clinical evidence of fluid overload. One study found that positive fluid balance is the second most important prognostic factor even when adjusting for severity of illness (1). Mortality rates at 30 days, 60 days and hospital discharge were higher in those with fluid overload and AKI, which improved if treated with dialysis (15). Those with fluid overload at time of initiation of renal replacement therapy had an increased risk of 90-day mortality (16). Another study found that ICU survivors with ARDS were more likely to have a net negative fluid balance as compared to non-survivors (8). Murphy et. al evaluated adequate initial fluid resuscitation and conservative late fluid management in septic shock patients with ALI and found that those that received both had statistically lower hospital mortality as compared to those only receiving conservative late fluids (18.3% versus 41.9%, p <0.001) and to those that just received adequate initial fluids (18.3% versus 56.6%, p <0.001) (17). Interesting, there may be a dose-response association between mortality and fluid accumulation as seen in study conducted in Finnish ICUs (16). Our study found that volume status and day 3 weights were also increased compared to day 1 suggesting patients may continue to receive fluid administration well out of the EGDT window.
Additionally, there was an increase in use of medical interventions in those with fluid overload, specifically thoracentesis and diuretic use. Pleural effusions are commonly seen in critically ill patients with a reported prevalence of 62% (18) and can result from volume overload following aggressive fluid resuscitation (19). Prior studies have shown an association between pleural effusions and an increase in duration of MV as well as higher APACHE scores (18). In our study, pleural effusions led to thoracentesis in 10% of patients, which is similar to a prior studies (20). Additionally, the use of diuretics is common; in one study, its use was found to be 59% in those critically ill patients with AKI (21). Loop diuretics have not been found to be beneficial for those with AKI and could possibly increase mortality (21). Only 48% of CKD stages 3-5 were euvolemic and those with fluid overload were more likely receive antihypertensives and diuretics (22). If fluid overload was present at the time of peak elevation in creatinine in those with AKI, there was a reduced chance for complete kidney recovery and the 30-day mortality was significantly higher in those with fluid overload (15). Although diuretic use is perhaps inevitable after aggressive fluid resuscitation and fluid imbalances, increased medication use increases costs, complexity of care and the potential for patient harm.
Oftentimes, the determination of fluid overload is based on volume status but our study found that positive fluid balance did not correlate with clinical evidence of fluid overload. Additionally, the amount of fluids received at day 1 and day 3 were higher in those without fluid overload. In our study, the weight at day 1 (86 vs. 83 kg) and day 3 (88 vs. 84 kg) was pointedly increased in those with persistent fluid overload but this was not found to be statistically significant. It is unknown why patients with fluid overload did not have a statistical difference in fluid administration. It is interesting to note that BMI were significantly higher in the fluid overload group raising the hypothesis that obesity may be a contributing factor. An alternate hypothesis is that this difference is related to a difference in an underlying comorbidity. Further study is needed. In a study of hemodialysis–dependent CKD patients, they were at increased risk of death by 35% if >5.7% of dry weight (23). Currently, there is not much literature on patient-related outcomes and weight gain in critically ill patients, but there have been some in relation to positive fluid balance. Patients with subarachnoid hemorrhage and positive fluid balance were more likely to prolonged hospital LOS (24). In cancer patients, a cumulative positive fluid balance was independently associated with morality (25). Another study found that accumulative fluid balance from the second and third ICU days and total ICU stay fluid balance were positively associated with hospital mortality. However, both weight and fluid balance can be highly variable due to human error and lack of charting thus it may not be the best way to determine if a patient is fluid overloaded.
There are several limitations in this study. First, clinical evidence of fluid overload is subjective. The categorization of fluid overload depends on appropriate documentation, which can vary among providers. Given the retrospective nature of this study, data was absent in some patients. The decisions for interventions were up to the provider, which can be highly variable within our own institution and elsewhere. We excluded patients who may have alternate diagnoses that required medical interventions other than fluid overload to limit the risk of confounding. The need for medical interventions in some cases may therefore have been underestimated. We also excluded those that did not receive EGDT, which may result in selection bias. Additionally, although we adjusted for confounding variables in the multivariate analysis, our study is non-randomized. Therefore, even though there was an attempt to adjust for patient severity, it is possible that unknown patient factors may be responsible for the development of fluid overload rather than resuscitation approach. This was a single-center study and may not be generalizable to some settings. Also, this cohort was limited to adult medical ICU patients and may not be applicable in the surgical or pediatric ICU population. Furthermore, hypoalbuminemia was not evaluated for and may have affected development of fluid overload. The study's strengths include a large sample size of patients with severe sepsis and septic shock, substantial inter-rater agreement for classification of clinical evidence of fluid overload, and attempt at adjusting for severity of illness with multivariate analyses.
Our study found that persistent clinical and radiologic evidence of fluid overload was associated with an increase in the acute need for fluid-related medical interventions, hospital mortality and increased positive difference in weight but not with recorded positive fluid balance. Further studies are needed to corroborate these findings. Regardless, our results demonstrate that some patients treated with EGDT develop subsequent fluid overload, which may be associated with worse outcomes. Given the burdens we have identified associated with fluid overload, a careful post-EGDT fluid management plan may be needed to avoid worsening volume status following initial EGDT resuscitation.
Conclusions
Fluid overload is common after treatment with a standardized protocol of EGDT in those with septic shock and severe sepsis and may result in worse clinical outcomes. Further studies are needed to determine if there is a suitable threshold for fluids after appropriate resuscitation.
Acknowledgments
This data was presented in part in poster form at the American Thoracic Society conference in Philadelphia in May 2013.
Source of Funding: This publication was supported by Grant Number UL1 TR000135 from the National Center for Advancing Translational Sciences (NCATS). Its contents are solely the responsibility of the authors and do not necessarily represent the official views of the NIH.
Footnotes
Conflicts of Interest: All authors involved have no conflicts of interest.
References
- 1.Vincent J-L, Sakr Y, Sprung CL, Ranieri VM, Reinhart K, Gerlach H, Moreno R, Carlet J, Le Gall J-R, Payen D. Sepsis in European intensive care units: Results of the SOAP study*. Critical Care Medicine. 2006;34(2):344–353. doi: 10.1097/01.ccm.0000194725.48928.3a. [DOI] [PubMed] [Google Scholar]
- 2.Bagshaw SM, Brophy PD, Cruz D, Ronco C. Fluid balance as a biomarker: impact of fluid overload on outcome in critically ill patients with acute kidney injury. Crit Care. 2008;12(4):169. doi: 10.1186/cc6948. [DOI] [PMC free article] [PubMed] [Google Scholar]
- 3.Angus DC, Linde-Zwirble WT, Lidicker J, Clermont G, Carcillo J, Pinsky MR. Epidemiology of severe sepsis in the United States: analysis of incidence, outcome, and associated costs of care. Critical Care Medicine. 2001;29(7):1303–1310. doi: 10.1097/00003246-200107000-00002. [DOI] [PubMed] [Google Scholar]
- 4.Bouchard J, Mehta RL. Fluid balance issues in the critically ill patient. Contrib Nephrol. 2010:16469–78. doi: 10.1159/000313722. [DOI] [PubMed] [Google Scholar]
- 5.Castellanos-Ortega A, Suberviola B, García-Astudillo LA, Holanda MS, Ortiz F, Llorca J, Delgado-Rodríguez M. Impact of the Surviving Sepsis Campaign protocols on hospital length of stay and mortality in septic shock patients: results of a three-year follow-up quasi-experimental study. Critical Care Medicine. 2010;38(4):1036–1043. doi: 10.1097/CCM.0b013e3181d455b6. [DOI] [PubMed] [Google Scholar]
- 6.Alsous F, Khamiees M, DeGirolamo A, Amoateng-Adjepong Y, Manthous CA. Negative fluid balance predicts survival in patients with septic shock: a retrospective pilot study. Chest. 2000;117(6):1749–1754. doi: 10.1378/chest.117.6.1749. [DOI] [PubMed] [Google Scholar]
- 7.Rivers E, Nguyen B, Havstad S, Ressler J, Muzzin A, Knoblich B, Peterson E, Tomlanovich M. Early Goal-Directed Therapy Collaborative Group: Early goal-directed therapy in the treatment of severe sepsis and septic shock. N Engl J Med. 2001;345(19):1368–1377. doi: 10.1056/NEJMoa010307. [DOI] [PubMed] [Google Scholar]
- 8.Sakr Y, Vincent J-L, Reinhart K, Groeneveld J, Michalopoulos A, Sprung CL, Artigas A, Ranieri VM. Sepsis Occurence in Acutely Ill Patients Investigators: High tidal volume and positive fluid balance are associated with worse outcome in acute lung injury. Chest. 2005;128(5):3098–3108. doi: 10.1378/chest.128.5.3098. [DOI] [PubMed] [Google Scholar]
- 9.Boyd JH, Forbes J, Nakada T-A, Walley KR, Russell JA. Fluid resuscitation in septic shock: A positive fluid balance and elevated central venous pressure are associated with increased mortality*. Critical Care Medicine. 2011;39(2):259–265. doi: 10.1097/CCM.0b013e3181feeb15. [DOI] [PubMed] [Google Scholar]
- 10.The ProCESS Investigators: A Randomized Trial of Protocol-Based Care for Early Septic Shock. N Engl J Med. 2014 doi: 10.1056/NEJMoa1401602. 140325070040003 doi:10.1056/NEJMoa1401602. [DOI] [PMC free article] [PubMed] [Google Scholar]
- 11.Dellinger RP, Levy MM, Rhodes A, Annane D, Gerlach H, Opal SM, Sevransky JE, Sprung CL, Douglas IS, Jaeschke R, Osborn TM, Nunnally ME, Townsend SR, Reinhart K, Kleinpell RM, Angus DC, Deutschman CS, Machado FR, Rubenfeld GD, Webb SA, Beale RJ, Vincent J-L, Moreno R. Surviving Sepsis Campaign. Critical Care Medicine. 2013;41(2):580–637. doi: 10.1097/CCM.0b013e31827e83af. [DOI] [PubMed] [Google Scholar]
- 12.Dellinger RP, Levy MM, Rhodes A, Annane D, Gerlach H, Opal SM, Sevransky JE, Sprung CL, Douglas IS, Jaeschke R, Osborn TM, Nunnally ME, Townsend SR, Reinhart K, Kleinpell RM, Angus DC, Deutschman CS, Machado FR, Rubenfeld GD, Webb SA, Beale RJ, Vincent J-L, Moreno R. Surviving Sepsis Campaign. Critical Care Medicine. 2013;41(2):580–637. doi: 10.1097/CCM.0b013e31827e83af. [DOI] [PubMed] [Google Scholar]
- 13.Zimmerman JE, Kramer AA, McNair DS, Malila FM. Acute Physiology and Chronic Health Evaluation (APACHE) IV: Hospital mortality assessment for today???s critically ill patients*. Critical Care Medicine. 2006;34(5):1297–1310. doi: 10.1097/01.CCM.0000215112.84523.F0. [DOI] [PubMed] [Google Scholar]
- 14.Viera AJ, Garrett JM. Understanding interobserver agreement: the kappa statistic. Fam Med. 2005;37(5):360–363. [PubMed] [Google Scholar]
- 15.Bouchard J, Soroko SB, Chertow GM, Himmelfarb J, Ikizler TA, Paganini EP, Mehta RL. Fluid accumulation, survival and recovery of kidney function in critically ill patients with acute kidney injury. Kidney Int. 2009;76(4):422–427. doi: 10.1038/ki.2009.159. [DOI] [PubMed] [Google Scholar]
- 16.Vaara ST, Korhonen A-M, Kaukonen K-M, Nisula S, Inkinen O, Hoppu S, Laurila JJ, Mildh L, Reinikainen M, Lund V, Parviainen I, Pettilä V, group TFS Fluid overload is associated with an increased risk for 90-day mortality in critically ill patients with renal replacement therapy: data from the prospective FINNAKI study. Crit Care. 2012;16(5):R197. doi: 10.1186/cc11682. [DOI] [PMC free article] [PubMed] [Google Scholar]
- 17.Murphy CV, Schramm GE, Doherty JA, Reichley RM, Gajic O, Afessa B, Micek ST, Kollef MH. The importance of fluid management in acute lung injury secondary to septic shock. Chest. 2009;136(1):102–109. doi: 10.1378/chest.08-2706. [DOI] [PubMed] [Google Scholar]
- 18.Mattison LE, Coppage L, Alderman DF, Herlong JO, Sahn SA. Pleural effusions in the medical ICU: prevalence, causes, and clinical implications. Chest. 1997;111(4):1018–1023. doi: 10.1378/chest.111.4.1018. [DOI] [PubMed] [Google Scholar]
- 19.Maslove DM, Chen BT-M, Wang H, Kuschner WG. The diagnosis and management of pleural effusions in the ICU. J Intensive Care Med. 2013;28(1):24–36. doi: 10.1177/0885066611403264. [DOI] [PubMed] [Google Scholar]
- 20.Fartoukh M, Azoulay E, Galliot R, Le Gall J-R, Baud F, Chevret S, Schlemmer B. Clinically documented pleural effusions in medical ICU patients: how useful is routine thoracentesis? Chest. 2002;121(1):178–184. doi: 10.1378/chest.121.1.178. [DOI] [PubMed] [Google Scholar]
- 21.Mehta RL, Pascual MT, Soroko S, Chertow GM. PICARD Study Group: Diuretics, mortality, and nonrecovery of renal function in acute renal failure. JAMA. 2002;288(20):2547–2553. doi: 10.1001/jama.288.20.2547. [DOI] [PubMed] [Google Scholar]
- 22.Hung S-C, Kuo K-L, Peng C-H, Wu C-H, Lien Y-C, Wang Y-C, Tarng D-C. Volume overload correlates with cardiovascular risk factors in patients with chronic kidney disease. :1–7. doi: 10.1038/ki.2013.336. 2013.doi:10.1038/ki.2013.336. [DOI] [PubMed] [Google Scholar]
- 23.Leggat JE, Jr, Orzol SM, Hulbert-Shearon TE, Golper TA, Jones CA, Held PJ, Port FK. Noncompliance in Hemodialysis: Predictors and Survival Analysis. American Journal of Kidney Diseases. 2001;32(1):139–145. doi: 10.1053/ajkd.1998.v32.pm9669435. [DOI] [PubMed] [Google Scholar]
- 24.Martini RP, Deem S, Brown M, Souter MJ, Yanez ND, Daniel S, Treggiari MM. The association between fluid balance and outcomes after subarachnoid hemorrhage. Neurocrit Care. 2011;17(2):191–198. doi: 10.1007/s12028-011-9573-0. [DOI] [PubMed] [Google Scholar]
- 25.ALMEIDA JP, PALOMBA H, GALAS FRBG, FUKUSHIMA JT, DUARTE FA, NAGAOKA D, TORRES V, YU L, VINCENT JL, AULER JOC JR, HAJJAR LA. Positive fluid balance is associated with reduced survival in critically ill patients with cancer. Acta Anaesthesiol Scand. 2012;56(6):712–717. doi: 10.1111/j.1399-6576.2012.02717.x. [DOI] [PubMed] [Google Scholar]