Abstract
The exercise pressor reflex, a crucial component of the cardiovascular response under physiological and pathophysiological states, is activated via metabolic and mechanical mediators that originate from contracting muscles and stimulate group III and IV afferents. We reported previously that stimulation of mu opioid receptors (MOR), expressed in both afferents, led to a significant attenuation of the reflex in rats whose femoral arteries had been occluded for 72 h. The present study examined the effect of arterial occlusion on the signaling components involved in the opioid-mediated modulation of Ca2+ channels in rat dorsal root ganglion neurons innervating the triceps surae muscles. We focused on neurons that were transfected with cDNA coding for enhanced green fluorescent protein whose expression is driven by the voltage-gated Na+ channel 1.8 (NaV1.8) promoter region, a channel expressed primarily in nociceptive neurons. With the use of a small interference RNA approach, our results show that the pertussis toxin-sensitive Gαi3 subunit couples MOR with Ca2+ channels. We observed a significant leftward shift of the MOR agonist [d-Ala2-N-Me-Phe4-Glycol5]-enkephalin concentration-response relationship in neurons isolated from rats with occluded arteries compared with those that were perfused freely. Femoral occlusion did not affect Ca2+ channel density or the fraction of the main Ca2+ channel subtype. Furthermore, Western blotting analysis indicated that the leftward shift did not result from either increased Gαi3 or MOR expression. Finally, all neurons from both groups exhibited an inward current following exposure of the transient potential receptor vanilloid 1 (TRPV1) agonist, 8-methyl-N-vanillyl-6-nonenamide. These findings suggest that sensory neurons mediating the exercise pressor reflex express NaV1.8 and TRPV1 channels, and femoral occlusion alters the MOR pharmacological profile.
Keywords: exercise pressor reflex, Nav1.8 promoter region, whole-cell patch clamp
exercise leads to the stimulation of both cardiovascular and respiratory functions, a response that is mediated by a reflex arising from contracting muscles. The afferent arm of the reflex, named the exercise pressor reflex (Mitchell et al. 1983), is comprised of group III and IV muscle afferents (Coote et al. 1971; Kaufman et al. 1983; McCloskey and Mitchell 1972). Under certain pathological conditions, such as peripheral arterial disease (PAD), the skeletal muscle has a limited blood supply. In patients with PAD, blood flow meets the metabolic needs under resting conditions but fails to do so during exercise and results in reports of pain, which in turn, have been termed intermittent claudication. Furthermore, in patients with PAD, the exercise pressor reflex is greater than that evoked in their healthy counterparts (Bakke et al. 2007).
Opioid receptors are known to share overlapping distribution in both central and peripheral nervous systems (Goldstein and Naidu 1989; Williams et al. 2001). Stimulation of peripheral mu opioid receptors (MOR), expressed in group III and IV afferents (Coggeshall et al. 1997), has been reported to attenuate the exercise pressor reflex in rats whose femoral arteries had been occluded for 72 h (Tsuchimochi et al. 2010). Activation of MOR leads to inhibition of voltage-gated Ca2+ channels (Cav), activation of G protein inwardly rectifying K+ channels, and negative coupling to adenylyl cyclase (Fig. 1). Opioid peptides mediate their effects by coupling MOR to members of the pertussis toxin (PTX)-sensitive Gαi/o family of heterotrimeric G proteins (Williams et al. 2001).
Fig. 1.
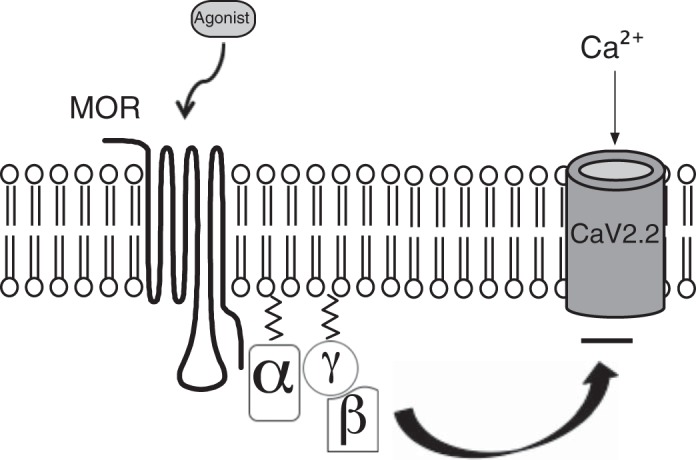
Model depicting the G protein-mediated modulation of Ca2+ channels following mu opioid receptor (MOR) activation. The binding of the receptor agonist {i.e., [d-Ala2-N-Me-Phe4-Glycol5]-enkephalin (DAMGO)} leads to MOR activation and allosteric changes in the conformation of the heterotrimeric G protein. The Gα subunit releases GDP and binds GTP. The GTP-bound Gα thereafter dissociates from the Gβγ dimer, and the latter moiety binds to Ca2+ channels, leading to voltage-dependent inhibition of Ca2+ currents [N-type Ca2+ channel (CaV2.2)]. The cycle is completed following the hydrolysis of GTP and reassociation of the Gα and Gβγ subunits.
Voltage-gated Na+ channels (NaV), which mediate the action potential in group III and IV fibers, can be subdivided into TTX sensitive and TTX resistant (Rush et al. 2007). Group III afferents express only TTX-sensitive Na+ channels, whereas group IV afferents express TTX-resistant and possibly TTX-sensitive Na+ channels. The TTX-resistant NaV1.8 channels are involved in pain transmission and are expressed primarily in small and medium neurons within dorsal root ganglia (DRG) and cranial sensory ganglia (Akopian et al. 1996; Novakovic et al. 1998; Sangamaswaran et al. 1996). A recent report identified the putative promoter region of the NaV1.8 channel in DRG neurons (Puhl and Ikeda 2008). In that study, the enhanced green fluorescent protein (EGFP) was used as the reporter construct for this region (∼4 kb), making it a valuable tool to study sensory neurons that transmit pain signals. Thus the purpose of the present study was twofold: first, we wanted to identify the specific PTX-sensitive Gα subunit that mediates the functional coupling of MOR and Ca2+ channels in acutely isolated DRG neurons expressing EGFP (whose expression was driven by the NaV1.8 promoter region); second, we examined the effect of 72-h femoral ligation on the signaling elements involved in the MOR-mediated modulation of Ca2+ channel currents of EGFP-expressing DRG neurons. This animal model simulates the blood flow patterns found in the legs of patients with PAD (Waters et al. 2004).
MATERIALS AND METHODS
DRG neuron labeling, isolation, and cDNA transfection.
The Penn State College of Medicine Institutional Animal Care and Use Committee approved the experiments performed in this study. The lumbar (L4–L6) DRG neurons were isolated, as described previously (Hassan and Ruiz-Velasco 2013). Briefly, adult male Sprague-Dawley rats were anesthetized initially with CO2 and then decapitated quickly with a laboratory guillotine. The lumbar (L4–L6) DRG were next removed and placed in ice-cold HBSS (Sigma-Aldrich, St. Louis, MO). The dissociated neurons were next plated onto polystyrene culture dishes, coated with poly-L-lysine, and stored in a humidified atmosphere containing 5% CO2/95% air at 35°C. Following a 3-h incubation period, the DRG neurons were microinjected with a cDNA plasmid coding for EGFP, whose expression is driven by the putative NaV1.8 promoter region [a kind gift from Dr. Henry L. Puhl III, National Institute on Alcohol Abuse and Alcoholism (NIAAA), U.S. National Institutes of Health (NIH), Bethesda, MD]. The final concentration of the microinjected clone was 0.4 μg/μl. Afterward, the neurons were stored in MEM containing 10% FBS, 1% glutamine, 1% penicillin-streptomycin, ciliary-derived growth factor (15 ng/ml), nerve growth factor (15 ng/ml), and glial-derived neurotrophic factor (6 ng/ml) and incubated overnight at 35°C. Whole-cell Ca2+ currents were acquired from EGFP-expressing DRG neurons.
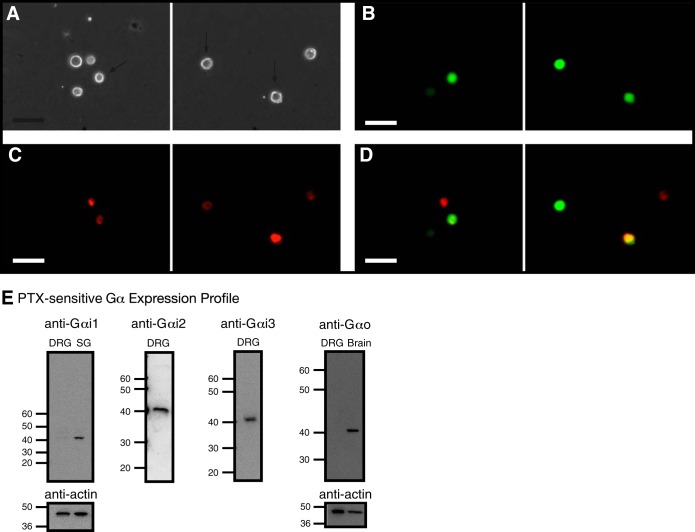
In one set of experiments, the left femoral arteries of seven rats were ligated under anesthesia, and the DRG neurons innervating the triceps surae muscle were retrogradedly labeled as follows. Five days before neuron isolation, the rats were anesthetized with isofluorane (3–5%), and thereafter, 15–20 μl of 1,1′-dioctadecyl-3,3,3′,3′-tetramethylindocarbocyanine perchlorate (DiI; 3% in DMSO) was injected into the triceps surae muscles. Three days (72 h) before neuron isolation, the rats were re-anesthetized and had their left femoral arteries ligated with 5-0 silk sutures distal to the inguinal ligament, as described previously (Prior et al. 2004; Yang et al. 2000). This procedure reduces blood flow reserve capacity lower than normal, but there is sufficient blood flow to meet metabolic needs at rest (Prior et al. 2004; Waters et al. 2004). Afterward, the wounds were closed with skin clips, and the animals were allowed to recover for 72 h before DRG isolation. Femoral artery occlusion has been reported to have no effect on normal cage activity (Taylor et al. 2008). In this set of experiments, the freely perfused hindlimbs (right) served as controls. The rats were killed 72 h later, and the DRG (L4–L6) were collected from the freely perfused (right; seven samples) and ligated (left; seven samples) sides. The DRG neurons were dispersed and transfected with the cDNA construct, as described above. Following overnight incubation, whole-cell Ca2+ currents were recorded from DiI-labeled and EGFP-expressing DRG neurons (Fig. 2, A–D).
Fig. 2.
Fluorescence imaging of retrograde-labeled and enhanced green fluorescent protein (EGFP) reporter-microinjected cDNA in rat dorsal root ganglia (DRG) neurons and detection of pertussis toxin (PTX)-sensitive Gα subunit expression in DRG tissue. Phase (A) and fluorescence (B–D) images of acutely isolated DRG neurons, 5 days post-1,1′-dioctadecyl-3,3,3′,3′-tetramethylindocarbocyanine perchlorate (DiI) injection in the triceps surae muscles and ∼18 h post-cDNA transfection. The neurons were imaged at 20×, with a filter set containing an excitation filter at 480 nm and an emission filter at 535 nm (for EGFP, B) and an excitation filter at 540 nm and an emission filter at 585 nm (for DiI, C). D: images represent color-joined images from B and C. The images were pseudocolored; scale bars represent 60 μm. The arrows (A) point to DiI-labeled and EGFP-expressing neurons. E: expression of Gα subunits in DRG tissue. Western blot assays showing the natively expressed Gα subunits. The blots used anti-Gαi1, -Gαi2, -Gαi3, -GαO, and -actin. Each lane was loaded with 20–25 μg protein. Gαi1 and GαO were not detected in DRG tissue but were present in stellate ganglion (SG) and brain tissue, respectively. The lines/numbers to the left of the blots indicate the approximate molecular masses (kDa).
DRG transfection with small interference RNA.
The DRG tissue was transfected with small interference RNA (siRNA) using electroporation and lipofection, as described previously (Mahmoud et al. 2012). Briefly, once L4–L6 DRG tissue was removed, it was first electroporated with the Neon electroporator (Life Technologies, Carlsbad, CA) with three 1,000-V pulses for 20 ms duration in an electroporation solution, which consisted of R solution (Life Technologies), scrambled or Gα-targeted siRNA (3,000 nM; Life Technologies), and 2 mM 2,3-butanedione monoxime (BDM). Following the electroporation procedure, the DRG were next placed in a 22-mm dish containing Opti-MEM and Lipofectamine 2000 (both from Life Technologies), 2 mM BDM, and scrambled or Gα-targeted siRNA for 5 h and kept in a humidified incubator (same as above). After the incubation period in the lipofection solution, the DRG was rinsed three times with supplemented MEM (same as above) and also stored in MEM in a humidified incubator. This double-transfection protocol was performed a second time, 48 h after the initial transfection. The siRNA sequences used to silence Gα subunits were: Gαi2, 5′-UCA CUG ACG UCA UCA UCA AUU-3′; Gαi3, 5′-UCA AGG AGC UCU ACU UCA AUU-3′; and GαO, 5′-CCA UCU GCU UUC CUG AAU AUU-3′. Control DRG groups were transfected with scrambled siRNA.
Quantitative real-time PCR assays.
To verify the efficiency of G protein knockdown, quantitative real-time PCR (QRT-PCR) analysis of Gα expression in DRG tissues was carried out. Total RNA and protein from DRG tissue were isolated with the NucleoSpin RNA/Protein Kit (Macherey-Nagel, Bethlehem, PA) and the standard protocol, according to the manufacturer. Thereafter, equal cDNA synthesis was performed using the High Capacity cDNA RT Kit (Life Technologies). For QRT-PCR experiments, the TaqMan Gene Expression assays (Life Technologies) specific for rat Gαi2, Gαi3, and GAPDH were carried out, according to the manufacturer's instructions. The assays were run on a 7900HT PCR system (Life Technologies) and analyzed using the comparative threshold method. The results were normalized to internal GAPDH mRNA controls.
Neuron imaging.
Phase contrast and fluorescence images were obtained with a Nikon TE2000 microscope using a 20× objective, the Photo Fluor II (89 North, Burlington, VT) for illumination, an Orca-ER-1394 digital charge-coupled device (CCD) camera (Hamamatsu Photonics, Bridgewater, NJ), and iVision software (BioVision Technologies, Exton, PA) for acquisition. The acquired images were processed and pseudocolored with iVision software.
Electrophysiology and data analysis.
The whole-cell patch-clamp technique was used to record Ca2+ channel currents with an Axopatch 200B Amplifier (Molecular Devices, Sunnyvale, CA). Data acquisition was performed with custom-designed software (S5) on a Macintosh G4 computer (Apple, Cupertino, CA), written by Dr. Stephen R. Ikeda (NIAAA, NIH). Ca2+ currents were evoked every 10 s with the “double-pulse” voltage protocol, which consists of a holding potential of −80 mV, a test pulse to +10 mV (the prepulse), followed by a strong depolarization step to +80 mV, a brief return to −80 mV, and finally, another test pulse to +10 mV (the postpulse). The pipette solution consisted of (in mM): N-methyl-d-glucamine 80, tetraethyl ammonium hydroxide (TEA-OH) 20, CsCl 20, CsOH 40, creatine phosphate 14, HEPES 10, CaCl2 1, Mg-ATP 4, Na2GTP 0.3, and EGTA 11. The pH was adjusted to 7.2 with CH3SO3H, and the osmolality was 293–302 mosmol/kgH2O. The external solution consisted of (in mM): CH3SO3H 140, TEA-OH 145, HEPES 10, glucose 15, CaCl2 10, and TTX 0.0003. The pH was adjusted to 7.4 with TEA-OH, and the osmolality ranged from 320 to 330 mosmol/kgH2O. The MOR agonist [d-Ala2-N-Me-Phe4-Glycol5]-enkephalin (DAMGO) and transient potential receptor vanilloid 1 (TRPVI) agonist 8-methyl-N-vanillyl-6-nonenamide (capsaicin; both from Sigma-Aldrich) were diluted in the external solution to their final concentrations on the day of the experiment. Stock solutions of ω-conotoxin GVIA and ω-agatoxin IVA (both from Alomone Labs, Jerusalem, Israel) were prepared in water and then diluted in the external solution. However, when using peptide toxins, 0.1 mg/ml cytochrome c (Sigma-Aldrich) was added to all external solutions to minimize the potential binding of the toxins to the capillary columns used for drug delivery. The external solution used to record capsaicin-induced currents consisted of (in mM): NaCl 140, KCl 5.4, HEPES 10, MgCl2 1, CaCl2 10, and glucose 10. The pH was adjusted to 7.4 with NaOH. For data and statistical analysis, IGOR Pro (WaveMetrics, Lake Oswego, OR) and Prism (GraphPad Software, San Diego, CA) were used, respectively. P < 0.05 was considered statistically significant. Graphs and current traces were generated with both IGOR Pro (WaveMetrics) and iDraw (Indeeo, Palo Alto, CA) software packages. All data are expressed as mean ± SE unless stated otherwise.
Western blot assays.
Protein concentrations were measured with the Qubit 2 fluorometer (Life Technologies). Protein samples (15–25 μg) were electrophoretically separated on Novex 10% Tris-glycine precast gels (Life Technologies) using 125 V at 4°C for 90 min and then transferred to polyvinylidene difluoride (PVDF; Life Technologies) or nitrocellulose (GE Healthcare, Piscataway, NJ) membranes. For MOR detection, the membranes were incubated with anti-MOR (1:8,000) rabbit MAb (Cat. No. ab134054; Abcam, Cambridge, MA) overnight (∼12 h) at 4°C. For Gα subunit detection, the membranes were blocked with 7% milk in Tris-buffered saline-Tween 20 buffer overnight at 4°C. Afterward, they were incubated with anti-Gαi1 (1:1,000) mouse MAb (Cat. No. MS-243-P1; Thermo Scientific, Fremont, CA); Gαi2 (1:500; Cat. No. ab20392, Abcam; or Cat. No. MS-244-P1, Thermo Scientific) or Gαi3 (0.33 μg/ml; Cat. No. LS-B9757 or LS-C117083; LifeSpan BioSciences, Seattle, WA) rabbit polyclonal antibody; GαO (1:250–1:1,000) mouse MAb (Cat. No. ab78218; Abcam); or rabbit polyclonal antibody (Cat. No. 3975S; Cell Signaling Technology, Danvers, MA) for 90 min at room temperature. Thereafter, the membranes were rinsed and incubated with horseradish peroxidase (HRP)-conjugated anti-mouse IgG antibody (1:12,000–1:15,000; Cat. No. NA931VS; GE Healthcare) or anti-rabbit IgG antibody (1:12,000–1:15,000; Cat. No. NA934VS; GE Healthcare) for 60 min at room temperature. After the membranes were rinsed, the protein bands were visualized, using the enhanced chemiluminescent reagent, SuperSignal West Femto (Thermo Scientific). The images were acquired with a ChemiDoc-It Imaging System (UVP, Upland, CA), equipped with a 16-bit CCD camera and processed with VisionWorks LS software (UVP). To normalize for protein loading, the PVDF or nitrocellulose membranes were stripped with the Restore Western Blot Stripping Buffer (Thermo Scientific) and then retested with anti-actin (1:2,500–1:4,000) mouse MAb (Cat. No. ab11003; Abcam). The membranes were rinsed and incubated in HRP-conjugated anti-mouse IgG antibody (described above). The actin bands were also visualized and quantified with VisionWorks LS software (UVP). In one set of experiments (see Fig. 2E), the brain and stellate ganglion (SG) tissue were isolated (Margas et al. 2008) and used as a positive control for Gαi1 and GαO protein detection, respectively.
RESULTS
Gαi3 proteins couple MOR to CaV2.2 channels in EGFP-expressing DRG neurons.
Our group has previously shown that MOR stimulation attenuated the exercise pressor reflex in rats whose femoral arteries were ligated for 72 h but had minimal effect on the reflex in their freely perfused counterparts (Tsuchimochi et al. 2010). Thus in the present study, we began to probe further the signaling elements that specifically couple MOR with Ca2+ channels (Fig. 1) and whether a 72-h femoral occlusion would alter the MOR-mediated modulation of Ca2+ channel currents in sensory DRG neurons innervating the triceps surae muscles. The DRG neurons under study were transfected with a cDNA construct coding for EGFP (described in materials and methods). Figure 2A shows phase, and Fig. 2, B–D, shows fluorescence images of acutely dissociated DRG neurons from a rat in which DiI was injected into the triceps surae muscle, 5 days before cell dispersion, and microinjected with the cDNA construct, 3–5 h postdispersion. The images in Fig. 2, B and C, illustrate, respectively, four neurons expressing EGFP and five neurons effectively labeled with DiI.
In the first set of experiments, Western blotting assays were performed to determine the expression profile of PTX-sensitive Gα proteins in L4–L6 DRG neurons. Figure 2E illustrates that Gαi2 and Gαi3 (∼40 kDa) are expressed in DRG tissue. On the other hand, Gαi1 and GαO expression was not detected in DRG tissue. However, as positive controls, we used SG and brain tissue, since we have shown previously that the former Gα subunit mediates the coupling of Ca2+ channels with nociceptin/orphanin FQ receptors (Margas et al. 2008). The blots show that under our experimental conditions, both Gαi1 and GαO were detected in SG and brain tissue.
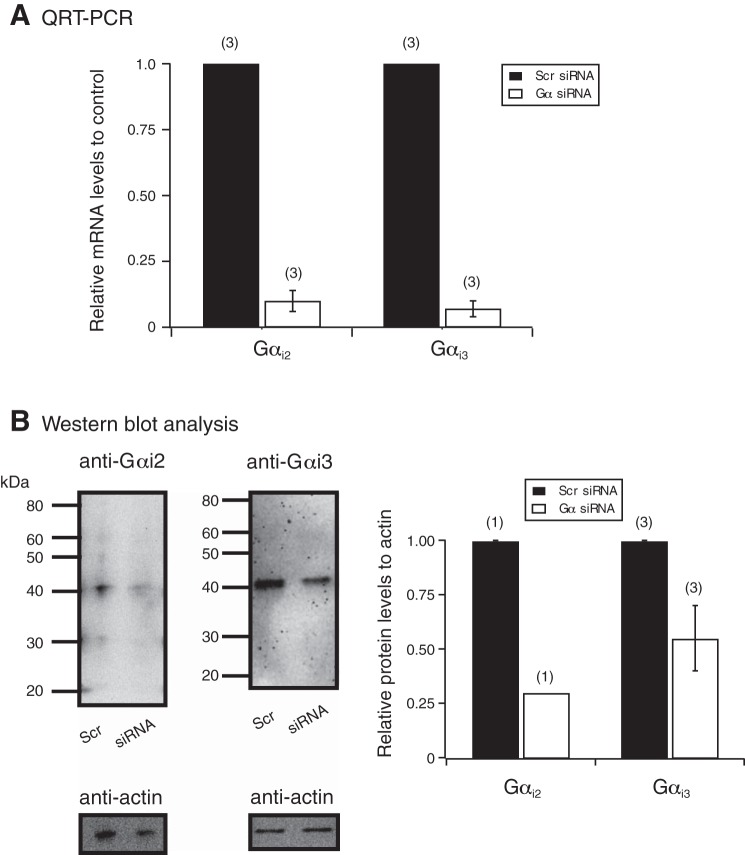
We next used siRNA nucleotides designed to silence Gαi2 and Gαi3 proteins detected in DRG tissue and thereafter, examined the coupling specificity of MOR with Ca2+ channels. Figure 3A summarizes the QRT-PCR results, 96 h post-siRNA transfection. It can be observed that mRNA levels for each targeted Gα subunit were lower compared with DRG tissue transfected with scrambled siRNA. Furthermore, Fig. 3B shows Western blots used to measure Gα protein levels in DRG tissue transfected with scrambled and Gα-targeted siRNA. Both Gαi2 and Gαi3 protein levels were lower than those in DRG tissue transfected with scrambled siRNA.
Fig. 3.
Detection of Gαi2 and Gαi3 subunits by quantitative real-time PCR (QRT-PCR) and Western blot analysis in DRG, 96 h post-small interference RNA (siRNA) transfection. A: a plot of the quantitative assessment of Gαi2 and Gαi3 mRNA expression by QRT-PCR in DRG tissue, 96 h post-siRNA transfection. The changes in comparative threshold values were determined for all groups, and the specific Gα mRNA levels were measured relative to GAPDH mRNA levels. The mRNA levels are expressed as fold change compared with DRG tissue that was transfected with scrambled (Scr) siRNA. The numbers in parentheses indicate the number of rats used for each Gαi subunit knockdown experiment. B: Western blot assays show the results with anti-Gαi2, -Gαi3, and -actin in DRG tissue transfected with scrambled or Gαi2 or Gαi3 siRNA. Each lane was loaded with ∼25 μg protein. The lines/numbers to the left of the blots indicate the approximate molecular masses (kDa). The summary plot shows the analysis of the blots for actin and both Gα subunits, which was performed by measuring the area density (i.e., intensity) and then plotting the ratio of each Gα subunit to its respective actin value. The numbers in parentheses indicate the number of rats used for each Gαi subunit knockdown experiment.
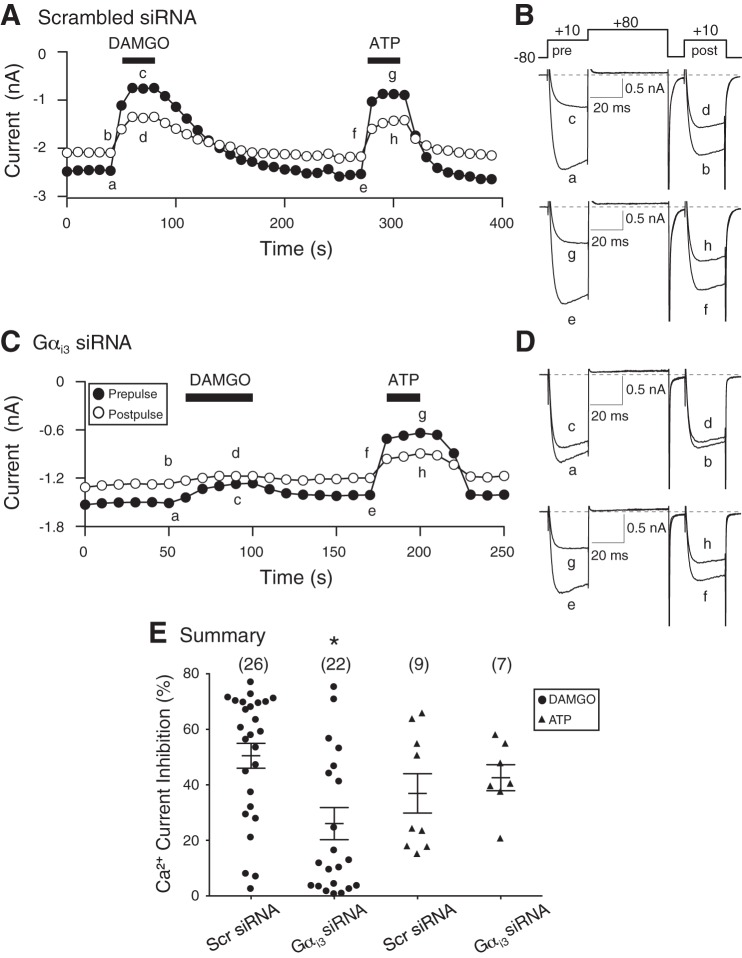
The functional coupling of MOR and Ca2+ channels was examined next in DRG neurons isolated from DRG tissue that had been transfected with specific Gαi2 or Gαi3 siRNA and also transfected with the cDNA construct containing the NaV1.8 promoter region (described in materials and methods). It should be noted that in all control electrophysiological experiments performed, coupling of MOR with Ca2+ channels was observed in ∼90% of neurons tested. Figure 4A shows the time course of the peak Ca2+ current amplitude of pre- and postpulse currents acquired before (traces a and b and e and f; Fig. 4B) and during (traces c and d and g and h; Fig. 4B) application of the high-affinity MOR agonist DAMGO (10 μM) and ATP (10 μM) in a DRG neuron transfected with scrambled siRNA. The Ca2+ channel currents were evoked every 10 s with the double-pulse voltage protocol (shown in Fig. 4B), and the peak current amplitude was measured isochronally, 10 ms after the start of the pre- and postpulse. The superimposed Ca2+ currents shown in Fig. 4B correspond to those plotted in Fig. 4A. Application of DAMGO resulted in a 70% inhibition of the prepulse current (trace c). After a recovery period, exposure of the neuron to ATP led to a 66% inhibition of the prepulse current (trace g). It can be seen that the current inhibition was greater during the prepulse (traces c and g) than the postpulse (traces d and h) for both DAMGO and ATP. This is indicative of a voltage-dependent inhibition of the current and also characterized by a “kinetic slowing” of the prepulse current and an enhanced postpulse current (Ikeda 1991). The time course shown in Fig. 4C was recorded from a DRG neuron transfected with Gαi3 siRNA, and the corresponding numbered current traces are shown in Fig. 4D. The neuron was exposed initially to DAMGO, and the Ca2+ current was blocked by ∼17% (trace c). As a positive control, ATP was applied next (trace g), and Ca2+ currents were inhibited by ∼55%. For both agonists, the currents were also inhibited in a voltage-dependent manner, although to a lesser extent in the presence of DAMGO. Figure 4E is a summary scatter plot showing the mean (±SE) DAMGO- and ATP-mediated Ca2+ current inhibition in DRG neurons transfected with scrambled or Gαi3 siRNA. The plot indicates that the silencing of Gαi3 subunits led to a significant (P < 0.05) decrease in coupling between MOR and Ca2+ channels, whereas the ATP (i.e., purinergic/P2Y) modulation of Ca2+ channels was not overtly affected (P = 0.54). Thus in this set of DRG neurons, P2Y G protein-coupled receptors do not use Gαi2 proteins. The ATP-mediated modulation of Ca2+ currents is similar to that reported previously in this subset of DRG neurons (Ramachandra et al. 2013).
Fig. 4.
Time courses of Ca2+ current amplitude for prepulse and postpulse acquired from the sequential application of DAMGO (10 μM) and ATP (10 μM, positive control) in acutely isolated DRG neurons transfected with scrambled (A and B) or Gαi3 (C and D) siRNA. The Ca2+ currents, obtained from EGFP-expressing neurons, were evoked every 10 s, with the “double-pulse” voltage paradigm (B, top). A and C: the lowercase letters represent the current traces shown to the right (B and D, respectively). E: summary dot plot of the mean (±SE) Ca2+ current inhibition produced by DAMGO (•) and ATP (▲) in neurons transfected with scrambled or Gαi3 siRNA. Numbers in parentheses indicate the number of neurons tested. *P < 0.05 compared with neurons transfected with scrambled siRNA, Student's t-test.
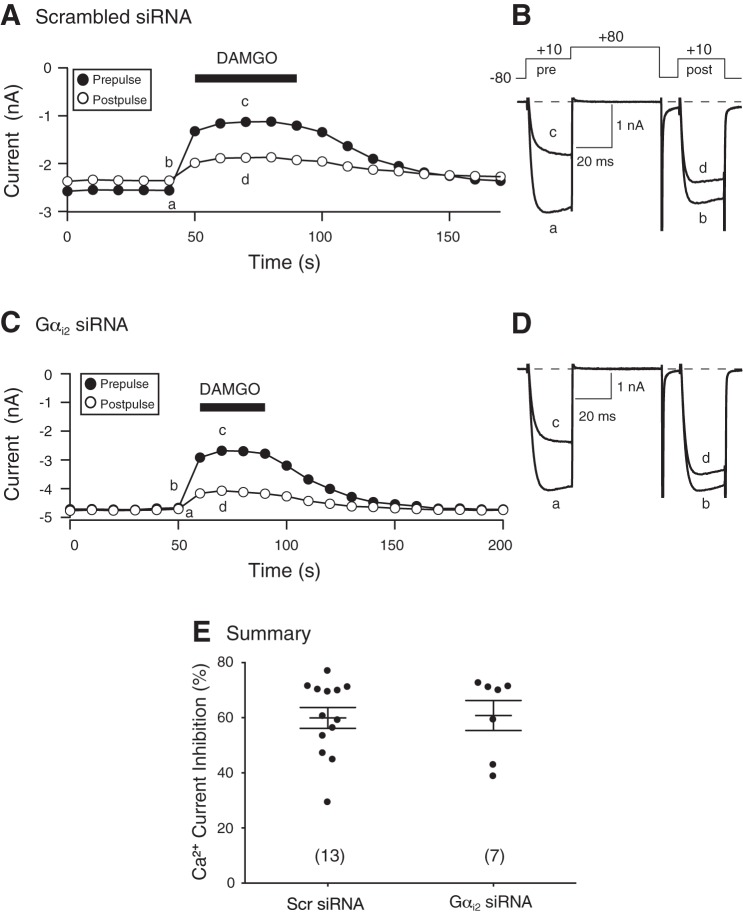
The effect of silencing Gαi2 in DRG neurons was examined next. Figure 5A shows the time course of peak current amplitude of an EGFP-expressing DRG neuron, transfected with scrambled siRNA, before and during DAMGO (10 μM) application. The superimposed current traces (traces a–d) are also shown (Fig. 5B). Application of DAMGO resulted in a 50% block of the Ca2+ currents that was also voltage dependent. Similarly, the time course in Fig. 5C illustrates that exposure to DAMGO of a Gαi2-silenced and EGFP-expressing neuron led to voltage-dependent inhibition of Ca2+ currents. The superimposed traces (a–d) are shown in Fig. 5D. The scatter plot shown in Fig. 5E is a summary of the DAMGO-mediated Ca2+ current inhibition in EGFP-expressing neurons transfected with scrambled or Gαi2 siRNA. No significant difference in current inhibition was found between both groups of neurons. These results indicate that unlike Gαi2 subunits, Gαi3 proteins are essential for coupling of MOR with Ca2+ channels in this neuron subtype.
Fig. 5.
Time courses of Ca2+ current amplitude for prepulse and postpulse acquired from the sequential application of DAMGO (10 μM) in acutely isolated DRG neurons transfected with scrambled (A and B) and Gαi2 (C and D) siRNA. The Ca2+ currents were obtained from EGFP-expressing neurons and were evoked every 10 s with the double-pulse voltage paradigm (4B, top). A and C: the lowercase letters represent the current traces shown to the right (B and D, respectively). E: summary dot plot of the mean (±SE) DAMGO-mediated Ca2+ current inhibition in neurons transfected with scrambled or Gαi2 siRNA. Numbers in parentheses indicate the number of neurons tested.
Femoral occlusion alters the MOR pharmacological profile of DRG neurons.
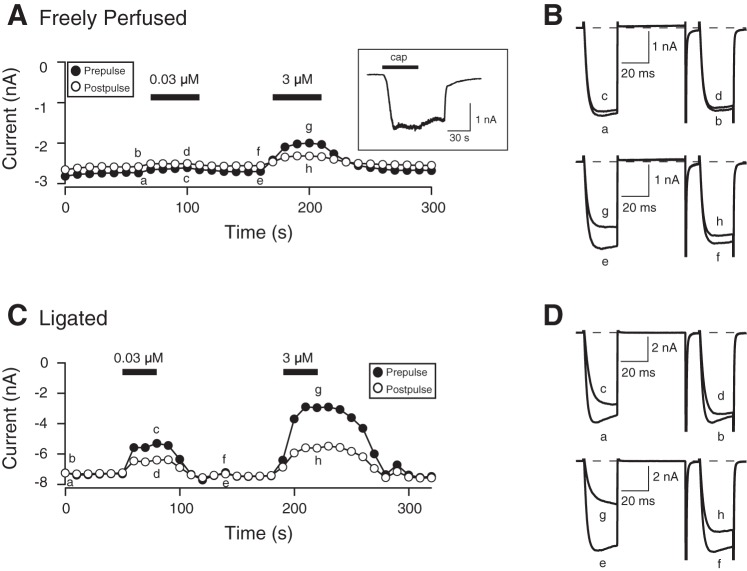
Given that the exercise pressor reflex was attenuated following MOR stimulation in rats with ligated femoral arteries (Tsuchimochi et al. 2010), we next examined the effect of 72-h femoral arterial ligation on the concentration-response relationship for DAMGO in DiI-labeled and EGFP-expressing DRG neurons. Figure 5A shows the time course of the peak Ca2+ current amplitude of pre- and postpulse currents acquired before (traces a and b and e and f; Fig. 6B) and during (traces c and d and g and h; Fig. 6B) application of 0.03 and 3 μM DAMGO on a DRG neuron from a rat with a freely perfused leg. The Ca2+ channel currents were evoked every 10 s with the double-pulse voltage protocol (shown in Fig. 4B), and the peak current amplitude was measured as described above. The superimposed Ca2+ currents shown in Fig. 6B correspond to those plotted in Fig. 6A. Application of 0.03 μM DAMGO resulted in a 5% inhibition of the prepulse current (trace c). After a recovery period, exposure of the neuron to 3 μM DAMGO led to a 25% inhibition of the prepulse current (trace g). The time course shown in Fig. 6C was recorded from a DRG neuron isolated from a rat with a ligated femoral artery, and the corresponding numbered current traces are shown in Fig. 6D. The neuron was exposed initially to 0.03 μM DAMGO, and the Ca2+ current was blocked by ∼28% (trace c). Similarly, application of 3 μM DAMGO resulted in a 60% inhibition (trace g). For both DAMGO concentrations, the currents were also inhibited in a voltage-dependent manner.
Fig. 6.
Time courses of Ca2+ current amplitude for prepulse and postpulse acquired from the sequential application of 0.03 and 3 μM DAMGO in acutely isolated DRG neurons from rats with freely perfused (A) and 72 h-ligated femoral arteries (C). The currents were obtained from DiI-labeled and EGFP-expressing neurons and were evoked every 10 s with the double-pulse voltage paradigm (4B, top). A and C: the lowercase letters represent current traces shown to the right (B and D, respectively). A, inset: an 8-methyl-N-vanillyl-6-nonenamide [capsaicin (cap); 1 μM]-induced current, where the neuron was held at −80 mV, and capsaicin was applied for 30 s (denoted by filled bar).
The DAMGO concentration-response curves for freely perfused and ligated groups are illustrated in Fig. 7. The pooled data points for both groups were fit to the Hill equation: I = IMAX/{1 + (IC50/[ligand])nH}, where I is the percent inhibition, IMAX is the maximum current inhibition, IC50 is the half-inhibition concentration, [ligand] is the agonist concentration, and nH is the Hill coefficient. The mean (±SE) IMAX and IC50 (nM) values for the freely perfused and occluded groups were 47.4 ± 3.7 and 66.2 ± 3.9 and 283 and 146, respectively. The fits for both groups showed that they were significantly (P = 0.0007) different from each other. These results indicate that the 72-h femoral occlusion altered morphine's pharmacological profile, leading to a greater potency and efficacy of DiI-labeled and EGFP-expressing neurons.
Fig. 7.
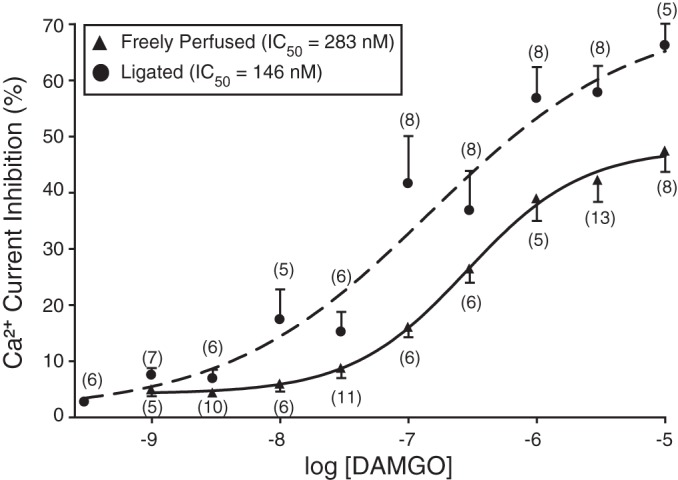
DAMGO concentration-response relationships of DRG neurons from rats with freely perfused (▲) and 72 h-ligated (•) femoral arteries (see Fig. 6 legend for details). Each data point represents the mean (±SE) prepulse Ca2+ current inhibition; the numbers in parentheses indicate the number of neurons that was tested. The smooth curves were obtained by fitting the data points to the Hill equation, and the calculated IC50 values are shown in the figure key.
During the acquisition of the DAMGO concentration-response curves, the TRPV1 agonist, capsaicin (1 or 10 μM), was applied to some (52 of 73 total neurons) of the DRG neurons at the end of each experiment for both groups. Thereafter, capsaicin-induced currents were recorded while maintaining the holding potential at −80 mV. From a total of 52 DRG neurons tested, capsaicin-induced currents were observed in all neurons tested. Figure 6A shows a capsaicin (1 μM)-activated inward current of a DRG neuron isolated from a rat with a freely perfused artery. This finding suggests that DRG neurons innervating the triceps surae muscle coexpress TRPV1 channels, MOR, and presumably NaV1.8 channels.
The arterial occlusion-induced leftward shift of the DAMGO concentration-response curve suggested that upregulation of one or more of the signaling proteins involved in the MOR:Ca2+ channel signaling pathway occurred. The enhanced coupling of MOR with Ca2+ channels could have resulted from an overexpression of these channels. Figure 8A shows a scatter plot of the Ca2+ current density of all DRG neurons tested for both groups. A statistical comparison of both groups revealed no significant difference (P = 0.60). In addition, the scatter plot of the cell capacitance (Fig. 8B) indicates that Ca2+ currents were obtained from DRG neurons that were comparable in size and not significantly (P = 0.58) different. Another possibility for the leftward shift may have been a change in the fraction of Ca2+ channel subtypes in DRG neurons from ligated rats. In a previous report (Ramachandra et al. 2013), we showed that N- and P/Q-type Ca2+ channels account for ∼50% and 20%, respectively, of the total Ca2+ current in this neuron subtype. Thus in the next set of experiments, peak Ca2+ currents were recorded from DiI-labeled and EGFP-expressing DRG neurons before and after application of ω-conotoxin GVIA (10 μM; N-type channel blocker) and ω-agatoxin IVA (0.2 μM; P/Q-type channel blocker). Figure 8C is a summary plot illustrating the mean (±SE) peak Ca2+ current block (%) mediated by both toxins in both groups of neurons. Similar to our previous observations, both N- and P/Q-type Ca2+ channel subtypes contributed >60% of the total Ca2+ current. In addition, the results show that there was no significant change in either contribution of N-type (P = 0.74) or P/Q-type (P = 0.33) channel subtypes between both sets of DRG neurons. Therefore, the change of the DAMGO pharmacological profile following arterial occlusion did not result in either a higher expression of Ca2+ channels or alteration in the proportion of N- and P/Q-type Ca2+ channels.
Fig. 8.
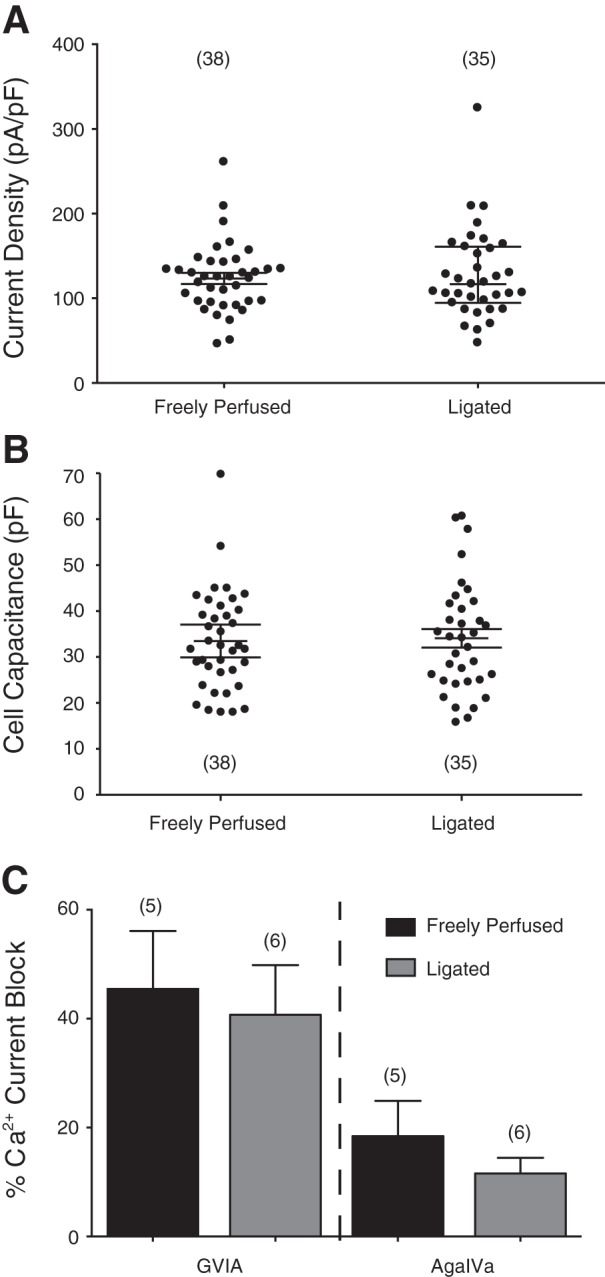
A and B: summary scatter plots of Ca2+ current density (pA/pF) and membrane capacitance (pF) in acutely isolated DiI-labeled and EGFP-expressing DRG neurons from rats with freely perfused and 72 h-ligated femoral arteries. Current density was calculated from the peak Ca2+ current amplitude normalized to membrane capacitance. The lines on the plots indicate the means (±SE), and the numbers in parentheses indicate the number of neurons tested. C: summary plot of the mean (±SE) Ca2+ current inhibition produced by the N (ω-conotoxin GVIA; 10 μM)- and P/Q [ω-agatoxin IVA (AgaIVa]; 0.2 μM)-type Ca2+ channel blockers in DRG neurons from freely perfused and ligated rats. The number of cells tested is indicated in parentheses.
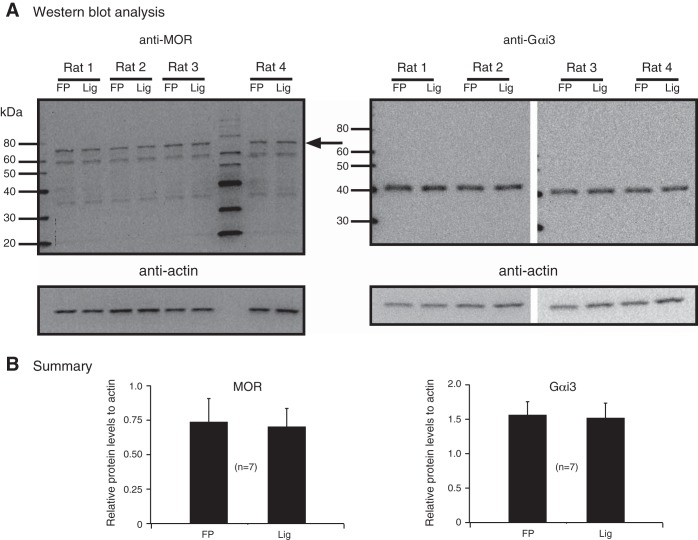
In the final set of experiments, Western blotting assays were used to determine whether MOR or Gαi3 expression was altered in DRG neurons from occluded arteries and could explain the leftward shift of the DAMGO concentration curve. Thus seven rats had their left femoral arteries ligated for 72 h, and then, the DRG tissue was isolated. The DRG from freely perfused legs served as controls. We have shown recently that the pressor and cardioaccelerator responses to static contraction in sham-operated rats are not significantly different than those from rats with freely perfused sides (Copp et al. 2014). Figure 9A shows the Western blots used for detecting MOR and Gαi3 levels from four rats. The results summarized in Fig. 9B indicated that occlusion of the femoral arteries did not lead to significant changes in MOR or Gαi3 levels. It should be noted, however, that the relative levels of MOR to actin were lower than the relative levels of Gαi3 to actin. Therefore, the enhanced responses of the DRG from animals with occluded arteries are likely a result of changes in other signaling proteins (discussed below).
Fig. 9.
A: detection of MOR and Gαi3 expression by Western blot analysis in DRG tissue isolated from rats with freely perfused (FP) and ligated (Lig) femoral arteries. The MOR and Gαi3 lanes were loaded with 25 and 15 μg protein, respectively. The blots show the results for anti-MOR, -Gαi3, and -actin (loading control) from 4 rats. The lines/numbers to the left of the blots indicate the approximate molecular weight (kDa), and the arrow to the right of the MOR blot points to the approximate molecular weight of MOR (see text for details). B: summary plot illustrates the analysis of the blots for MOR, Gαi3, and actin, which was performed by measuring the area density (i.e., intensity) and then plotting the ratio of either the MOR or Gαi3 subunit to its respective actin value. The values represent the means (±SE).
DISCUSSION
The afferent limb of the exercise pressor reflex is comprised of group III and IV muscle afferents that are activated by metabolic and mechanical stimuli originating from the contracting muscle. In the present study, we began to identify the signal transduction elements that couple MOR and Ca2+ channels in a defined subpopulation of DRG neurons involved in this reflex. We focused our attention on acutely isolated, DiI-labeled DRG neurons innervating the triceps surae muscle and microinjected with cDNA coding for EGFP whose expression is driven by the TTX-resistant NaV1.8 promoter region. Our results indicate that in DRG tissue, the Gαi/O PTX-sensitive Gαi2 and Gαi3 proteins are natively expressed, whereas both GαO and Gαi1 were not detected. Unlike our results, one report has shown that in rat DRG, all PTX-sensitive Gα proteins are natively expressed (Hall et al. 2001). In regard to that study, it should be noted that an antibody common to both Gαi1 and Gαi2 was used. It is possible that only detection of Gαi2 by the antibody occurred. Alternatively, the Western blot assays were performed with both lumbar and thoracic DRG tissue, whereas in the present study, we focused on L4–L6 DRG. Therefore, it is possible that the use of different neuronal tissue may help explain this discrepancy.
Our finding that GαO subunits are not natively expressed in DRG neurons should be noted. In the present study, we used two different antibodies. The first was a mouse monoclonal raised against both GαO splice variants, and the second was a rabbit polyclonal raised against residues surrounding arginine 15 of human GαO. The latter antibody produced inconsistent results—from absent to scarcely visible. Since this G protein subunit is highly expressed in the brain (Sternweis and Robishaw 1984), we used brain tissue as a positive control and obtained successful detection (Fig. 2). Nevertheless, some reports have shown that GαO subunits are used by MOR and couple to Ca2+ channels. For example, two studies reported that dialyzing antibodies specific for GαO and Gαi1–3 in the patch pipette removed the MOR (Moises et al. 1994)- and kappa opioid receptor (Wiley et al. 1997)-mediated Ca2+ current inhibition in rat DRG neurons that were only exposed to GαO antibodies. The latter report showed expression of GαO subunits in thoracic DRG. To eliminate the possibility of GαO involvement in this pathway, we compared coupling of MOR with Ca2+ channels in scrambled- and GαO siRNA-transfected DRG neurons. The DAMGO-mediated Ca2+ current inhibition was not significantly different (P = 0.72) for both groups of neurons (59.9 ± 3.8%, n = 13, scrambled vs. 57.7 ± 5.1%, n = 9, GαO siRNA; data not shown). Thus it appears that the discrepant results may result from the DRG population studied (i.e., thoracic) and/or the assays used.
The results of our experiments reveal that following Gαi3 subunit knockdown, the coupling efficiency between DAMGO-stimulated MOR and Ca2+ channels was significantly attenuated, whereas Gαi2 silencing was without effect. However, studies in the Garzón laboratory (Sánchez-Blázquez et al. 1999, 2001) found that the silencing of individual Gα subunits via intracerebroventricular injection of antisense oligodeoxynucleotides led to a selective loss of opioid agonist-mediated supraspinal antinociception. For example, Gαi2, GαZ, or Gαq/11 knockdown significantly attenuated the DAMGO-mediated antinociception in the tail-flick assay. On the other hand, morphine's antinociception was diminished following Gαi2 and GαZ knockdown. The observations with the tail-flick assays by Garzón and colleagues (Sánchez-Blázquez et al. 1999, 2001) suggest that the Gα proteins play a number of key roles that modulate neurotransmission along nociceptive signaling pathways. The differences observed between opioid agonists and signaling moieties used have given rise to the concept of “functional selectivity” or “biased agonism” [for review, see Raehal et al. (2011) and Williams et al. (2013)]. The term is used to explain how different agonists are capable of activating different (“preferential”) signaling pathways over others to produce a different response. Nevertheless, our results indicate that DRG neurons, which innervate triceps surae muscles and express EGFP (under control of the putative NaV1.8 promoter), primarily use Gαi3 proteins to couple MOR with Ca2+ channels.
Intermittent claudication is a typical symptom associated with PAD that encompasses leg pain during exercise. After identifying Gαi3 as a key component involved in opioid modulation of Ca2+ currents, we examined the effects of arterial occlusion on this transduction pathway. Our results indicate that arterial occlusion led to an alteration of the DAMGO pharmacological profile (i.e., potency and efficacy; Fig. 7). The IC50 value that we determined for DRG neurons from the freely perfused group was comparable with those reported previously in DRG (Walwyn et al. 2009) and trigeminal ganglion neurons (Borgland et al. 2001). We previously observed in rats that DAMGO exerted a significantly greater inhibitory effect on the exercise pressor reflex in limbs with ligated arteries than freely perfused limbs (Tsuchimoto et al. 2010). Thus coupled to the findings of the present study, the leftward shift of the DAMGO concentration-response curve (greater potency) suggests that it is possible that patients with PAD would require a lower effective opiate dose to reduce the exercise-induced sympathetic response than matched controls without claudication.
We investigated whether the shift of the DAMGO potency and efficacy following occlusion was a result from changes in Ca2+ channel, Gαi3, or MOR expression levels. Arterial occlusion has been shown to lead to an augmented, sympathetic response of the ischemic leg, which appears to result from an upregulation of acid-sensing ion channel 3 (Liu et al. 2010). Therefore, we hypothesized that the shift in DAMGO pharmacology could be mediated by an upregulation in Ca2+ channel expression. In this DRG neuron subpopulation, we reported recently that N-type Ca2+ channels (CaV2.2) carry the majority of the Ca2+ current (Ramachandra et al. 2013). Based on the current density measurements, no difference in Ca2+ current density between freely perfused and ligated animals was observed. We also explored the possibility that changes in Ca2+ channel subtype (i.e., a switch in preferential coupling of MOR with N- and P/Q-type) would explain the pharmacological shift. However, when both groups of DRG neurons were exposed to specific Ca2+ channel blockers, the contribution of N- and P/Q-type Ca2+ channels to the entire Ca2+ current was unchanged. Therefore, the absence of an increase in Ca2+ channel expression or shift in channel subtype expression could not explain the augmented DAMGO response.
Previous studies that have examined Ca2+ channel modulation by DAMGO in sensory neurons have sorted the cells based on size, lectin binding, and presence or absence of T-type Ca2+ channels. The capacitance values, a measure of cell size, measured in the present study for both group of neurons, were not significantly different. Furthermore, a previous study suggested that there was no clear correlation between cell body size and afferent fiber type (i.e., groups III and IV) (Hoheisel and Mense 1987). Our findings in the present study are also consistent with this report and suggest that occlusion did not affect the neurons' size. However, in guinea pig DRG neurons, substance P immunoreactivity was observed primarily in small-diameter neurons (Lawson et al. 1997). On the other hand, not all nociceptive neurons were substance P immunoreactive.
Our Western blotting analysis of DRG tissue provided evidence that neither MOR nor Gαi3 expression levels increased significantly as a result of arterial occlusion. Limited information is available regarding the effects of femoral occlusion on MOR or G protein function. However, one recent study demonstrated that the DAMGO-mediated stimulation of MOR, expressed in group III and IV afferents, attenuated the femoral occlusion-mediated, augmented exercise pressor reflex (Tsuchimochi et al. 2010). Additionally, in cats, MOR activation lessened the increases in heart rate and blood pressure during static muscle contraction and passive stretch (Hill and Kaufman 1990; Meintjes et al. 1995). These reports emphasize a critical role played by MOR in regulating exercise pressor reflex. Nevertheless, the small changes in MOR and Gαi3 expression levels that we obtained are difficult to reconcile with the significant shift with DAMGO. One possible explanation is that the Western blotting assays were performed with the entire tissue, which includes both glia and a mixture of sensory neurons. The electrophysiological experiments were conducted on a defined subset of neurons. Thus the contribution of each neuron type to the Western blot assay cannot be determined. An alternative explanation is that another signaling protein may have changed as a result of occlusion. One likely candidate(s) is known as regulators of G protein signaling (RGS), a family with ∼20 members (Sjogren 2011). For instance, RGS4 protein overexpression has been recently reported to suppress the efficacy of the muscarinic receptor agonist pilocarpine in an electrophysiological assay (Chen et al. 2014). Furthermore, expression of RGS2 has been reported to be upregulated in a model of ischemia (Endale et al. 2010). Further studies are needed to determine which RGS protein family member is affected by femoral occlusion.
The TRPV1 is a ligand-gated, nonselective cation channel. TRPV1 channels are mainly expressed in small nociceptive DRG neurons (Greffrath et al. 2003) and have been demonstrated to mark group IV afferent fibers (Michael and Priestley 1999). In this study, we also observed that all DRG neurons exposed to capsaicin (1–10 μM) exhibited an inward current. This suggests that the DiI-labeled and EGFP-expressing neurons studied are likely to be involved in pain perception.
In summary, we have shown that we can successfully isolate and study signaling events of a defined subpopulation of DRG neurons that innervate the triceps surae and likely express the NaV1.8 channel. With the use of an siRNA approach, we determined that MOR and Ca2+ channels are coupled specifically by PTX-sensitive Gαi3 proteins. Furthermore, hindlimb muscle ischemia significantly enhanced the DAMGO-mediated Ca2+ current inhibition in this neuron subset. The altered DAMGO pharmacology did not result from increases in either MOR or Gαi3 expression levels or in significant changes in Ca2+ current density or channel subtype expression.
GRANTS
Support for this work was provided by the National Institute of Arthritis and Musculoskeletal and Skin Diseases (grant AR-059397) as well as the National Heart, Lung, and Blood Institute (grant HL-096570).
DISCLOSURES
The authors declare no potential conflicts of interest, financial or otherwise.
AUTHOR CONTRIBUTIONS
Author contributions: M.F., M.P.K., and V.R-V. conception and design of research; B.H., J.S.K., M.F., and V.R-V. performed experiments; B.H., J.S.K., M.F., and V.R-V. analyzed data; M.F. and V.R-V. interpreted results of experiments; V.R-V. prepared figures; B.H., M.F., and V.R-V. drafted manuscript; M.F., M.P.K., and V.R-V. edited and revised manuscript; B.H., J.S.K., M.F., M.P.K., and V.R-V. approved final version of manuscript.
ACKNOWLEDGMENTS
The authors thank Jonathan Derr for technical assistance with QRT-PCR assays and Dr. Henry L. Puhl III (NIAAA, NIH) for helpful advice with the Western blotting experiments.
REFERENCES
- Akopian AN, Sivilotti L, Wood JN. A tetrodotoxin-resistant voltage-gated sodium channel expressed by sensory neurons. Nature 379: 257–262, 1996. [DOI] [PubMed] [Google Scholar]
- Bakke EF, Hisdal J, Jørgensen JJ, Kroese A, Stranden E. Blood pressure in patients with intermittent claudication increses continuously during walking. Eur J Vasc Endovasc Surg 33: 20–25, 2007. [DOI] [PubMed] [Google Scholar]
- Borgland SL, Connor M, Christie MJ. Nociceptin inhibits calcium channel currents in a subpopulation of small nociceptive trigeminal ganglion neurons in mouse. J Physiol 536: 35–47, 2001. [DOI] [PMC free article] [PubMed] [Google Scholar]
- Chen IS, Furutani K, Inanobe A, Kurachi Y. RGS4 regulates partial agonism of the M2 muscarinic receptor-activated K+ currents. J Physiol 592: 1237–1248, 2014. [DOI] [PMC free article] [PubMed] [Google Scholar]
- Coggeshall RE, Zhou S, Carlton SM. Opioid receptors on peripheral sensory axons. Brain Res 764: 126–132, 1997. [DOI] [PubMed] [Google Scholar]
- Coote JH, Hilton SM, Perez-Gonzalez JF. The reflex nature of the pressor response to muscular exercise. J Physiol 215: 789–804, 1971. [DOI] [PMC free article] [PubMed] [Google Scholar]
- Copp SW, Stone AJ, Yamauchi K, Kaufman MP. Effects of peripheral and spinal κ-opioid receptor stimulation on the exercise pressor reflex in decerebrate rats. Am J Physiol Regul Integr Comp Physiol 307: R281–R289, 2014. [DOI] [PMC free article] [PubMed] [Google Scholar]
- Endale M, Kim SD, Lee WM, Kim S, Suk K, Cho JY, Park HJ, Wagley Y, Kim S, Oh JW, Rhee MH. Ischemia induces regulator of G protein signaling 2 (RGS2) protein upregulation and enhances apoptosis in astrocytes. Am J Physiol Cell Physiol 298: C611–C623, 2010. [DOI] [PubMed] [Google Scholar]
- Goldstein A, Naidu A. Multiple opioid receptor: ligand selectivity profiles and binding site signatures. Mol Pharmacol 36: 265–272, 1989. [PubMed] [Google Scholar]
- Greffrath W, Binzen U, Schwarz ST, Saaler-Reinhardt S, Treede RD. Co-expression of heat sensitive vanilloid receptor subtypes in rat dorsal root ganglion neurons. Neuroreport 14: 2251–2255, 2003. [DOI] [PubMed] [Google Scholar]
- Hall KE, Liu J, Sima AA, Wiley JW. Impaired inhibitory G-protein function contributes to increased calcium currents in rats with diabetic neuropathy. J Neurophysiol 86: 760–770, 2001. [DOI] [PubMed] [Google Scholar]
- Hassan B, Ruiz-Velasco V. The κ-opioid receptor agonist U-50488 blocks Ca2+ channels in a voltage- and G protein-independent manner in sensory neurons. Reg Anesth Pain Med 38: 21–27, 2013. [DOI] [PMC free article] [PubMed] [Google Scholar]
- Hill JM, Kaufman MP. Attenuation of the reflex pressor and ventilator responses to static muscular contraction by intrathecal opioids. J Appl Physiol 68: 2466–2472, 1990. [DOI] [PubMed] [Google Scholar]
- Hoheisel U, Mense S. Observations on the morphology of axons and somata of slowly conducting dorsal root ganglion cells in the cat. Brain Res 423: 269–278, 1987. [DOI] [PubMed] [Google Scholar]
- Ikeda SR. Double-pulse calcium channel current facilitation in adult rat sympathetic neurons. J Physiol 439: 181–214, 1991. [DOI] [PMC free article] [PubMed] [Google Scholar]
- Kaufman MP, Longhurst JC, Rybicki KJ, Wallach JH, Mitchell JH. Effects of static muscular contraction on impulse activity of groups III and IV afferents in cats. J Appl Physiol 55: 105–112, 1983. [DOI] [PubMed] [Google Scholar]
- Lawson SN, Crepps BA, Perl ER. Relationship of substance P to afferent characteristics of dorsal root ganglion neurons in guinea-pig. J Physiol 505: 177–191, 1997. [DOI] [PMC free article] [PubMed] [Google Scholar]
- Liu J, Gao Z, Li J. Femoral artery occlusion increases expression of ASIC3 in dorsal root ganglion neurons. Am J Physiol Heart Circ Physiol 299: H1357–H1364, 2010. [DOI] [PMC free article] [PubMed] [Google Scholar]
- Mahmoud S, Yun JK, Ruiz-Velasco V. Gβ2 and Gβ4 participate in the opioid and adrenergic receptor-mediated Ca2+ channel modulation in rat sympathetic neurons. J Physiol 590: 4673–4689, 2012. [DOI] [PMC free article] [PubMed] [Google Scholar]
- Margas W, Sedeek K, Ruiz-Velasco V. Coupling specificity of NOP opioid receptors to pertussis-toxin-sensitive Gα proteins in adult rat stellate ganglion neurons using small interference RNA. J Neurophysiol 100: 1420–1432, 2008. [DOI] [PMC free article] [PubMed] [Google Scholar]
- McCloskey DI, Mitchell JH. Reflex cardiovascular and respiratory responses originating in exercising muscle. J Physiol 224: 173–186, 1972. [DOI] [PMC free article] [PubMed] [Google Scholar]
- Meintjes AF, Nobrega AC, Fuchs IE, Ally A, Wilson LB. Attenuation of the exercise pressor reflex: effect of opioid agonist on substance P release in L-7 dorsal horn of cats. Circ Res 77: 326–334, 1995. [DOI] [PubMed] [Google Scholar]
- Michael GJ, Priestley JV. Differential expression of the mRNA for the vanilloid receptor subtype 1 in cells of the adult rat dorsal root and nodose ganglia and its down regulation by axotomy. J Neurosci 19: 1844–1854, 1999. [DOI] [PMC free article] [PubMed] [Google Scholar]
- Mitchell JH, Kaufman MP, Iwamoto GA. The exercise pressor reflex: its cardiovascular effects, afferent mechanisms, and central pathways. Annu Rev Physiol 45: 229–242, 1983. [DOI] [PubMed] [Google Scholar]
- Moises HC, Rusin KI, MacDonald RL. μ-Opioid receptor-mediated reduction of neuronal calcium current occurs via a GO-type GTP binding protein. J Neurosci 14: 3842–3851, 1994. [DOI] [PMC free article] [PubMed] [Google Scholar]
- Novakovic SD, Tzoumaka E, McGivern JG, Haraguchi M, Sangameswaran L, Gogas KR, Eglen RM, Hunter JC. Distribution of the tetrodotoxin-resistant sodium channel PN3 in rat sensory neurons in normal and neuropathic conditions. J Neurosci 18: 2174–2187, 1998. [DOI] [PMC free article] [PubMed] [Google Scholar]
- Prior BM, Lloyd PG, Ren J, Li H, Yang HT, Laughlin MH, Terjung RL. Time course of changes in collateral blood flow and isolated vessel size and gene expression after femoral artery occlusion in rats. Am J Physiol Heart Circ Physiol 287: H2434–H2447, 2004. [DOI] [PubMed] [Google Scholar]
- Puhl HL, III, Ikeda SR. Identification of the sensory neuron specific regulatory region for the mouse gene encoding the voltage-gated sodium channel NaV1.8. J Neurochem 106: 1209–1224, 2008. [DOI] [PMC free article] [PubMed] [Google Scholar]
- Raehel KM, Schmid CL, Groer CE, Bohn LM. Functional selectivity at the μ-opioid receptor: implications for understanding opioid analgesia and tolerance. Pharmacol Rev 63: 1001–1019, 2011. [DOI] [PMC free article] [PubMed] [Google Scholar]
- Ramachandra R, Hassan B, McGrew SG, Dompor J, Farrag M, Ruiz-Velasco V, Elmslie KS. Identification of CaV channel types expressed in muscle afferent neurons. J Neurophysiol 110: 1535–1543, 2013. [DOI] [PMC free article] [PubMed] [Google Scholar]
- Rush AM, Cummins TR, Waxman SG. Multiple sodium channels and their roles in electrogenesis within dorsal root ganglion neurons. J Physiol 579: 1–14, 2007. [DOI] [PMC free article] [PubMed] [Google Scholar]
- Sánchez-Blázquez P, Gómez-Serranillos P, Garzón J. Agonists determine the pattern of G-protein activation in μ-opioid receptor-mediated supraspinal analgesia. Brain Res Bull 54: 229–235, 2001. [DOI] [PubMed] [Google Scholar]
- Sánchez-Blázquez P, Rodríguez-Díaz DeAntonio I, Garzón J. Endomorphin-1 and endomorphin-2 show differences in their activation of μ opioid receptor-regulated G proteins in supraspinal antinociception in mice. J Pharmacol Exp Ther 291: 12–18, 1999. [PubMed] [Google Scholar]
- Sangamaswaran L, Delgado SG, Fish LM, Koch RD, Jakeman LB, Stewart GR, Sze P, Hunter JC, Eglen RM, Herman RC. Structure and function of a novel voltage-gated tetrodotoxin-resistant sodium channel specific to sensory neurons. J Biol Chem 271: 5953–5956, 1996. [DOI] [PubMed] [Google Scholar]
- Sjogren B. Regulators of G protein signaling proteins as drug targets: current state and future possibilities. Adv Pharmacol 62: 315–347, 2011. [DOI] [PubMed] [Google Scholar]
- Sternweis PC, Robishaw JD. Isolation of two proteins with high affinity for guanine nucleotides from membranes of bovine brain. J Biol Chem 259: 13806–13813, 1984. [PubMed] [Google Scholar]
- Taylor JC, Li Z, Yang HT, Laughlin MH, Terjung RL. alpha-Adrenergic inhibition increases collateral circuit conductance in rats following acute occlusion of the femoral artery. J Physiol 586: 1649–1667, 2008. [DOI] [PMC free article] [PubMed] [Google Scholar]
- Tsuchimochi H, McCord JL, Kaufman MP. Peripheral μ-opioid receptors attenuate the augmented exercise pressor reflex in rats with chronic femoral artery occlusion. Am J Physiol Heart Circ Physiol 299: H557–H565, 2010. [DOI] [PMC free article] [PubMed] [Google Scholar]
- Walwyn W, John S, Maga M, Evans CJ, Hales TG. δ Receptors are required for full inhibitory coupling of μ receptors to voltage-dependent Ca2+ channels in dorsal root ganglion neurons. Mol Pharmacol 76: 134–143, 2009. [DOI] [PMC free article] [PubMed] [Google Scholar]
- Waters RE, Terjung RL, Peters KG, Annex BH. Preclinical models of human peripheral arterial occlusive disease: implications for investigation of therapeutic agents. J Appl Physiol 97: 773–780, 2004. [DOI] [PubMed] [Google Scholar]
- Wiley JW, Moises HC, Gross RA, MacDonald RL. Dynorphin A-mediated reduction in multiple calcium currents involves a GOαα-subtype G protein in rat primary afferent neurons. J Neurophysiol 77: 1338–1348, 1997. [DOI] [PubMed] [Google Scholar]
- Williams JT, Christie MJ, Manzoni O. Cellular and synaptic adaptations mediating opioid dependence. Physiol Rev 81: 299–343, 2001. [DOI] [PubMed] [Google Scholar]
- Williams JT, Ingram SL, Henderson G, Chavkin C, von Zasrow M, Schulz S, Koch T, Evans CJ, Christie MJ. Regulation of μ-opioid receptors: desensitization, phosphorylation, internalization, and tolerance. Pharmacol Rev 65: 223–254, 2013. [DOI] [PMC free article] [PubMed] [Google Scholar]
- Yang HT, Feng Y, Allen LA, Protter A, Terjung RL. Efficacy and specificity of bFGF increased collateral flow in experimental peripheral arterial insufficiency. Am J Physiol Heart Circ Physiol 278: H1966–H1973, 2000. [DOI] [PubMed] [Google Scholar]


