

Abstract
Dynamic contrast-enhanced magnetic resonance imaging (DCE–MRI) is increasingly used to estimate permeability in situations with subtle blood–brain barrier (BBB) leakage. However, the method's ability to differentiate such low values from zero is unknown, and no consensus exists on optimal selection of total measurement duration, temporal resolution, and modeling approach under varying physiologic circumstances. To estimate accuracy and precision of the DCE–MRI method we generated simulated data using a two-compartment model and progressively down-sampled and truncated the data to mimic low temporal resolution and short total measurement duration. Model fit was performed with the Patlak, the extended Tofts, and the Tikhonov two-compartment (Tik-2CM) models. Overall, 17 healthy controls were scanned to obtain in vivo data. Long total measurement duration (15 minutes) and high temporal resolution (1.25 seconds) greatly improved accuracy and precision for all three models, enabling us to differentiate values of permeability as low as 0.1 ml/100 g/min from zero. The Patlak model yielded highest accuracy and precision for permeability values <0.3 ml/100 g/min, but for higher values the Tik-2CM performed best. Our results emphasize the importance of optimal parameter setup and model selection when characterizing low BBB permeability.
Keywords: blood–brain barrier, cerebral hemodynamics, multiple sclerosis, MRI, perfusion-weighted MRI
Introduction
Dynamic contrast-enhanced T1-weighted magnetic resonance imaging (DCE–MRI) was originally developed to estimate the blood–brain barrier (BBB) permeability in multiple sclerosis (MS) lesions and in brain tumors,1, 2 and was later used to estimate capillary permeability in other organs, where permeability is several order of magnitudes higher. In both situations, the so-called Tofts model and the extended Tofts model (eTofts)3 have been used extensively. Recently, it has been shown that if the prerequisites for the use of the Tofts model are not fulfilled or the sampling frequency is too low, severe errors in the estimated parameters will occur even when model fit to data seems perfect.4, 5 We have previously used the Patlak method6 with the aim of estimating the BBB permeability from DCE–MRI data.7 The low permeability and hence low likelihood of back-diffusion (transport of contrast agent from tissue back to blood) are ideal prerequisites for the use of the Patlak method. Using simulations we showed that the Patlak method correctly estimated permeability if it was <3 ml/100 g/min (Ktrans∼0.015 per minute). For higher values of permeability, which is encountered in a number of pathologic conditions, a full two-compartment modeling approach was necessary to estimate the BBB permeability correctly.
Generally, DCE–MRI data sampling frequency has been low, typically in the order of 10 to several hundred seconds, mainly because high sampling frequency is not compatible with the necessary spatial image resolution and general image quality, resulting in under sampling of the arterial input function and the tissue enhancement curve. This is likely the reason that brain perfusion is normally not estimated using DCE–MRI because reliable estimates of perfusion based on an intravascular first-pass bolus passage, is hampered by such a low sampling frequency and also by the fact that a pure intravascular contrast agent does not enhance the T1-weighted MR signal sufficiently at a typical field strength of 1.5 T.8 However, at higher field strength, e.g. 3 T, the intravascular MR signal enhancement during the bolus passage of a contrast agent is clearly detectable. We and others have previously shown that realistic perfusion values can be obtained with DCE–MRI at 3 T, using a high sampling frequency of ∼1 to 5 seconds, where at least 1 second is normally considered fast enough to capture the fastest components of the contrast agents through the capillary bed.9, 10, 11, 12 The total data sampling duration can be left short in the case of perfusion estimation, because one in principle only needs to monitor the wash-in of a contrast agent in the tissue together with the corresponding input function. In our previous implementation we monitored the contrast bolus passage and washout phase over a period of 5 minutes. Logically, we also wanted to estimate the BBB permeability from the same bolus passage, and the Patlak method was chosen, because we expected low permeability and negligible back-diffusion over a relative short measurement of 5 minutes. Using this method, we found that the BBB permeability in apparently healthy tissue in tumor patients was not zero, as normally assumed. Values obtained in gray and white brain tissue were in the order of (Ki) 0.8 ml/100 g/min (=0.008 per minute assuming a tissue density of 1 g/ml).7 However, these values were estimated without partial volume correction of the arterial input function with the venous signal from the sagittal sinus, which has later become a widely accepted approach.13 Another study suggested that a short sampling duration of 5 minutes was not long enough, for an accurate estimate of a very low permeability, such as BBB permeability.14
No previous study has looked into the required total measurement time and sampling frequency in case of slightly increased permeability as encountered in healthy brain tissue or in brain diseases, such as MS, infarctions or benign brain tumors. So far no studies have validated the methods employed and a gold standard is non-existing. Therefore, the aim of this study was to explore the optimal conditions required for accurate estimation of low permeability with regard to total measurement time and sampling frequency. We also wanted to explore and compare the performance of (1) the Patlak model, (2) the eTofts model, and (3) our newly proposed method of combining a model-free estimation of perfusion and the two-compartment model, from which permeability can be estimated. To this end we used both simulation and actual measurements on healthy volunteers and patients with visibly contrast-enhancing brain lesions. Ultimately, we wanted to estimate the lowest measurable permeability significantly different from zero, when using a conventional MR contrast agent.
Materials and methods
Simulation
Simulated data were generated using a two-compartment model having a biexponential residue impulse response function with four free parameters:7, 15 perfusion (F), unidirectional transfer constant (Ki=Ktrans/(1−Hct)), blood volume (Vb=Vp/(1−Hct)) and extravascular extracellular volume (Ve). Simulated tissue curves (Ct(t)) were generated by convolving this residue impulse response function with a typical arterial input function (Ca(t)) obtained in vivo. Random generated noise was added to the curves, so signal to noise (S/N) and contrast to noise (C/N) were equivalent to the noise levels observed in vivo. Here S/N is defined as mean baseline tissue signal before contrast divided by s.d. of the baseline, and C/N is defined as the peak signal minus mean baseline signal divided by s.d. of the baseline before contrast appears. Contrast to noise was set to a factor of 8 and 16 for white and gray matter, respectively, based on real subject measurements of single voxels. Various combinations of the free parameters were used: (F;Vb)=(20 ml/100 g/min; 2 ml/100 g), (F;Vb)=(50 ml/100 g/min; 3 ml/100 g), (80 ml/100 g/min; 6 ml/100 g), Ki=0 to 10 ml/100 g/min, Ve=20 ml/100 g. Tissue curves and input function were down-sampled from a high time resolution (1.25 seconds) to a time resolution of 2.4, 3.6, 4.8, and 6 seconds, to investigate the effect of a progressively lower temporal resolution. This was performed by averaging 2, 3, 4, or 5 points into one point, such that no data information was discarded and effectively improving the S/N ratio as the time resolution decreased. This was performed to illustrate that dynamic uptake with a lower time resolution typically benefit from a higher S/N than dynamic uptake with a higher time resolution. A time resolution of ∼1 second is considered ideal (we used 1.25 seconds), as this is fast enough to also estimate perfusion. Original total sampling duration (ΔT) was 15 minutes and a total sampling duration of 5 minutes was created by data truncation. For each set of parameters 1,000 repetitions were performed.
Healthy Volunteers and Patients
For in vivo data we enrolled 17 healthy controls (10 females; mean age 33 (s.d. 10) years, who did not have any first-degree relatives with MS, have any inflammatory diseases or frequent migraine attacks (>1 per month). To study permeability in visibly contrast-enhancing brain lesions we included five patients, four with MS and one with optic neuritis referred from the MS clinic at Glostrup Hospital, with a total of eight visibly contrast-enhancing lesions. The four MS patients received immunomodulatory treatment at time of investigation, whereas the patient with optic neuritis received no medical treatment. None of the patients had been treated with corticosteroids within 30 days before investigation.
Ethics
This study was approved by the Ethics Committee of Copenhagen County according to the standards of The National Committee on Health Research Ethics, protocol number H-D-2008-002. All experiments were conducted in accordance with the Declaration of Helsinki 1975 and all subjects gave written informed consent.
Dynamic Contrast-Enhanced MRI
Magnetic resonance imaging was performed on a 3T MR unit (Philips Achieva, Best, The Netherlands) using a 32-element phased-array head coil. Dynamic contrast-enhanced imaging used a previously described7, 11 T1-weighted saturation-recovery gradient-echo sequence that was used both for the initial T1 measurement and for the subsequent dynamic imaging. Each slice was acquired after application of a nonselective saturation prepulse with a saturation time delay. Echoes were read with a radiofrequency flip angle of 30°, pulse repetition time of 3.82 milliseconds, echo time of 1.9 milliseconds, centric phase ordering, scan matrix size 96 × 61 (interpolated to 256 × 256), SENSE factor 2, field-of-view 230 × 182 mm2, and five slices of 8-mm thickness with a slice gap of 3 mm, resulting in a spatial resolution of 2.5 × 3.1 × 8 mm3. Data for an initial measurement of relaxation time (T1) and equilibrium magnetization (M0) were generated using a series of saturation time delays from 120 milliseconds to 10 seconds, covering the same slices as imaged during the bolus passage. The dynamic sequence used a saturation time delay of 120 milliseconds, giving a time resolution of 1.25 seconds, and 750 time points, corresponding to a total sampling duration 15.7 minutes. The automatic bolus injection (Spectris, Medrad, Indianola, PA, USA) with speed 3 to 5 ml/sec followed by 20 ml saline was started after the 10th time point. Injection duration was ∼1 second. The dose of contrast agent (Gadovist, Beyer AG, Germany) was 0.045 mmol/kg bodyweight. We acquired a separate slice at the level of the internal carotid artery to obtain an arterial input function with minimal partial volume. The remaining four DCE slices were used for defining regions of interest (ROIs) and subsequent tissue perfusion estimation. To evaluate the scanner drift on our system over time we performed a series of sham perfusion measurements (same DCE sequence without contrast agent) and found a linear signal increase over 15 minutes in the order of 1% to 3%. This signal increase was within the uncertainty of our in vivo Ki estimations, thus only having minor effect on the results.
Permeability Estimation
DCE–MRI data were analyzed with a semi-automatic procedure using in-house created MatLab-based Software (MathWorks, Natick, MA, USA). The DCE time series was converted to units of contrast agent concentration using T1 and M0, as determined from the multiple saturation delay data, and a contrast agent relaxivity of 4/sec/mmol/l. The input function was measured in the voxel in the internal carotid artery with maximal signal change during the bolus passage and corrected for partial volume by normalizing to a venous outflow function sampled from the sagittal sinus, as described previously.13 To extract values of Ki, cerebral blood volume and cerebral blood flow, one ROI was placed in the basal ganglia and one ROI was placed in the frontal white matter in 17 healthy subjects. This was performed on an axial T2-weighted MRI sequence (five slices, echo time=100 milliseconds, repetition time=3,000 milliseconds, and field-of-view=230 × 119 mm2) with same orientation and slice thickness (8 mm) as our DCE sequence. The ROIs were analyzed pixel wise and averaged within the individual ROI having a size of ∼100 pixels. Visibly contrast-enhancing lesions were identified in patients with MS and optic neuritis. Visibly contrast-enhancing lesions were defined as a hyperintensity on a postcontrast T1-weighted image corresponding to a T2-hyperintense lesion, >3 mm in size with a typical anatomic location for MS, i.e. periventricular, juxtacortical, or infratentorial. An experienced MS investigator performed this procedure manually. One or two ROIs, ∼100 pixels size were also placed inside the lesion, and analyzed in a similar way as in healthy controls. Values of Ki are reported as ml/100 g/min assuming brain tissue density of 1 g/ml.
Generated tissue concentration curves from the simulation and real in vivo obtained data using DCE–MRI were evaluated using the Patlak model6 having the equation:
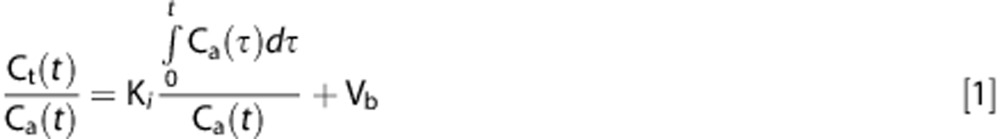 |
where the slope and the intercept gives Ki and Vb, respectively, in a Patlak plot. The necessary prerequisite for this model to be true is that the tracer is trapped ‘irreversibly', meaning that significant back-diffusion from tissue to blood does not occur during the measuring period. For diffusion limited transport, as is the case here, Ki is equal to the permeability surface area product. Tissue curves were also evaluated using the eTofts model:
 |
In this case, Ki, Vb, and Ve constitute the free parameters to be estimated. In this model back-diffusion from tissue to blood is allowed. Further requirement for this model are (1) instantaneous mixing of the tracer in the interstitial compartment, (2) escape is only possible via blood, and (3) loss of tracer from blood to tissue should be insignificant, so the intravascular contrast concentration at all time points can be approximated by the arterial input function. Finally, as it has been pointed out lately (4) significant broadening during the vascular transit should not occur.4 For low permeability and in excess of tracer in the vascular system, the resulting Ki can also be interpreted as the permeability surface area product.
If the two last criteria are not met, a two-compartment model might be more suitable. A two-compartment model incorporates a loss of a tracer from the vascular system and in addition takes a significant intravascular transit time in account. However, a two-compartment model has twice as many free parameters to fit compared with a one-compartment model, resulting in a decrease in the accuracy and precision of the parameter estimates. Therefore, reducing the number of fitted parameters and optimal initialization of the free parameters entering the fitting routine is essential to achieve a robust and accurate result. In a previous study,11 we suggested to estimate the perfusion (F) from model-free deconvolution of the tissue concentration with the arterial input function, and then passing this value as a fixed value to the two-compartment model, reducing the number of the free parameters then to be estimated. Perfusion estimation is performed using Tikhonov's deconvolution, which is a general form of singular value decomposition having a regularization term.11 Optimal initialization of Ki and Vb is derived from a Patlak analysis, parsing these values as free parameters, together with Ve (initialized to 20 ml/100 g) to the two-compartment fitting procedure (Tik-2CM).
In this study, we present a detailed analysis and comparison of the feasibility of these three different methods to accurately estimate low values of permeability as encountered in healthy or apparently healthy brain tissues.
Results
Figures 1, 2, 3 show results of the Ki simulation: estimated Ki as a function of true Ki for the different methods under different conditions, in the interval 0 to 0.5 ml/100 g/min, with perfusion set to 20, 50, and 80 ml/100 g/min, respectively. Figures 4 and 5 shows the same but for the Ki interval 1 to 10 ml/100 g/min and perfusion set to 20 and 80 ml/100 g/min.
Figure 1.

F=20 ml/100 g/min; Vb=2 ml/100 g/min. Estimated Ki (y-axis) based on 1,000 simulations plotted against true Ki (x-axis). Dotted line represents the identity line. Vertical full lines represent the precision of the measurement (s.d. 2). eTofts, extended Tofts model; F, cerebral blood flow; Ki, permeability; Tik-2C, Tikhonov two-compartment model; Vb, cerebral blood volume.
Figure 2.

F=50 ml/100 g/min; Vb=3 ml/100 g/min. Estimated Ki (y-axis) based on 1,000 simulations plotted against true Ki (x-axis). Dotted line represents the identity line. Vertical full lines represent the precision of the measurement (s.d. 2). eTofts, extended Tofts model; F, cerebral blood flow; Ki, permeability; Tik-2C, Tikhonov two-compartment model; Vb, cerebral blood volume.
Figure 3.

F=80 ml/100 g/min; Vb=6 ml/100 g/min. Estimated Ki (y-axis) based on 1,000 simulations plotted against true Ki (x-axis). Dotted line represents the identity line. Vertical full lines represent the precision of the measurement (s.d. 2). eTofts, extended Tofts model; F, cerebral blood flow; Ki, permeability; Tik-2C, Tikhonov two-compartment model; Vb, cerebral blood volume.
Figure 4.

F=20 ml/100 g/min; Vb=2 ml/100 g/min. Estimated Ki (y-axis) based on 1,000 simulations plotted against true Ki (x-axis). Dotted line represents the identity line. Vertical full lines represent the precision of the measurement (s.d. 2). eTofts, extended Tofts model; F, cerebral blood flow; Ki, permeability; Tik-2C, Tikhonov two-compartment model; Vb, cerebral blood volume.
Figure 5.

F=80 ml/100 g/min; Vb=6 ml/100 g/min. Estimated Ki (y-axis) based on 1,000 simulations plotted against true Ki (x-axis). Dotted line represents the identity line. Vertical full lines represent the precision of the measurement (s.d. 2). eTofts, extended Tofts model; F, cerebral blood flow; Ki, permeability; Tik-2C, Tikhonov two-compartment model; Vb, cerebral blood volume.
Figures 1, 2, 3 show that Tik-2CM is accurate and reproducible when using high time resolution and long total measurement time with no dependency of the perfusion level, and the method is clearly able to differentiate a permeability of 0.1 ml/100 g/min from zero. This is also true for the Patlak method (middle rows), except that a systematic underestimation of the permeability ensues at a permeability of 0.3 ml/100 g/min and higher values. The eTofts method (bottom row) seems acceptable for low perfusion and low blood volume at high sampling frequency and long total measurement time, but gives more unpredictable results as perfusion and blood volume increase. All methods are dependent on time resolution and total measurement duration. For example, the uncertainty of results of the Tik-2C method increases if sample frequency or measurement duration decreases (Figure 3, top row). Either situation results in a doubling of the detection limit of a permeability value significantly different from zero. The eTofts method shows a systematic overestimation as total measurement duration decreases from 15 to 5 minutes, which might be related to lack of information of the elimination phase of the contrast agent. If perfusion and blood volume are low, the eTofts method perform quite well and is not much affected by a reduction of the temporal resolution, as long as the measurement duration is kept sufficiently long.
Results for the Ki interval 1 to 10 ml/100 g/min is shown in Figures 4 and 5. Again, the Tik-2C method shown in the top rows, gives accurate and reproducible results for high sampling frequency (1.2 seconds), but performs bad when sampling frequency is decreased to 5 seconds. The Patlak method results in severe underestimation as expected, while the eTofts method level performs quite well, except for a systematic underestimation of permeability, which is more prominent as perfusion decreases.
In Vivo Generated Data
Figure 6 shows in vivo measurements of Ki, calculated by the three different modeling approaches. Data were obtained over 15 minutes and with a sampling time of 1.25 seconds. Removing the last two-third number of points created a total measurement time of 5 minutes, and a low temporal resolution of 6 seconds was obtained by averaging every five points into one data point (similar as performed in the simulations). Remarkably similar values ∼0.100 ml/100 g/min were found for the three methods for basal gray matter and frontal white matter at highest time resolution of 1.25 seconds. Both the Patlak and Tik-2C methods seem to be affected by a decrease in the time resolution, resulting in a slight increase in estimated permeability and uncertainty, also seen in the simulation. The eTofts method was quite unaffected by changing the time resolution, which is well in line with the simulations. Even though we find above-zero values of permeability in the white matter of healthy controls, no contrast enhancement was visible to the naked eye on postcontrast T1-weighted images.
Figure 6.

Permeability in basal gray matter (left column) and frontal white matter (right column) in 17 healthy controls estimated with Patlak, eTofts, and Tik-2C models with decreasing total measurement duration and time resolution. eTofts, extended Tofts model; Ki, permeability; Tik-2C, Tikhonov two-compartment model.
Figure 7 shows the results of estimating the permeability using the three methods in nine MS lesions showing visible contrast enhancement on postcontrast T1-weighted MRI. For a high time resolution (1.26 seconds), the Patlak method underestimates the permeability, compared with the eTofts and the Tik-2C methods, a situation that is accentuated as permeability increases, as expected. However, this underestimation is attenuated if the measurement duration is reduced from 15 to 5 minutes. The eTofts method is not very sensitive to a reduction of the sample frequency, while the Patlak method and the Tik-2C method both are sensitive to a reduction in this parameter.
Figure 7.

Permeability in eight visibly contrast-enhancing lesions (each line representing one lesion) estimated with Patlak, eTofts, and Tik-2C models with decreasing time resolution and total measurement duration. As true permeability increases, the Patlak model progressively underestimates permeability, hence supporting the findings from our simulations. All enhancing lesions were located in the periventricular region, with a mean area size of 29.3 mm2 (s.d. 21.3 mm2). There was no correlation between area size and permeability values. eTofts, extended Tofts model; Ki, permeability; Tik-2C, Tikhonov two-compartment model.
Discussion
Accurate determination of the BBB permeability might be of importance in certain diseases such as MS or brain tumors. The ability to monitor the permeability over a time course during a treatment trial is obviously beneficial and could strengthen the evaluation procedure of treatment efficacy. In addition, subtle changes of the BBB permeability has been suggested in MS,16, 17, 18 epilepsy,19, 20 Alzheimer's dementia,21, 22 vascular cognitive impairment,23 migraine,24, 25 and cortical spreading depression,26 but in most of these conditions no conclusive evidence has yet been obtained, likely because of difficulties of measuring small changes of the permeability. To our knowledge, no previous study has looked into the methodological requirements for accurate estimation of low permeability as may be encountered in healthy or apparently healthy tissues in the brain. In a broader context, the measurement of BBB permeability might have implications for the study of the pericytes, which are known to govern both the integrity of the BBB as well as the regulation of cerebral blood flow.27
In this study, we have shown that the level of permeability, even in a narrow range just above zero, is of importance for the choice of tracer kinetic model employed to estimate the permeability correctly. In addition, total measurement duration and time resolution has a pronounced impact on the accuracy and precision of obtained results. The three methods give the same results for normal brain tissue in vivo, with a value ∼0.1 ml/100 g/min. From the simulations we see that a true value of this size is determined within a 95% confidence interval of 0.07 to 0.17, 0.05 to 0.15, and −0.01 to 0.4 ml/100 g/min for the Tik-2CM, the Patlak model and the eTofts model, respectively, at a cerebral blood flow level of 50 ml/100 g/min. For higher values of permeability (0.3 ml/100/min), the Patlak method progressively underestimates the true permeability. For a true value of 1 ml/100 g/min, the estimated confidence interval when using the Patlak method is 0.6 to 0.8 ml/100 g/min. Thus, our in vivo results and simulation indicate that when Patlak values are higher than 0.3 ml/100 g/min, the Tik-2CM should be used, giving more accurate results. In a previous study using the Patlak method we suggested that a significant underestimation occurred for a Ki 3 ml/100 g/min and higher values, and we also estimated Ki in apparently healthy brain tissues of tumor patients to 0.8 ml/100 g/min.7 However, these results were based on measurement duration of 5 minutes and furthermore no partial volume correction of the input function was applied, which has since become a generally accepted approach.13 These improvements in methodology allow us to more precisely quantify permeability of the normal BBB in vivo, yielding results that are more in agreement with both previous and recent studies.28, 29 The simulations show that the Patlak method is useful when back-diffusion can be ignored, which is equivalent to a permeability <0.3 ml/100 g/min, and that accuracy and precision profit from a long measurement duration and a high sampling frequency.
Tik-2CM is also very dependent on the time resolution. This is conceivable because the method is based on an initial calculation of perfusion, which is then saved and used unmodified in the two-compartment model, and it is generally accepted that time resolution is pivotal in perfusion estimation, especially when employing intravascular contrast agents. Using long measurement duration and high sampling frequency, the Tik-2C method is the most robust method, showing the highest level of accuracy and precision for the entire range of permeability values investigated, without much dependency on the cerebral blood flow or cerebral blood volume level.
The eTofts model seems to be very dependent on the true permeability, blood volume and measurement conditions, and one should therefore be cautious when using the eTofts method. The eTofts method yields similar results as obtained for the Patlak and Tik-2C methods for normal brain tissue in vivo. However, the simulations indicate that increasing the perfusion to 50 ml/100 g/min and blood volume >3 ml/100 g will result in a marked increase in the uncertainty of results when using the eTofts method (see Figures 1, 2, 3) when compared with the other two methods, and some underestimation occurs for higher levels of permeability (see Figures 4 and 5).
In a previous positron emission tomography study by Iannotti et al28 the BBB permeability in healthy subjects was reported to be 0.03 ml/100 g/min (s.d. 0.008; Ki=0.0003 per minute), which is in good agreement with our in vivo estimates. The positron emission tomography ligand used was 68-Ga-DTPA with a molecular weight of 440.2 Da compared with gadobutrol (Gadovist) used in our study, which has a molecular weight of 604.7 Da. Both substances are hydrophilic. This should make permeability values reasonably comparable. However, it should be stressed that the property and size of the contrast molecule used will affect the pharmacokinetic properties and transfer constants related to the healthy and diseased BBB. In two more recent studies, the BBB permeability measured as Ki was estimated in healthy human subjects using the Patlak method. The first study reported a mean permeability for a conventional MRI contrast agent of 0.013 ml/100 g/min based on measurements on 10 healthy subjects30 and the second study found an upper limit of normal permeability of 0.03 ml/100 g/min23 based on 20 healthy controls. This is in good agreement with our findings and also show that subtle changes in the BBB permeability can be detected in patients with vascular cognitive impairment and MS patients. Essentially, the same MRI data acquisition method and Patlak analysis were used in a rat model of transient cerebral ischemia.31 Normal BBB permeability measured as Ki was estimated to 0.06 (s.d. 0.188) ml/100 g/min, and 0.4 (s.d. 0.8) ml/100 g/min in reperfused ischemic areas. Their mean normal value is close to our value for normal human brain tissue, but with a higher uncertainty, resulting in the conclusion that the BBB permeability was not different from zero. Based on the simulations of the present study, we think that an increase in the sampling frequency, with a subsequent reduction in measurement uncertainty, would have resulted in the opposite conclusion. In a DCE study using a three-dimensional T1-weighted MR sequence with a total measurement time of 7 minutes, the permeability measured as Ktrans in the normal appearing white matter of MS patients was found to be 0.04 (s.d. 0.03) ml/100 g/min.29 As this value represents the plasma clearance, it is close to the value Ki (representing full blood clearance) found in the present study in the white matter of normal healthy subjects.
Other studies have looked into the precision of measurement of leakage when using the eTofts method, focusing on much higher permeability than the present study. Aerts et al32 concluded that a sample frequency of 0.2 Hz was sufficient for a permeability ∼20 ml/100 g/min (Ktrans=10 ml/100 g/min), but a higher sample frequency of 3 Hz was necessary for a Ktrans=50 ml/100 g/min to obtain accurate results when using the eTofts model. In another study evaluating the eTofts model, it was shown that if the time interval between sampling points increased >20 seconds, Ktrans became significantly underestimated, and if the total measurement duration was reduced <5 minutes, a significant overestimation of Ktrans occurred in high-grade gliomas using the eTofts model.33
It is well known that the eTofts model is an approximation of the two-compartment model, sometimes called the two-compartment exchange model, but a thorough description of the connection in a strict mathematical sense has only lately been provided.4 Sourbron and Buckley4 show that the Tofts and the eTofts methods are not appropriate in several typical in vivo situations, and results become very questionable. Strictly, the eTofts model is only correct if Vb=0, or F=∞. In practice, this situation never occurs, and a less stringent requirement for the use of the eTofts model could be if F≫Ki>0. Because F is normally in the range of 20 to 80 ml/100 g/min, and Ki at a level of 0.1 ml/100 g/min, the use of the eTofts model may seem justified. This is apparently supported by the findings that the eTofts model and the two-compartment model give the same results in normal brain tissue in vivo, as mentioned previously. However, our simulation results are in good agreement with Sourbron et al,12 stating that the eTofts model is very sensitive to factors like S/N, sampling frequency, and that for certain combinations of values of blood volume, extravascular interstitial space, perfusion and permeability, eTofts may be inappropriate in some types of normal brain tissues and perhaps even more so in pathologic tissues.
Our approach of using two distinct modeling methods depend on whether back-diffusion can be ignored or not, is in line with the results of Sourbron.12 In this study, the basic set of differential equations corresponding to the two compartments, blood and extravascular tissue, were solved under the condition that back-diffusion from the interstitial space to blood could be (1) neglected, giving the so-called two-compartment uptake model that allows estimation of perfusion, blood volume, and permeability; or (2) included, giving the full two-compartment exchange model allowing estimation of the interstitial space in addition. The choice of which model to be used for a given voxel was based on the Akaike information criterion. Our approach is somewhat different in that we abstain from modeling perfusion explicitly and instead used a model-free regularized deconvolution approach to estimate perfusion. This is because an intravascular contrast agent does not necessarily have an exponential impulse response,34 as is implicit in the two-compartment exchange model. However, we completely agree that when selecting the actual model to be used for a given data set one has to carefully consider the possibility of back-diffusion, and whether to incorporate back-diffusion seems to be important for obtaining accurate results.
The MR signal obtained from brain tissue when using T1-weighted imaging generally suffers from low C/N, especially if significant leakage is not present, because the MR contrast agent primarily affects the relative small vascular volume. This inherently limits the generalization of the specific results of the present study, because C/N is critically dependent on dose of MR contrast agent, voxel size, MR sequence, and field strength. However, the principal finding may still be valid. An increase in C/N can be achieved by replacing the two-dimensional MR sequence with a three-dimensional sequence, without hampering time resolution. Also preliminary results suggest more than a doubling of C/N by increasing the field strength from 3 to 7 Tesla.
In conclusion, detection of subtle changes of the BBB permeability require optimization of measurement conditions such as time resolution and total measurement duration, in conjunction with selection of an appropriate tracer kinetic model. Here, we suggest the use of the Patlak method for measurement of normal and slightly increased permeability, where back-diffusion can be ignored. If the permeability is higher than a certain threshold, based on our results we suggest a limit of 0.3 ml/100 g/min, then a more complex method should be added. Based on simulations we suggest this method consisting of a two-compartment model being highly accurate and reproducible. The normal BBB has permeability larger than zero, when using a typical MR contrast agent, and can be reliably estimated with a careful optimized measurement strategy at 3 Tesla.
Acknowledgments
We would like to thank radiographers Bente Sonne Møller, Helle Simonsen and Karina Elin Segers at Department of Diagnostics, Glostrup Hospital for scanning assistance. Last we would like to thank the Research Foundation of the Capital Region of Denmark, Biogen Idec and the Danish Multiple Sclerosis Society, for their financial support, which made this project possible.
The authors declare no conflict of interest.
Footnotes
This work was supported by The Research Foundation of the Capital Region of Denmark, Foundation for Health Research (grant number R129-A4197); Biogen Idec (grant number GLO-01-2012); and The Danish Multiple Sclerosis Society (grant number 14588).
References
- Larsson HB, Stubgaard M, Frederiksen JL, Jensen M, Henriksen O, Paulson OB. Quantitation of blood-brain barrier defect by magnetic resonance imaging and gadolinium-DTPA in patients with multiple sclerosis and brain tumors. Magn Reson Med. 1990;16:117–131. doi: 10.1002/mrm.1910160111. [DOI] [PubMed] [Google Scholar]
- Tofts PS, Kermode AG. Measurement of the blood-brain barrier permeability and leakage space using dynamic MR imaging. 1. Fundamental concepts. Magn Reson Med. 1991;17:357–367. doi: 10.1002/mrm.1910170208. [DOI] [PubMed] [Google Scholar]
- Tofts PSP, Brix GG, Buckley DLD, Evelhoch JLJ, Henderson EE, Knopp MVM, et al. Estimating kinetic parameters from dynamic contrast-enhanced T(1)-weighted MRI of a diffusable tracer: standardized quantities and symbols. J Magn Reson Imaging. 1999;10:223–232. doi: 10.1002/(sici)1522-2586(199909)10:3<223::aid-jmri2>3.0.co;2-s. [DOI] [PubMed] [Google Scholar]
- Sourbron SP, Buckley DL. On the scope and interpretation of the Tofts models for DCE-MRI. Magn Reson Med. 2011;66:735–745. doi: 10.1002/mrm.22861. [DOI] [PubMed] [Google Scholar]
- Luypaert R, Sourbron S, de Mey J. Validity of perfusion parameters obtained using the modified Tofts model: a simulation study. Magn Reson Med. 2010;65:1491–1497. doi: 10.1002/mrm.22728. [DOI] [PubMed] [Google Scholar]
- Patlak CS, Blasberg RG, Fenstermacher JD. Graphical evaluation of blood-to-brain transfer constants from multiple-time uptake data. J Cereb Blood Flow Metab. 1983;3:1–7. doi: 10.1038/jcbfm.1983.1. [DOI] [PubMed] [Google Scholar]
- Larsson HBW, Courivaud F, Rostrup E, Hansen AE. Measurement of brain perfusion, blood volume, and blood-brain barrier permeability, using dynamic contrast-enhanced T1-weighted MRI at 3 tesla. Magn Reson Med. 2009;62:1270–1281. doi: 10.1002/mrm.22136. [DOI] [PubMed] [Google Scholar]
- Larsson HB, Rosenbaum S, Fritz-Hansen T. Quantification of the effect of water exchange in dynamic contrast MRI perfusion measurements in the brain and heart. Magn Reson Med. 2001;46:272–281. doi: 10.1002/mrm.1188. [DOI] [PubMed] [Google Scholar]
- Moody AR, Martel A, Kenton A, Allder S, Horsfield MA, Delay G, et al. Contrast-reduced imaging of tissue concentration and arterial level (CRITICAL) for assessment of cerebral hemodynamics in acute stroke by magnetic resonance. Invest Radiol. 2000;35:401–411. doi: 10.1097/00004424-200007000-00002. [DOI] [PubMed] [Google Scholar]
- Singh A, Haris M, Rathore D, Purwar A, Sarma M, Bayu G, et al. Quantification of physiological and hemodynamic indices using T(1) dynamic contrast-enhanced MRI in intracranial mass lesions. J Magn Reson Imaging. 2007;26:871–880. doi: 10.1002/jmri.21080. [DOI] [PubMed] [Google Scholar]
- Larsson HBW, Hansen AE, Berg HK, Rostrup E, Haraldseth O. Dynamic contrast-enhanced quantitative perfusion measurement of the brain using T1-weighted MRI at 3T. J Magn Reson Imaging. 2008;27:754–762. doi: 10.1002/jmri.21328. [DOI] [PubMed] [Google Scholar]
- Sourbron S, Ingrisch M, Siefert A, Reiser M, Herrmann K. Quantification of cerebral blood flow, cerebral blood volume, and blood-brain-barrier leakage with DCE-MRI. Magn Reson Med. 2009;62:205–217. doi: 10.1002/mrm.22005. [DOI] [PubMed] [Google Scholar]
- Hansen AE, Pedersen H, Rostrup E, Larsson HBW. Partial volume effect (PVE) on the arterial input function (AIF) in T1-weighted perfusion imaging and limitations of the multiplicative rescaling approach. Magn Reson Med. 2009;62:1055–1059. doi: 10.1002/mrm.22098. [DOI] [PubMed] [Google Scholar]
- Jelescu IO, Leppert IR, Narayanan S, Araújo D, Arnold DL, Pike GB. Dual-temporal resolution dynamic contrast-enhanced MRI protocol for blood-brain barrier permeability measurement in enhancing multiple sclerosis lesions. J Magn Reson Imaging. 2011;33:1291–1300. doi: 10.1002/jmri.22565. [DOI] [PubMed] [Google Scholar]
- Brix G, Kiessling F, Lucht R, Darai S, Wasser K, Delorme S, et al. Microcirculation and microvasculature in breast tumors: pharmacokinetic analysis of dynamic MR image series. Magn Reson Med. 2004;52:420–429. doi: 10.1002/mrm.20161. [DOI] [PubMed] [Google Scholar]
- Cramer SP, Simonsen H, Frederiksen JL, Rostrup E, Larsson HBW. Abnormal blood–brain barrier permeability in normal appearing white matter in multiple sclerosis investigated by MRI. Neuroimage Clin. 2013;4:182–189. doi: 10.1016/j.nicl.2013.12.001. [DOI] [PMC free article] [PubMed] [Google Scholar]
- Lund H, Krakauer M, Skimminge A, Sellebjerg F, Garde E, Siebner HR, et al. Blood-brain barrier permeability of normal appearing white matter in relapsing-remitting multiple sclerosis. PLoS ONE. 2013;8:e56375. doi: 10.1371/journal.pone.0056375. [DOI] [PMC free article] [PubMed] [Google Scholar]
- Silver NC, Tofts PS, Symms MR, Barker GJ, Thompson AJ, Miller DH. Quantitative contrast-enhanced magnetic resonance imaging to evaluate blood-brain barrier integrity in multiple sclerosis: a preliminary study. Mult Scler. 2001;7:75–82. doi: 10.1177/135245850100700201. [DOI] [PubMed] [Google Scholar]
- Kim SY, Buckwalter M, Soreq H, Vezzani A, Kaufer D. Blood-brain barrier dysfunction-induced inflammatory signaling in brain pathology and epileptogenesis. Epilepsia. 2012;53:37–44. doi: 10.1111/j.1528-1167.2012.03701.x. [DOI] [PMC free article] [PubMed] [Google Scholar]
- Oby E, Janigro D. The blood-brain barrier and epilepsy. Epilepsia. 2006;47:1761–1774. doi: 10.1111/j.1528-1167.2006.00817.x. [DOI] [PubMed] [Google Scholar]
- Starr JM, Farrall AJ, Armitage P, McGurn B, Wardlaw J. Blood-brain barrier permeability in Alzheimer's disease: a case-control MRI study. Psychiatry Res. 2009;171:232–241. doi: 10.1016/j.pscychresns.2008.04.003. [DOI] [PubMed] [Google Scholar]
- Anderson VC, Lenar DP, Quinn JF, Rooney WD. The blood-brain barrier and microvascular water exchange in alzheimer's disease. Cardiovasc Psychiatry Neurol. 2011;2011:1–9. doi: 10.1155/2011/615829. [DOI] [PMC free article] [PubMed] [Google Scholar]
- Taheri S, Gasparovic C, Huisa BN, Adair JC, Edmonds E, Prestopnik J, et al. Blood-brain barrier permeability abnormalities in vascular cognitive impairment. Stroke. 2011;42:2158–2163. doi: 10.1161/STROKEAHA.110.611731. [DOI] [PMC free article] [PubMed] [Google Scholar]
- Edvinsson L, Tfelt-Hansen P. The blood-brain barrier in migraine treatment. Cephalalgia. 2008;28:1245–1258. doi: 10.1111/j.1468-2982.2008.01675.x. [DOI] [PubMed] [Google Scholar]
- Gao H-M, Le Li, Zhang K-L, Chen X-H, Tian S-Q, Zhang Z-L. Impact of migraine attacks on the blood-brain barrier. Chin Med J (Engl) 2010;123:2559–2561. [PubMed] [Google Scholar]
- Winkler MKL, Chassidim Y, Lublinsky S, Revankar GS, Major S, Kang E-J, et al. Impaired neurovascular coupling to ictal epileptic activity and spreading depolarization in a patient with subarachnoid hemorrhage: possible link to blood-brain barrier dysfunction. Epilepsia. 2012;53:22–30. doi: 10.1111/j.1528-1167.2012.03699.x. [DOI] [PMC free article] [PubMed] [Google Scholar]
- Bell RD, Winkler EA, Sagare AP, Singh I, LaRue B, Deane R, et al. Pericytes control key neurovascular functions and neuronal phenotype in the adult brain and during brain aging. Neuron. 2010;68:409–427. doi: 10.1016/j.neuron.2010.09.043. [DOI] [PMC free article] [PubMed] [Google Scholar]
- Iannotti F, Fieschi C, Alfano B, Picozzi P, Mansi L, Pozzilli C, et al. Simplified, noninvasive PET measurement of blood-brain barrier permeability. J Comput Assist Tomogr. 1987;11:390–397. doi: 10.1097/00004728-198705000-00004. [DOI] [PubMed] [Google Scholar]
- Ingrisch M, Sourbron S, Morhard D, Ertl-Wagner B, Kümpfel T, Hohlfeld R, et al. Quantification of perfusion and permeability in multiple sclerosis. Invest Radiol. 2012;47:252–258. doi: 10.1097/RLI.0b013e31823bfc97. [DOI] [PubMed] [Google Scholar]
- Taheri S, Rosenberg GA, Ford C. Quantification of blood-to-brain transfer rate in multiple sclerosis. Mult Scler Relat Disord. 2013;2:124–132. doi: 10.1016/j.msard.2012.09.003. [DOI] [PMC free article] [PubMed] [Google Scholar]
- Ewing JR, Knight RA, Nagaraja TN, Yee JS, Nagesh V, Whitton PA, et al. Patlak plots of Gd-DTPA MRI data yield blood-brain transfer constants concordant with those of 14C-sucrose in areas of blood-brain opening. Magn Reson Med. 2003;50:283–292. doi: 10.1002/mrm.10524. [DOI] [PubMed] [Google Scholar]
- Aerts HJWL, Jaspers K, Backes WH. The precision of pharmacokinetic parameters in dynamic contrast-enhanced magnetic resonance imaging: the effect of sampling frequency and duration. Phys Med Biol. 2011;56:5665–5678. doi: 10.1088/0031-9155/56/17/013. [DOI] [PubMed] [Google Scholar]
- Larsson C, Kleppestø M, Rasmussen I, Salo R, Vardal J, Brandal P, et al. Sampling requirements in DCE-MRI based analysis of high grade gliomas: simulations and clinical results. J Magn Reson Imaging. 2013;37:818–829. doi: 10.1002/jmri.23866. [DOI] [PubMed] [Google Scholar]
- Ostergaard L, Weisskoff RM, Chesler DA, Gyldensted C, Rosen BR. High resolution measurement of cerebral blood flow using intravascular tracer bolus passages. Part I: mathematical approach and statistical analysis. Magn Reson Med. 1996;36:715–725. doi: 10.1002/mrm.1910360510. [DOI] [PubMed] [Google Scholar]