

Abstract
Stable calcium-induced calcium release (CICR) is critical for maintaining normal cellular contraction during cardiac excitation-contraction coupling. The fundamental element of CICR in the heart is the calcium (Ca2+) spark, which arises from a cluster of ryanodine receptors (RyR). Opening of these RyR clusters is triggered to produce a local, regenerative release of Ca2+ from the sarcoplasmic reticulum (SR). The Ca2+ leak out of the SR is an important process for cellular Ca2+ management, and it is critically influenced by spark fidelity, i.e., the probability that a spontaneous RyR opening triggers a Ca2+ spark. Here, we present a detailed, three-dimensional model of a cardiac Ca2+ release unit that incorporates diffusion, intracellular buffering systems, and stochastically gated ion channels. The model exhibits realistic Ca2+ sparks and robust Ca2+ spark termination across a wide range of geometries and conditions. Furthermore, the model captures the details of Ca2+ spark and nonspark-based SR Ca2+ leak, and it produces normal excitation-contraction coupling gain. We show that SR luminal Ca2+-dependent regulation of the RyR is not critical for spark termination, but it can explain the exponential rise in the SR Ca2+ leak-load relationship demonstrated in previous experimental work. Perturbations to subspace dimensions, which have been observed in experimental models of disease, strongly alter Ca2+ spark dynamics. In addition, we find that the structure of RyR clusters also influences Ca2+ release properties due to variations in inter-RyR coupling via local subspace Ca2+ concentration ([Ca2+]ss). These results are illustrated for RyR clusters based on super-resolution stimulated emission depletion microscopy. Finally, we present a believed-novel approach by which the spark fidelity of a RyR cluster can be predicted from structural information of the cluster using the maximum eigenvalue of its adjacency matrix. These results provide critical insights into CICR dynamics in heart, under normal and pathological conditions.
Introduction
Contraction of the cardiac myocyte is driven by a process known as excitation-contraction coupling (ECC), which is initiated at calcium (Ca2+) release units (CRUs) when individual L-type Ca2+ channels (LCCs) open in response to membrane depolarization. These events produce Ca2+ flux into a narrow subspace formed by the t-tubule (TT) and junctional sarcoplasmic reticulum (JSR) membranes. The resulting increase in subspace Ca2+ concentration ([Ca2+]ss) leads to opening of Ca2+-sensitive Ca2+ release channels, known as ryanodine receptors (RyRs), which are located in the JSR membrane and produce additional flux of Ca2+ into the subspace. These two sources of Ca2+ flux generate an intracellular Ca2+ transient that triggers cardiac muscle contraction. Studying the mechanisms of this Ca2+-induced Ca2+ release (CICR) process is therefore critical to understanding healthy and diseased cardiac muscle function.
Individual release events, referred to as Ca2+ sparks, can be visualized using fluorescent Ca2+ indicators and confocal microscopy (1, 2). Spontaneous Ca2+ sparks are observed in resting myocytes and during diastole. A Ca2+ spark occurs when a RyR opens spontaneously and causes a local rise in [Ca2+]ss that triggers the rest of the RyR cluster. Recently, it has been shown that diastolic Ca2+ sparks contribute to sarcoplasmic reticulum (SR) Ca2+ leak (3), which balances Ca2+ uptake into the SR by the SR Ca2+-ATPase (SERCA) pump. In addition, RyRs can mediate Ca2+ leak in the absence of Ca2+ sparks (3, 4). The spontaneous opening of a single RyR may fail to trigger the rest of the RyR cluster, thus releasing only a small amount of Ca2+ (5, 6). This type of event is known as a Ca2+ quark, and it results in a phenomenon referred to as “invisible Ca2+ leak” because its fluorescence signal is too small to detect with [Ca2+] indicator dyes (7). “Invisible leak” may originate from RyRs located in clusters or from nonjunctional, i.e., rogue RyRs (8).
Spark fidelity, or the probability that a single RyR opening triggers a Ca2+ spark, is a property of the RyR cluster, and it is strongly influenced by RyR gating properties. In particular, the sensitivity of the RyR to [Ca2+]ss critically influences spark fidelity. When a RyR opens, neighboring RyRs sense the steep [Ca2+]ss gradient from the open channel. If [Ca2+]ss sensitivity is very high, openings are very likely to recruit nearby RyRs, whereas low sensitivity to [Ca2+]ss results in fewer Ca2+ sparks. Previously, single-channel studies in artificial lipid bilayers found that the EC50 for RyR open probability was in the range of 1–25 μM (9). However, more recent experiments have shown that this range is likely much higher (45–85 μM) in the presence of physiological [Mg2+], [ATP], and JSR Ca2+ concentration ([Ca2+]jsr) (10, 11, 12).
Numerous mechanisms modulate RyR gating. A large body of work suggests that [Ca2+]jsr controls sensitivity to [Ca2+]ss (9, 12, 13, 14, 15). The physiological role of [Ca2+]jsr-dependent regulation is controversial, but recent single-channel studies have concluded that [Ca2+]jsr-dependent regulation is weak in rat and mouse in the physiological range of [Ca2+]jsr (0.1–1 mM) (10, 12). There is also evidence that the JSR load affects RyR activity during Ca2+ sparks by controlling the unitary RyR current amplitude, which would influence the [Ca2+]ss gradient during channel opening (6, 10, 16). Other regulatory mechanisms include the effects of protein kinase A (17, 18), Ca2+/calmodulin-dependent kinase II (CaMKII) (19, 20), allosteric coupling (21, 22), redox modifications (23), and genetic mutations associated with catecholaminergic polymorphic ventricular tachycardia (CPVT) (12, 24, 25). The role of CRU geometry in Ca2+ spark fidelity has been studied using compartmental models (26, 27), but has yet to be addressed with a detailed three-dimensional model.
The cardiac CRU is formed by the JSR, a flattened cisternal extension of the SR ∼30-nm thick, which wraps around the TT, forming a narrow subspace of ∼12–20 nm in width. In recent years, viewpoints on the packing of RyRs within the subspace have evolved. Franzini-Armstrong et al. (28) observed densely packed RyR foot structures in the subspace using electron microscopy and estimated large cluster sizes in excess of 100 RyRs. However, recent super-resolution fluorescence microscopy techniques showed heterogeneous peripheral RyR cluster shapes with unprecedented detail, and quantitative analysis confirmed that RyR cluster sizes are exponentially distributed. Of note, the majority of RyR channels were organized in clusters of ∼25 RyRs in rat myocytes (29). Breakthroughs in electron microscope tomography have led to detailed three-dimensional reconstructions of the TT and SR ultrastructure, revealing that the geometry of the subspace is also heterogeneous due to the irregular shape of the SR membrane (30, 31). Remodeling of the JSR (32, 33) and TT (34, 35) has also been observed in models of chronic heart failure. Despite these new data, the functional roles of subspace and RyR cluster geometry remain unclear and cannot be directly investigated through contemporary experimental methods and technologies.
To study the roles of RyR gating properties, spark fidelity, and CRU anatomy on CICR, we have developed a three-dimensional, biophysically detailed model of the CRU. The model quantitatively reproduces important physiological parameters, such as Ca2+ spark kinetics and morphology, Ca2+ spark frequency, and SR Ca2+ leak rate across a wide range of conditions and CRU geometries. The model also produces realistic ECC gain, which is a measure of efficiency of the ECC process and healthy cellular function. We compare versions of the model with and without [Ca2+]jsr-dependent activation of the RyR and show how it can explain the experimentally observed SR leak-load relationship. Perturbations to subspace geometry influenced local [Ca2+]ss signaling in the CRU nanodomain as well as the CICR process during a Ca2+ spark.
We also incorporated RyR cluster geometries informed by stimulated emission depletion (STED) (35) imaging and demonstrate how the precise arrangement of RyRs can impact CRU function. We found that Ca2+ spark fidelity is influenced by the size and compactness of the cluster structure. Based on these results, we show that by representing the RyR cluster as a network, the maximum eigenvalue of its adjacency matrix is strongly correlated with fidelity. This model provides a robust, unifying framework for studying the complex Ca2+ dynamics of CRUs under a wide range of conditions.
Materials and Methods
Model overview
The model simulates local Ca2+ dynamics with a spatial resolution of ∼10 nm over the course of individual release events (∼100 ms). It is based on the previous work of Williams et al. (6) and can reproduce spontaneous Ca2+ sparks and RyR-mediated, nonspark-based SR Ca2+ leak. It incorporates major biophysical components, including stochastically gated RyRs and LCCs, spatially organized TT and JSR membranes, and other important elements such as mobile buffers (calmodulin, ATP, fluo-4), immobile buffers (troponin, sarcolemmal membrane binding sites, calsequestrin), and the SERCA pump. The three-dimensional geometry was discretized on an unstructured tetrahedral mesh and solved using a cell-centered finite volume scheme. Parameter values are given in Table S1 in the Supporting Material.
Geometry
The simulation domain is a 64 μm3 cube (64 fL) with no-flux conditions imposed at the boundaries. The CRU geometry consists of the TT and JSR membranes (Fig. 1 A). The TT is modeled as a cylinder 200 nm in diameter (35) that extends along the z axis of the domain. Unless otherwise noted, we used a nominal geometry where the JSR is a square pancake 465 nm in diameter that wraps around the TT (36), forming a dyadic space 15 nm in width. The thickness of the JSR is 40 nm and has a total volume of 10−17 L. RyRs are treated as point sources arranged in the subspace on a lattice with 31-nm spacing, and the LCCs are located on the surface of the TT. The nominal CRU model contains a square 7 × 7 array of RyRs and seven LCCs distributed evenly over the RyR cluster (Fig. 1 B). The SERCA pump and troponin buffering sites are homogeneously distributed in the cytosol beyond a radius of 200 nm from the TT axis.
Figure 1.

Model geometry diagrams. (A) Cross-sectional diagram of the model geometry and arrangement of ion channels and membrane structures. The TT is modeled as a cylinder 200 nm in diameter and is partially encircled by the JSR, forming a subspace 15 nm in width. The ion channels are treated as point sources and do not occupy any volume in the subspace. (B) Schematic of flattened JSR (gray) with the arrangement of a 7 × 7 lattice of RyRs with 31-nm spacing (red) and LCCs distributed over the cluster (green). The depicted JSR membrane is 465 nm in diameter.
Transport equations
The Ca2+ diffusion and buffering system is based on a previous spark model by Hake et al. (37). The reaction-diffusion equation for Ca2+ is given by
| (1) |
where β is the dynamic buffering fraction due to sarcolemmal binding sites and DCa is the diffusion coefficient. The Ji terms represent sources of Ca2+, including additional buffers, RyR and LCC fluxes, and SERCA uptake. Diffusion of mobile buffers (ATP, calmodulin, fluo-4) is modeled using similar transport equations. Each buffer B (excluding sarcolemmal binding sites) is assumed to bind to Ca2+ according to elementary rate laws given by
| (2) |
where and kon and koff are reaction rate constants, and [CaB] is the concentration of Ca2+-bound buffer. Concentration balance equations and the values of the diffusion coefficients, reaction rate constants, and buffer concentrations are provided in the Supporting Material. The LCC (38) and SERCA (39) flux formulations are adapted from previous work. [Ca2+]jsr is modeled spatially in the JSR with the same diffusion coefficient as in the cytosol. The network SR (NSR) Ca2+ concentration ([Ca2+]nsr) is assumed to be constant. JSR Ca2+ is refilled by the NSR at each element in the JSR volume, with a flux term given by
| (3) |
where νrefill is a constant that was adjusted to achieve a refill time constant of ∼130 ms (40). Refilling of the JSR throughout its volume is unlikely to have significant impacts on [Ca2+]jsr dynamics, inasmuch as JSRs typically have approximately four connections to the NSR (36).
Negatively charged phospholipid headgroups on the inner sarcolemmal membrane surface are known to exert significant electrostatic effects on [Ca2+]ss dynamics (41). However, the Debye length for the electric field at the membrane is ∼1 nm, which would have required much higher spatial resolution. This was computationally prohibitive to include in this model due to the small time steps required. Instead, a rapid buffering approximation was used for Ca2+ binding to high affinity sarcolemmal binding sites, as described in Peskoff et al. (42) (see Supporting Materials and Methods).
Ion channels
RyRs and LCCs are simulated stochastically using Markov chains. The LCC model used here was described previously in Greenstein and Winslow (38). The RyR is a minimal, two-state Markov chain that incorporates activation by [Ca2+]ss- and [Ca2+]jsr-dependent regulation of the opening rate (6). State transitions are determined according to a fixed closing rate (k−) and an opening rate given by
| (4) |
where k+ is the opening rate constant, ϕ represents a [Ca2+]jsr-dependent regulation term, and η is a constant. The unitary RyR Ca2+ flux is given by
| (5) |
where νryr is a constant. The values of k+, η, and νryr were adjusted to yield physiological resting Ca2+ spark frequency and leak rate at 1 mM [Ca2+]jsr. Fig. S1 shows the dependence of whole-cell Ca2+ spark frequency on the EC50 for [Ca2+]ss activation of the RyR and on η. A narrow range of these parameters yielded a realistic spark rate of ∼100 cell−1 s−1. The value of νryr was adjusted to a unitary current of 0.15 pA at 1 mM [Ca2+]jsr. The ϕ-term is an empirical power function given by
| (6) |
where ϕb and ϕk are constants. At 1 mM [Ca2+]jsr, PO at diastolic [Ca2+]ss (100 nM) is extremely low (1.76 × 10⁻⁶), and the EC50 for activation is 55 μM. We assumed that [Ca2+]jsr strongly regulates PO (43) such that at 2 mM [Ca2+]jsr, the EC50 decreases to 29 μM (see Fig. S2 A). In accordance with recent data (10, 12), however, we assumed that the [Ca2+]jsr weakly regulates the RyR when [Ca2+]jsr is <1 mM such that the EC50 does not change significantly (see Fig. S2, B and C). In cases where [Ca2+]jsr-dependent regulation was assumed to be absent, ϕ = 1—which corresponds to the effect of a resting level of 1 mM [Ca2+]jsr on RyR opening rate when this regulation is intact.
Numerical methods and implementation
The simulation domain was discretized with an unstructured mesh consisting of ∼12,000 tetrahedral elements, and was generated using TETGEN (44). The transport partial differential equations were solved in space using a cell-centered finite volume scheme for unstructured grids and explicitly in time using the first-order Euler method. For the nominal model geometry, numerical stability and solution convergence was achieved for time steps <47 ns. We utilized a 12-ns time step, which ensured both stability and accuracy across all tested CRU geometries. RyR and LCC gating models were simulated using the method described by Alfonsi et al. (45) (see the Supporting Material). A GALAXY (46) toolset was developed for the model, allowing users to explore sample datasets and run simulations with customized CRU geometries and model parameters on a cloud-based service. Example workflows are available for performing linescan simulations, Ca2+ spark fidelity and leak estimation, and ECC gain estimation. (The tools can be found under the Calcium Spark model and the example histories and workflows under Shared Data at http://cvrg.galaxycloud.org.)
Spark analysis
Linescans were generated by convolving a Gaussian point spread function with the Ca2+-bound indicator dye concentration, as described in Smith et al. (47), and the raw fluorescence signal was normalized to the baseline signal (F0). Gaussian noise was superimposed to resemble intrinsic photon noise. Spark kinetics and morphology were computed using SPARKMASTER (48). Methods used to estimate Ca2+ spark fidelity, rate, leak, and ECC gain are given in the Supporting Material. Unless otherwise noted, each plotted data point is derived from an ensemble of at least 1000 independent simulations.
Spectral analysis of RyR clusters
RyR clusters were defined by the channel positions on a two-dimensional lattice. For a given cluster with N channels, we define the N × N adjacency matrix A with elements aij = 1 if RyRs i and j are adjacent, and 0 otherwise. This represents a graph where vertices represent RyRs and edges represent adjacency. It is well known that the spectrum of the adjacency matrix of a graph contains valuable information about its structural properties (49). We computed A for a collection of RyR cluster geometries to show that its maximum eigenvalue λmax is a reliable predictor of spark fidelity.
Results
Model validation
To validate the model, a nominal parameter set and geometry were selected to produce a representative Ca2+ spark with realistic appearance, frequency, and integrated flux. The Ca2+ spark was initiated by holding a RyR open for 10 ms. The linescan simulation exhibited a time-to-peak of 10 ms, full duration at half-maximum of 24 ms, and full width at half-maximum of 1.65 μm (Fig. 2 A). The width is slightly lower than what is observed experimentally (1.8–2.2 μm), but this discrepancy could not be remedied by increasing release flux or altering the CRU geometry. This Ca2+ spark-width paradox is difficult explain using mathematical models (10, 47, 50), but it may be due to non-Fickian diffusion in the cytosol (51). [Ca2+]ss at the center of the subspace peaked at 280 μM (data not shown), and optical blurring decreased peak F/F0 sixfold due to the small volume of the subspace (see Fig. S3 A). The local [Ca2+]ss transients in the vicinity of an open RyR were similar to that shown for a 0.2-pA source in previous work that incorporated electrodiffusion and the buffering effects of negatively charged phospholipid heads of the sarcolemma (41) (see Fig. S3, B and C).
Figure 2.

Representative Ca2+ sparks and RyR gating properties. (A) Simulated linescan of Ca2+ spark (with [Ca2+]jsr-dependent regulation) shown with the temporal fluorescence profile through the center of the spark (bottom), and the spatial fluorescence profile at the peak of the spark (right). (B) Three-dimensional renderings of the Ca2+ spark showing TT (blue), JSR (red), and 1 μM [Ca2+]i isosurface (green). The presence of the JSR membrane causes noticeable asymmetry in the [Ca2+]i gradient throughout the spark. (C) Average [Ca2+]ss, (D) number of open RyRs, and (E) total RyR current, and (F) average [Ca2+]jsr with (blue) and without (red) [Ca2+]jsr-dependent regulation during a spark initiated at t = 0 ms. (Left panels) Traces for single representative sparks; (right panels) averages of at least 100 sparks. Note that the peaks of the averages were lower due to variability in spark activation timing. (An example Ca2+ spark dataset can be viewed at http://cvrg.galaxycloud.org/u/mwalker/h/spark-linescan.)
The model was also constrained to reproduce whole-cell Ca2+ spark rate and overall SR Ca2+ leak. The Ca2+ spark frequency at 1 mM [Ca2+]jsr was estimated to be 133 cell−1 s−1 (see Supporting Materials and Methods), which is in agreement with the observed Ca2+ spark rate of ∼100 cell−1 s−1 in rat (52). The leak rate of 1.01 μM s−1 is also close to that of a previous model of the rat myocyte used to study SERCA pump-leak balance (6) and is consistent with an experimental study in rabbit (3).
ECC gain was estimated for a 200-ms membrane depolarization at test potentials from −20 to 60 mV in 20 mV steps. The gain was then computed as a ratio of peak total RyR flux to peak total LCC flux. ECC gain decreased from 20.7 at −20 mV to 1.5 at 60 mV, in reasonable agreement with experimental studies (53) (see Fig. S4). This validation was achieved without further fitting of the model parameters.
The life and death of Ca2+ sparks
The model provides fresh insights into local Ca2+ signaling during release. Fig. 2 B shows the asymmetrical profile of the 1 μM cytosolic Ca2+ concentration ([Ca2+]i) isosurface during a spark (see Movie S1). Linescan simulations with scans parallel to the TT (z direction), orthogonally through the center of the subspace (x direction), and in the y direction exhibited full width at half-maximums of 1.65, 1.50, and 1.35 μm, respectively, but showed no significant asymmetry in their respective spatial profiles (data not shown). The presence of the JSR caused noticeable rotational asymmetry in [Ca2+]i, however, particularly on the back face of the JSR, where [Ca2+]i reaches ∼1–4 μM (see Fig. S5, A and B). Shrinking the JSR lessened this effect on the [Ca2+]i isosurface, but still resulted in an uneven distribution during release (see Movie S2). [Ca2+]i outside the CRU reached ∼10 μM on the side opposite the JSR due to lower resistance to diffusion (see Movie S3 and Fig. S5 C). These results highlight the importance of accounting for the nanoscopic structure of the CRU in studying localized Ca2+ signaling in microdomains.
During Ca2+ spark initiation, a rise in local [Ca2+]ss around an open channel triggers the opening of nearby RyRs, resulting in a rapid increase in average [Ca2+]ss (Fig. 2 C) and the sustained opening of the entire cluster of RyRs (Fig. 2 D). Note that release continues for >50 ms, despite much shorter spark duration in the linescan. This is explained by the decline in release flux (Fig. 2 E) due to emptying of JSR Ca2+ over the course of the Ca2+ spark (Fig. 2 F and see Movie S4). When [Ca2+]jsr reaches ∼0.2 mM, the declining [Ca2+]ss can no longer sustain RyR reopenings, and the Ca2+ spark terminates. This indirect [Ca2+]jsr-dependent regulation of the RyR is critical to the process by which CICR can terminate. Fig. 2, C–F, also shows sparks where [Ca2+]jsr-dependent regulation was removed, in which case spark dynamics were very similar and termination still occurred.
This is not surprising, given that [Ca2+]jsr-dependent regulation <1 mM was weak in this model (see Fig. S2). The release extinction time, defined as the time from the first RyR opening to the last RyR closing, was marginally higher on average without [Ca2+]jsr-dependent regulation (56.4 vs. 51.5 ms). Our data clearly show that Ca2+ sparks terminate via stochastic attrition facilitated by the collapse of [Ca2+]ss due to localized luminal depletion events (i.e., Ca2+ blinks). Importantly, this conclusion is consistent with our earlier models (6, 50, 54, 55) and in agreement with recent models by Cannell et al. (10) and Gillespie and Fill (56). However, it is not clear that attributing this existing termination mechanism to something such as induction decay or pernicious attrition provides additional insight beyond a simple acronym such as stochastic termination on Ca2+ depletion (STOP). Regardless, the critical role played by [Ca2+]jsr depletion in Ca2+ spark termination is clear, and this depletion must be robust enough for [Ca2+]ss to decrease sufficiently so that spontaneous closings of active RyRs outpaces Ca2+-dependent reopenings.
Direct [Ca2+]jsr-dependent regulation of RyRs
The role of direct [Ca2+]jsr-dependent regulation on RyR gating remains controversial. As shown in the previous section, we found that such regulation is not essential for Ca2+ spark termination. To see how this mechanism influences cell function, we investigated its effects on spark fidelity, Ca2+ spark rate, leak, and ECC gain over varying SR loads.
Experimental studies have demonstrated that Ca2+ spark frequency and SR Ca2+ leak rate increase exponentially at elevated [Ca2+]jsr (3, 57, 58). There are two intrinsic factors contributing to the exponential rise.
-
1.
Higher [Ca2+]jsr results in larger concentration gradients across the JSR membrane, thereby increasing the unitary current of the RyR and accelerating the [Ca2+]ss rising rate, and thus perpetuating release from other RyRs.
-
2.
Higher SR loads also increase the amount of Ca2+ released per Ca2+ spark, contributing to increased Ca2+ spark-based leak.
[Ca2+]jsr-dependent regulation introduces two additional mechanisms that contribute to increased Ca2+ spark frequency.
-
1.
[Ca2+]jsr-dependent regulation of the RyR enhances its sensitivity to [Ca2+]ss at higher [Ca2+]jsr, increasing the likelihood that the cluster will be triggered.
-
2.
The enhanced Ca2+ sensitivity also increases the frequency of spontaneous Ca2+ quarks (6).
To elucidate the importance of [Ca2+]jsr-dependent regulation in the SR leak-load relationship, we tested two versions of the model with and without it (see Fig. S2 C). In the case without it, ϕ = 1, so that Ca2+ spark frequency and leak are still properly constrained at 1 mM [Ca2+]jsr. Spark fidelity and the total Ca2+ released per Ca2+ spark were estimated from an ensemble of simulations of independent CRUs, from which Ca2+ spark frequency and SR Ca2+ leak rate could be estimated for [Ca2+]jsr values ranging from 0.2 to 1.8 mM (see Supporting Materials and Methods). The presence of [Ca2+]jsr-dependent regulation increased fidelity at high [Ca2+]jsr due to enhanced [Ca2+]ss sensitivity, which increased the likelihood that a single open RyR triggered nearby channels (Fig. 3 A) . The frequency of Ca2+ sparks, which is proportional to spark fidelity, was therefore also elevated for the same reason but additionally because of a higher spontaneous opening rate at resting [Ca2+]ss (Fig. 3 B).
Figure 3.

Effects of SR load on SR Ca2+ leak and ECC gain. Results are plotted for two versions of the model with (black) and without (red) luminal [Ca2+]jsr-dependent regulation. (A) Dependence of spark fidelity, the probability of a spark occurring given that one RyR has opened. (B) Whole-cell spark rate, estimated assuming 1.25 × 10⁶ RyRs per cell. (C) Mean total Ca2+ release per spark. (D) Visible leak released through sparks only. (E) The fraction of total RyR-mediated leak attributed to invisible (nonspark) leak. (F) Peak-to-peak ECC gain for the 200-ms voltage-clamp protocol to 0 mV. (An example dataset for Ca2+ spark fidelity and leak estimates is available at http://cvrg.galaxycloud.org/u/mwalker/h/fidelity-leak, and for ECC gain at http://cvrg.galaxycloud.org/u/mwalker/h/ecc-gain.)
Average Ca2+ released per Ca2+ spark was slightly lower in the presence of [Ca2+]jsr-dependent regulation (Fig. 3 C). This is because the RyR gating model exhibits a small decrease in [Ca2+]ss sensitivity upon JSR depletion, thus accelerating spark termination and decreasing total Ca2+ release. However, the combination of enhanced spark fidelity and the increased rate of individual RyR openings resulted in an exponential increase in Ca2+ spark frequency under Ca2+ overload, despite the purely linear relationship observed in the absence of [Ca2+]jsr-dependent regulation (Fig. 3 D). Therefore, the exponential rise in spark rate and leak rate at elevated [Ca2+]jsr cannot be accounted for solely by the greater driving force for Ca2+ release flux and higher SR load, but it can be explained by RyR sensitization by [Ca2+]jsr -dependent regulation.
Fig. 3 E shows that there was a small effect on the fraction of leak attributed to nonspark events, with greater invisible leak at lower [Ca2+]jsr in the presence of [Ca2+]jsr-dependent regulation. This is due to the fact that [Ca2+]jsr-dependent regulation decreases [Ca2+]ss sensitivity at low values of [Ca2+]jsr and therefore lowers spark fidelity. Interestingly, we find that invisible leak is maximal at 1 mM [Ca2+]jsr (see Fig. S6). The decrease in invisible leak under SR overload is explained by a decline in the mean open time for nonspark RyR openings (1.90 ms at 1 mM vs. 0.64 ms at 1.8 mM). This occurs because a larger flux through the RyR occurs at higher [Ca2+]jsr, causing other RyRs to be triggered earlier. It is then more likely that even short openings would initiate Ca2+ sparks, decreasing the average Ca2+ release of nonspark events. Finally, Fig. 3 F shows small differences in ECC gain at a 0 mV test potential between models with and without [Ca2+]jsr-dependent regulation at varying [Ca2+]jsr, reflecting differences in RyR sensitivity to trigger Ca2+.
Subspace geometry
Ultrastructural remodeling of the subspace has been implicated in diseases such as heart failure (32, 33, 59) and CPVT (60, 61). We investigated how changes in subspace geometry influence CRU function. We first altered the distance between the TT and JSR membranes. Ca2+ spark fidelity (Fig. 4 A),rate (Fig. 4 B), and leak (Fig. 4 C) decreased steeply as the TT-JSR separation increased beyond the nominal width of 15 nm. This separation reduced the initial rise of [Ca2+]ss during CICR due to the increase in subspace volume. The resulting drop in spark fidelity led to fewer sparks and less leak. The ECC gain at 0 mV also declined in a similar manner, dropping sharply from 16.8 at 12 nm to 2.4 at 30 nm (Fig. 4 D). This is not surprising given the effects of subspace width on fidelity, because LCCs also initiate release through CICR. Ca2+ sparks, Ca2+ spark-based leak, and ECC function were nearly abolished at subspace widths >60 nm, with the exception of invisible leak, which was nearly constant over all distances.
Figure 4.

Effects of increasing the distance between TT and JSR membranes on (A) Ca2+ spark fidelity, (B) spark rate, (C) spark (circles) and nonspark (triangles) based SR Ca2+ leak, and (D) ECC gain at 0-mV clamp potential. Spark-based leak and ECC gain were abolished for widths >40 nm due to the increase in subspace volume, while invisible leak remained nearly constant.
We also investigated the effects of resizing the JSR membrane diameter (as depicted in Fig. 1 B) over a range of 217 × 217 nm2 to 465 × 465 nm2. We observed higher spark fidelity for JSRs of larger diameter (Fig. 5 A), which introduced resistance to diffusion of Ca2+ out of the subspace. Larger JSRs also exhibited greater spark-based leak and decreased invisible leak (Fig. 5 B). The enhanced spark-based leak was due to the higher spark rate and larger JSR volume, which provides more releasable Ca2+ per spark. The effect on invisible leak was smaller in absolute terms, dropping from 0.090 μM s−1 at 217 × 217 nm2 to 0.082 μM s−1 at 403 × 403 nm2, but then to 0.051 μM s−1 at 465 × 465 nm2. Smaller JSRs are more likely to leak invisible Ca2+ because of their lower fidelity. These results suggest that remodeling of the JSR, as observed in diseased hearts, may alter SR Ca2+ leak and the effectiveness of CICR and extend previous observations (35).
Figure 5.

Effects of JSR diameter on SR Ca2+ leak. (A) Spark fidelity (triangles) and rate (circles). (B) Spark- and nonspark-based SR Ca2+ leak. Data points collected for JSR membrane areas of 217 × 217, 279 × 279, 341 × 341, 403 × 403, and 465 × 465 nm2.
RyR cluster structure
Super-resolution imaging techniques have revealed the diversity and complexity of channel arrangements of peripheral RyR clusters (29). We explored how the geometry of the RyR cluster may be related to spark fidelity. Images of peripheral RyR clusters were acquired using super-resolution STED microscopy of RyR immunolabelings in isolated adult mouse myocytes (C57Bl6) (35, 62). Imaging protocols were adjusted to sample RyR immunofluorescent signals at a lateral imaging resolution <70 nm and produced variable and complex cluster shapes. These images were then used to extract RyR cluster geometries and infer the arrangement of RyRs in each cluster. For this purpose, high signal levels equal to and above the 95th percentile brightness were interpreted to represent a closed lattice of RyR channels (63).
We incorporated a collection of 15 RyR cluster arrangements that represented the diversity of cluster geometries in the model and estimated the fidelity of each RyR using the protocol from Fig. 3 A. Fig. 6 illustrates the RyR cluster arrangements, where each RyR is colored according to its spark fidelity. Larger and denser clusters exhibited higher spark fidelity. For example, cluster (i) with four RyRs had a 1.2% average fidelity, while cluster (xv) with 91 RyRs had an 11.1% average fidelity. Evidently, there were also spatial gradients in fidelity, particularly across the larger clusters. RyRs located on the boundary of a cluster were less likely to initiate sparks, while those near the epicenter had a high chance of triggering sparks because they had more neighboring RyRs.
Figure 6.

Spark fidelity of RyR cluster geometries inferred from STED nanoscopy images of adult mouse cardiac myocytes. Super-resolution imaging of RyR clusters at <70-nm lateral resolution resolved highly variable cluster shapes and sizes that were translated into a lattice of pore positions. Heat maps depict the RyR cluster geometries, with the TT axis in the vertical direction. Each grid square represents a single RyR and is colored by the probability that it will trigger a spark. At least 10,000 simulations were performed for each cluster.
We also explored the spark fidelity of two artificial cluster types: square arrays and randomly generated clusters in which cluster lattice spaces contained a RyR with 50% probability (see Fig. S7). The number of RyRs in a cluster was a robust predictor of spark fidelity for the STED-based clusters and square arrays (see Fig. S8 A). For these two cluster types, larger clusters exhibited higher spark fidelity. In a cellwide population of release sites, clusters with >30 RyRs contributed to 92% of spark-based leak (see Fig. S8, B and C). This result is discussed further in the Supporting Material. However, the number of RyRs was not a robust predictor of spark fidelity for the randomly generated clusters. RyRs with zero, one, or two adjacent RyRs were common in the random clusters, but they contributed little to spark fidelity. Therefore, clusters with the same number of RyRs exhibited different spark fidelity because of heterogeneity in cluster structure.
Spectral analysis of RyR cluster structure
To understand why clusters with the same number of RyRs exhibit different fidelity requires consideration of the channel arrangement. A natural approach is to use a graph-based analysis in which adjacent RyRs, represented by nodes, are connected by edges.
We computed the maximum eigenvalue λmax of each cluster’s adjacency matrix for square arrays, STED-based clusters, and the randomly generated clusters and found a remarkably strong correlation with spark fidelity (Spearman’s rank correlation r = 0.9055). Fig. 7 A shows each cluster’s λmax value plotted against its spark fidelity for the nominal set of model parameters. The range of λmax values was 1.8–3.92, near the theoretical bounds of 1–4. STED-based clusters had a wide range of λmax values (2.0–3.69) due to their varying sizes and degrees of compactness. Densely packed square arrays had mostly higher values (2.83–3.92). The randomly generated clusters fell in a lower range (1.80–3.23) due to their fragmented structure (see Fig. S7). It can be shown that 〈d〉 < λmax < dmax, where 〈d〉 and dmax are the average and maximum degrees of the graph, respectively (49). Fig. S9 shows that the fidelity of the clusters from Fig. 7 A was also significantly correlated with 〈d〉 (r = 0.8730). The slightly lower correlation coefficient may be attributed to the fact that λmax takes into account the full structure of the RyR network.
Figure 7.
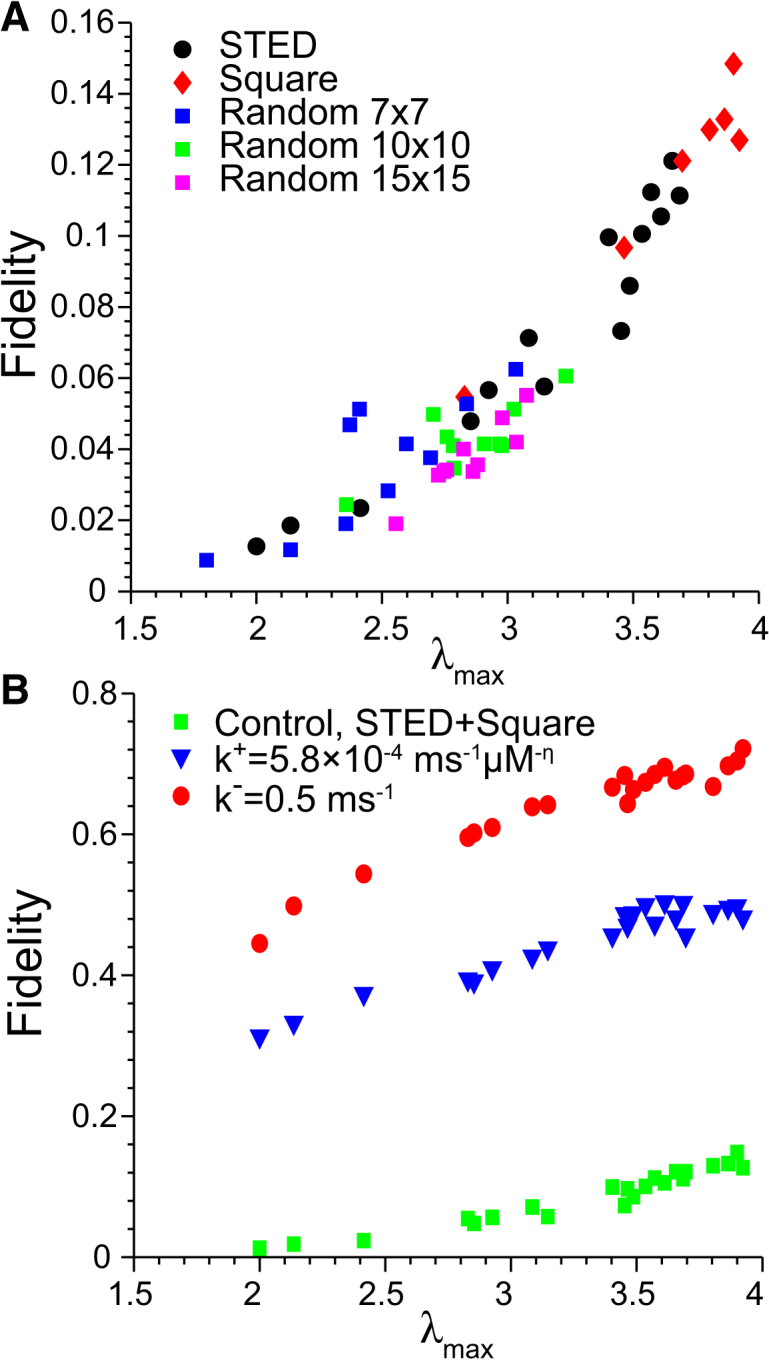
Correlation between maximum eigenvalue λmax of the RyR cluster adjacency matrix and spark fidelity. (A) Results for clusters inferred from STED images (circles), square arrays of RyRs (diamonds), and random clusters (squares, 7 × 7 in blue; 10 × 10 green; 15 × 15 magenta). Random clusters were generated by randomly filling each RyR lattice space with 50% probability (see Fig. S7). (B) Results for STED-based and square clusters where RyR EC50 was lowered from 55 to 25 μM by increasing the RyR opening rate constant k+ from 1.10 × 10⁻⁴ to 5.80 × 10⁻⁴ ms−1μm−η (triangles) or increasing τO to 10 ms (circles). The data from panel A for STED and square clusters are replotted for comparison (squares).
We then tested how an increase in RyR Ca2+ sensitivity would alter the relationship between spark fidelity and λmax because of its relevance to RyR hypersensitivity in CPVT (12, 64). Fig. 7 B shows the fidelity of the STED-based and square clusters when the RyR EC50 was decreased to from 55 to 25 μM by increasing the mean open time (τO) to 10 ms or increasing the opening rate constant. The strong correlation between λmax and fidelity still held for this set of parameters, with r = 0.9266 and 0.8169 for increasing τO and the opening rate, respectively. Increasing τO elevated fidelity to a range of 0.45–0.72, which was greater than the range 0.31–0.50 resulting from increased opening rate. Note that the changes in model parameters were approximately fivefold in both cases, suggesting that Ca2+ spark fidelity is more sensitive to changes in τO. These results show how an increase in RyR sensitivity resulting from CPVT-linked mutations causes dramatically increased Ca2+ spark fidelity.
In all cases, λmax was a consistent predictor of spark fidelity for a given set of physical parameters. We therefore conclude that the precise arrangement of RyRs in the subspace has a significant impact on the spark initiation process and that the fidelity of the RyR cluster can be reliably predicted from λmax, which only requires knowledge of the RyR cluster structure.
Discussion
Here we have presented a believed-novel three-dimensional model of the cardiac CRU to investigate mechanisms of Ca2+ release. The model is based on previous work, which demonstrated that RyR-mediated leak through Ca2+ sparks and nonspark Ca2+ quarks is sufficient to achieve SERCA pump-leak balance in resting cells (6). This work is the first, to our knowledge, to quantitatively capture these dynamics and exhibit a realistic ECC gain in a super-resolution spatial framework that is not limited by the assumptions of a compartmental model, such as the uniformity of [Ca2+]ss within the subspace or simplified cytosolic transport fluxes. The model has enabled us to explore how perturbations of subspace geometry and RyR cluster arrangements, like those that may occur under normal physiological conditions and in various diseased states, affect Ca2+ release. It also provides a framework for exploring nanoscopic Ca2+ signaling and can be used to investigate a plethora of topics such as the roles of Ca2+ load, RyR gating properties, [Ca2+]ss and [Ca2+]jsr sensitivity, and CRU geometry in Ca2+ release.
RyR cluster spectral properties
A significant finding of this work is that the maximum eigenvalue of the RyR cluster adjacency matrix is a reliable predictor of Ca2+ spark fidelity. Spectral graph theory is a mature field that has been used in a variety of applications, such as the study of Internet networks (65), spread of social contagion (66), protein side-chain cluster detection (67), biological networks (68), phylogeny inference (69), EEG analysis (70), and infectious disease models (71). These studies leverage the information contained in graph spectra to characterize network structure and develop novel metrics for predicting functional system properties.
Similarly, we have discovered an important role for λmax in predicting an important functional property of a complex system. The correlation with spark fidelity is remarkable, given the complexity and nonlinearity of the model. Note that this enables one to compare fidelity across clusters for a given physiological state, and it only requires knowledge of the RyR cluster structure. We believe this to be an elegant theoretical tool that can be used for functional comparison of different cluster structures in experimental studies.
[Ca2+]jsr-dependent regulation
Termination of Ca2+ release is essential to stable cell function. However, it remains unclear exactly how a Ca2+ spark terminates given the regenerative nature of CICR. Several potential mechanisms have been proposed, including [Ca2+]ss- or use-dependent RyR inactivation (72) and [Ca2+]jsr-dependent regulation of RyRs (13). Our model predicts that deactivation of the RyR caused by [Ca2+]jsr-dependent regulation is not necessary for Ca2+ spark termination. Note that this result may be dependent on the refill rate of the JSR, inasmuch as faster rates can prevent sufficient JSR depletion and thus Ca2+ spark termination as well by this mechanism (data not shown) (73, 74). A more detailed model that incorporates diffusion of Ca2+ in the network SR may be able to address this issue more carefully. Similarly, we did not include RyR-RyR interactions (21, 22), because Ca2+ spark termination did not require it. Nevertheless, there is reasonable biological evidence that support such interactions. When features that require such interactions in the generation and/or termination of Ca2+ sparks are shown experimentally, they can be used to constrain and inform Ca2+ spark features.
We have also shown that [Ca2+]jsr-dependent regulation can explain the exponential shape of the SR leak-load relationship (3, 57) by 1), enhancing RyR sensitivity to the local rise in [Ca2+]ss during a Ca2+ quark; and 2), increasing the spontaneous RyR opening rate. It is also possible that Ca2+-activated regulators, such as CaMKII (19, 20), RyR mutations (64), or mutations in RyR-linked proteins (75), may affect the relationship between SR load and spark frequency in a similar manner or that propagation of release between adjacent sites could enhance leak under overload (76). Nevertheless, the model predicts that the leak-load relationship cannot be adequately captured in the absence of these mechanisms.
Physiological and pathophysiological significance
We have shown how an increase in spark fidelity leads to higher Ca2+ spark frequency and Ca2+ spark-based leak. Ca2+ spark frequency is an important property that controls cellular and SR Ca2+ load by providing a pathway for Ca2+ to leak from the SR during diastole. Diastolic spark-based leak leads to extrusion of Ca2+ from the cell through the sarcolemmal Na+/Ca2+ exchanger and also delicately balances SR refilling via the SERCA pump (6, 77). Under conditions with enhanced SR Ca2+ leak, these pathways contribute to reduced SR Ca2+ load and impaired systolic function.
CPVT is an inherited genetic disorder that often leads to syncope and sudden cardiac death. The disease has been linked to mutations in the RyR (RYR2) and calsequestrin (CASQ2) genes (78). Chen et al. (12) recently showed that R33Q-CASQ2 knock-in mice exhibit CPVT-like symptoms and then showed through single-channel studies that this mutation causes an increase in RyR τO to ∼10 ms. They attributed this increase to a loss of calsequestrin-dependent regulation of the RyR. Jiang et al. (64) studied a CPVT-linked RYR2 mutation that resulted in decreased mean closed time of the channel.
We have shown that these mutations result in dramatically higher spark fidelity (compare Fig. 7, A and B). The increased sensitivity to [Ca2+]ss directly elevated leak, as did the higher Ca2+ spark rate that it caused, and both would contribute to the reduction in SR load and spontaneous cell-wide release (i.e., Ca2+ sparks and Ca2+ waves) observed in experimental models of CPVT (79, 80, 81). This model and these data suggest that CICR underlies these changes in Ca2+ sparks and waves, and not stored overload-induced Ca2+ release (82).
Using the R33Q-CASQ2 knock-in model, Liu et al. (60) and Denegri et al. (61) observed extensive ultrastructural remodeling of the CRU, resulting in JSR fragmentation, reduced subspace areas, and smaller RyR clusters. Our results are in agreement with a recent compartmental model by Lee et al. (27), who showed that subspace volume and efflux rate critically influence spark fidelity. Interestingly, our data suggest that this could be a compensatory mechanism—one that helps reduce the enhanced fidelity, spark frequency, and SR Ca2+ leak caused by the increase in τO.
Chronic heart failure in cardiac myocytes is characterized by diminished excitation-contraction coupling and slowed contraction (35, 83), which are in part due to a reduction in SR Ca2+ load (3, 84). It has been shown that RyR-mediated leak alone is sufficient to cause the decrease in SR Ca2+ load (3). This can be attributed to a variety of posttranslational modifications to the RyR, including PKA-dependent phosphorylation (18), CaMKII-dependent phosphorylation (85), and redox modifications (86). The model shows how the spark rate rises quickly for sensitive channels (see Fig. S1 A), suggesting that minor increases in RyR [Ca2+]ss sensitivity could significantly enhance SR Ca2+ leak in heart failure.
Structural changes to the CRU may be caused by a downregulation of the protein junctophilin-2 (JP2) in heart failure (32, 33, 59). Wu et al. (33) observed a reduction in the length of the JSR and subspace in both failing rat myocytes and a JP2 knockdown model. This, in part, led to reduced [Ca2+]i transients and desynchronized release. This work has confirmed that the CICR process is sensitive to the diameter of the JSR, which acts as a barrier to Ca2+ efflux from the subspace. Shortening the JSR reduces spark fidelity (see Fig. 5 A) and thus the ability of trigger Ca2+ from the LCCs to efficiently activate the RyRs. In addition, van Oort et al. (59) demonstrated experimentally that JP2 knockdown resulted in an increase in the variability of subspace width. This is consistent with the model prediction that ECC gain is sensitive to the distance between the JSR and TT (see Fig. 4 D), implying that subspace width variability would also contribute to nonsynchronous release during ECC.
JSRs become separated from the TT during chronic heart failure, resulting in orphaned RyR clusters that are uncoupled from the LCCs (87). Again, the model predicts that the separation of the JSR and TT membranes strongly decreases spark frequency and ECC gain due to the increase in subspace volume. This corroborates the findings of Gaur and Rudy (26), who demonstrated that increasing subspace volume causes reduced ECC gain. We conclude here that orphaned RyR clusters contribute less to spark-based leak and Ca2+ release during ECC, but they may mediate invisible leak.
The heterogeneity of spark fidelity among release sites may have implications for the formation of Ca2+ waves. Modeling studies have suggested that conditions that enable one Ca2+ spark to trigger another are needed to initiate a Ca2+ wave (88). Although it is unclear exactly how this occurs in every instance, conditions favoring regenerative Ca2+ sparks among local CRUs lead to both the generation of macrosparks and Ca2+ waves (89, 90). Therefore, RyR clusters with greater spark fidelity may be more arrhythmogenic because they have a higher propensity for exhibiting spontaneous release, and are more likely to be influenced by the local elevation of [Ca2+]ss produced by a nearby Ca2+ spark.
The model also provides insights into nanoscopic Ca2+ signaling during release. Movie S2 shows how a small JSR results in a spherical 1 μM [Ca2+]i isosurface, while in Movie S1 the larger JSR causes lower [Ca2+]i on its back face (see also Fig. S5). Furthermore, peak [Ca2+]i just outside the subspace ranged from ∼1–12 μM depending on the relative position of the JSR. Additional barriers to diffusion not incorporated here, such as a mitochondrion abutting the back face of the JSR, could result in even higher local [Ca2+]i. These results may have implications for local Ca2+ sensing by mitochondria (91), CaMKII signaling (92), and Na+/Ca2+ exchanger activity (93, 94). Future work incorporating these components could advance our understanding of their individual contributions to cell function under normal and pathological conditions.
Acknowledgments
The work was supported by National Heart Lung and Blood Institute grants R01 HL105239, R01 HL106059, and F32 HL108604 and Deutsche Forschungsgemeinschaft grant no. KFO 155-TP4 (to S.E.L.). Research leading to these results has also received funding from the European Community’s Seventh Framework Program no. FP7/2007–2013 under grant agreement no. HEALTH-F2-2009-241526, EUTrigTreat.
Editor: Christopher Yip.
Footnotes
This is an open access article under the CC BY-NC-ND license (http://creativecommons.org/licenses/by-nc-nd/3.0/).
Mark A. Walker and George S. B. Williams contributed equally to this work.
Supporting Results, Supporting Materials and Methods, eleven figures, eleven equations, one table, and four movies are available at http://www.biophysj.org/biophysj/supplemental/S0006-3495(14)01159-X.
Supporting Material
Scale Bars, 2 μm.
Same spark as shown in Movie S1.
References
- 1.Cannell M.B., Cheng H., Lederer W.J. Spatial non-uniformities in [Ca2+]i during excitation-contraction coupling in cardiac myocytes. Biophys. J. 1994;67:1942–1956. doi: 10.1016/S0006-3495(94)80677-0. [DOI] [PMC free article] [PubMed] [Google Scholar]
- 2.Cheng H., Lederer W.J., Cannell M.B. Calcium sparks: elementary events underlying excitation-contraction coupling in heart muscle. Science. 1993;262:740–744. doi: 10.1126/science.8235594. [DOI] [PubMed] [Google Scholar]
- 3.Zima A.V., Bovo E., Blatter L.A. Ca²+ spark-dependent and -independent sarcoplasmic reticulum Ca²+ leak in normal and failing rabbit ventricular myocytes. J. Physiol. 2010;588:4743–4757. doi: 10.1113/jphysiol.2010.197913. [DOI] [PMC free article] [PubMed] [Google Scholar]
- 4.Santiago D.J., Curran J.W., Shannon T.R. Ca sparks do not explain all ryanodine receptor-mediated SR Ca leak in mouse ventricular myocytes. Biophys. J. 2010;98:2111–2120. doi: 10.1016/j.bpj.2010.01.042. [DOI] [PMC free article] [PubMed] [Google Scholar]
- 5.Sato D., Bers D.M. How does stochastic ryanodine receptor-mediated Ca leak fail to initiate a Ca spark? Biophys. J. 2011;101:2370–2379. doi: 10.1016/j.bpj.2011.10.017. [DOI] [PMC free article] [PubMed] [Google Scholar]
- 6.Williams G.S.B., Chikando A.C., Jafri M.S. Dynamics of calcium sparks and calcium leak in the heart. Biophys. J. 2011;101:1287–1296. doi: 10.1016/j.bpj.2011.07.021. [DOI] [PMC free article] [PubMed] [Google Scholar]
- 7.Brochet D.X.P., Xie W., Lederer W.J. Quarky calcium release in the heart. Circ. Res. 2011;108:210–218. doi: 10.1161/CIRCRESAHA.110.231258. [DOI] [PMC free article] [PubMed] [Google Scholar]
- 8.Sobie E.A., Guatimosim S., Lederer W.J. The Ca2+ leak paradox and rogue ryanodine receptors: SR Ca2+ efflux theory and practice. Prog. Biophys. Mol. Biol. 2006;90:172–185. doi: 10.1016/j.pbiomolbio.2005.06.010. [DOI] [PMC free article] [PubMed] [Google Scholar]
- 9.Qin J., Valle G., Fill M. Ryanodine receptor luminal Ca2+ regulation: swapping calsequestrin and channel isoforms. Biophys. J. 2009;97:1961–1970. doi: 10.1016/j.bpj.2009.07.030. [DOI] [PMC free article] [PubMed] [Google Scholar]
- 10.Cannell M.B., Kong C.H.T., Laver D.R. Control of sarcoplasmic reticulum Ca2+ release by stochastic RyR gating within a 3D model of the cardiac dyad and importance of induction decay for CICR termination. Biophys. J. 2013;104:2149–2159. doi: 10.1016/j.bpj.2013.03.058. [DOI] [PMC free article] [PubMed] [Google Scholar]
- 11.Li J., Imtiaz M.S., Laver D.R. β-Adrenergic stimulation increases RyR2 activity via intracellular Ca2+ and Mg2+ regulation. PLoS ONE. 2013;8:e58334. doi: 10.1371/journal.pone.0058334. [DOI] [PMC free article] [PubMed] [Google Scholar]
- 12.Chen H., Valle G., Volpe P. Mechanism of calsequestrin regulation of single cardiac ryanodine receptor in normal and pathological conditions. J. Gen. Physiol. 2013;142:127–136. doi: 10.1085/jgp.201311022. [DOI] [PMC free article] [PubMed] [Google Scholar]
- 13.Györke I., Györke S. Regulation of the cardiac ryanodine receptor channel by luminal Ca2+ involves luminal Ca2+ sensing sites. Biophys. J. 1998;75:2801–2810. doi: 10.1016/S0006-3495(98)77723-9. [DOI] [PMC free article] [PubMed] [Google Scholar]
- 14.Laver D.R., Honen B.N. Luminal Mg2+, a key factor controlling RYR2-mediated Ca2+ release: cytoplasmic and luminal regulation modeled in a tetrameric channel. J. Gen. Physiol. 2008;132:429–446. doi: 10.1085/jgp.200810001. [DOI] [PMC free article] [PubMed] [Google Scholar]
- 15.Qin J., Valle G., Fill M. Luminal Ca2+ regulation of single cardiac ryanodine receptors: insights provided by calsequestrin and its mutants. J. Gen. Physiol. 2008;131:325–334. doi: 10.1085/jgp.200709907. [DOI] [PMC free article] [PubMed] [Google Scholar]
- 16.Guo T., Gillespie D., Fill M. Ryanodine receptor current amplitude controls Ca2+ sparks in cardiac muscle. Circ. Res. 2012;111:28–36. doi: 10.1161/CIRCRESAHA.112.265652. [DOI] [PMC free article] [PubMed] [Google Scholar]
- 17.Reiken S., Gaburjakova M., Marks A.R. Protein kinase A phosphorylation of the cardiac calcium release channel (ryanodine receptor) in normal and failing hearts. Role of phosphatases and response to isoproterenol. J. Biol. Chem. 2003;278:444–453. doi: 10.1074/jbc.M207028200. [DOI] [PubMed] [Google Scholar]
- 18.Marx S.O., Reiken S., Marks A.R. PKA phosphorylation dissociates FKBP12.6 from the calcium release channel (ryanodine receptor): defective regulation in failing hearts. Cell. 2000;101:365–376. doi: 10.1016/s0092-8674(00)80847-8. [DOI] [PubMed] [Google Scholar]
- 19.Hashambhoy Y.L., Greenstein J.L., Winslow R.L. Role of CaMKII in RyR leak, EC coupling and action potential duration: a computational model. J. Mol. Cell. Cardiol. 2010;49:617–624. doi: 10.1016/j.yjmcc.2010.07.011. [DOI] [PMC free article] [PubMed] [Google Scholar]
- 20.Guo T., Zhang T., Bers D.M. Ca2+/calmodulin-dependent protein kinase II phosphorylation of ryanodine receptor does affect calcium sparks in mouse ventricular myocytes. Circ. Res. 2006;99:398–406. doi: 10.1161/01.RES.0000236756.06252.13. [DOI] [PubMed] [Google Scholar]
- 21.Marx S.O., Gaburjakova J., Marks A.R. Coupled gating between cardiac calcium release channels (ryanodine receptors) Circ. Res. 2001;88:1151–1158. doi: 10.1161/hh1101.091268. [DOI] [PubMed] [Google Scholar]
- 22.Groff J.R., Smith G.D. Ryanodine receptor allosteric coupling and the dynamics of calcium sparks. Biophys. J. 2008;95:135–154. doi: 10.1529/biophysj.107.119982. [DOI] [PMC free article] [PubMed] [Google Scholar]
- 23.Belevych A.E., Terentyev D., Gyorke S. Redox modification of ryanodine receptors underlies calcium alternans in a canine model of sudden cardiac death. Cardiovasc. Res. 2009;84:387–395. doi: 10.1093/cvr/cvp246. [DOI] [PMC free article] [PubMed] [Google Scholar]
- 24.Györke S. Molecular basis of catecholaminergic polymorphic ventricular tachycardia. Heart Rhythm. 2009;6:123–129. doi: 10.1016/j.hrthm.2008.09.013. [DOI] [PubMed] [Google Scholar]
- 25.Jiang D., Wang R., Chen S.R. Enhanced store overload-induced Ca2+ release and channel sensitivity to luminal Ca2+ activation are common defects of RyR2 mutations linked to ventricular tachycardia and sudden death. Circ. Res. 2005;97:1173–1181. doi: 10.1161/01.RES.0000192146.85173.4b. [DOI] [PubMed] [Google Scholar]
- 26.Gaur N., Rudy Y. Multiscale modeling of calcium cycling in cardiac ventricular myocyte: macroscopic consequences of microscopic dyadic function. Biophys. J. 2011;100:2904–2912. doi: 10.1016/j.bpj.2011.05.031. [DOI] [PMC free article] [PubMed] [Google Scholar]
- 27.Lee Y.-S., Liu O.Z., Sobie E.A. Parameter sensitivity analysis of stochastic models provides insights into cardiac calcium sparks. Biophys. J. 2013;104:1142–1150. doi: 10.1016/j.bpj.2012.12.055. [DOI] [PMC free article] [PubMed] [Google Scholar]
- 28.Franzini-Armstrong C., Protasi F., Ramesh V. Shape, size, and distribution of Ca2+ release units and couplons in skeletal and cardiac muscles. Biophys. J. 1999;77:1528–1539. doi: 10.1016/S0006-3495(99)77000-1. [DOI] [PMC free article] [PubMed] [Google Scholar]
- 29.Baddeley D., Jayasinghe I.D., Soeller C. Optical single-channel resolution imaging of the ryanodine receptor distribution in rat cardiac myocytes. Proc. Natl. Acad. Sci. USA. 2009;106:22275–22280. doi: 10.1073/pnas.0908971106. [DOI] [PMC free article] [PubMed] [Google Scholar]
- 30.Hayashi T., Martone M.E., Hoshijima M. Three-dimensional electron microscopy reveals new details of membrane systems for Ca2+ signaling in the heart. J. Cell Sci. 2009;122:1005–1013. doi: 10.1242/jcs.028175. [DOI] [PMC free article] [PubMed] [Google Scholar]
- 31.Wong J., Baddeley D., Soeller C. Nanoscale distribution of ryanodine receptors and caveolin-3 in mouse ventricular myocytes: dilation of T-tubules near junctions. Biophys. J. 2013;104:L22–L24. doi: 10.1016/j.bpj.2013.02.059. [DOI] [PMC free article] [PubMed] [Google Scholar]
- 32.Zhang H.-B., Li R.-C., Wang S.Q. Ultrastructural uncoupling between T-tubules and sarcoplasmic reticulum in human heart failure. Cardiovasc. Res. 2013;98:269–276. doi: 10.1093/cvr/cvt030. [DOI] [PubMed] [Google Scholar]
- 33.Wu H.-D., Xu M., Wang S.Q. Ultrastructural remodeling of Ca2+ signaling apparatus in failing heart cells. Cardiovasc. Res. 2012;95:430–438. doi: 10.1093/cvr/cvs195. [DOI] [PMC free article] [PubMed] [Google Scholar]
- 34.Wei S., Guo A., Song L.S. T-tubule remodeling during transition from hypertrophy to heart failure. Circ. Res. 2010;107:520–531. doi: 10.1161/CIRCRESAHA.109.212324. [DOI] [PMC free article] [PubMed] [Google Scholar]
- 35.Wagner E., Lauterbach M.A., Lehnart S.E. Stimulated emission depletion live-cell super-resolution imaging shows proliferative remodeling of T-tubule membrane structures after myocardial infarction. Circ. Res. 2012;111:402–414. doi: 10.1161/CIRCRESAHA.112.274530. [DOI] [PMC free article] [PubMed] [Google Scholar]
- 36.Brochet D.X.P., Yang D., Cheng H. Ca2+ blinks: rapid nanoscopic store calcium signaling. Proc. Natl. Acad. Sci. USA. 2005;102:3099–3104. doi: 10.1073/pnas.0500059102. [DOI] [PMC free article] [PubMed] [Google Scholar]
- 37.Hake J., Edwards A.G., McCulloch A.D. Modeling cardiac calcium sparks in a three-dimensional reconstruction of a calcium release unit. J. Physiol. 2012;590:4403–4422. doi: 10.1113/jphysiol.2012.227926. [DOI] [PMC free article] [PubMed] [Google Scholar]
- 38.Greenstein J.L., Winslow R.L. An integrative model of the cardiac ventricular myocyte incorporating local control of Ca2+ release. Biophys. J. 2002;83:2918–2945. doi: 10.1016/S0006-3495(02)75301-0. [DOI] [PMC free article] [PubMed] [Google Scholar]
- 39.Tran K., Smith N.P., Crampin E.J. A thermodynamic model of the cardiac sarcoplasmic/endoplasmic Ca2+ (SERCA) pump. Biophys. J. 2009;96:2029–2042. doi: 10.1016/j.bpj.2008.11.045. [DOI] [PMC free article] [PubMed] [Google Scholar]
- 40.Picht E., Zima A.V., Bers D.M. Dynamic calcium movement inside cardiac sarcoplasmic reticulum during release. Circ. Res. 2011;108:847–856. doi: 10.1161/CIRCRESAHA.111.240234. [DOI] [PMC free article] [PubMed] [Google Scholar]
- 41.Soeller C., Cannell M.B. Numerical simulation of local calcium movements during L-type calcium channel gating in the cardiac diad. Biophys. J. 1997;73:97–111. doi: 10.1016/S0006-3495(97)78051-2. [DOI] [PMC free article] [PubMed] [Google Scholar]
- 42.Peskoff A., Post J.A., Langer G.A. Sarcolemmal calcium binding sites in heart: II. Mathematical model for diffusion of calcium released from the sarcoplasmic reticulum into the diadic region. J. Membr. Biol. 1992;129:59–69. doi: 10.1007/BF00232055. [DOI] [PubMed] [Google Scholar]
- 43.Tencerová B., Zahradníková A., Gaburjáková M. Luminal Ca2+ controls activation of the cardiac ryanodine receptor by ATP. J. Gen. Physiol. 2012;140:93–108. doi: 10.1085/jgp.201110708. [DOI] [PMC free article] [PubMed] [Google Scholar]
- 44.Si, H. 2006. TETGEN, a quality tetrahedral mesh generator and 3D Delaunay triangulator. http://wias-berlin.de/software/tetgen/.
- 45.Alfonsi A., Cances E., Huisinga W. Adaptive simulation of hybrid stochastic and deterministic models for biochemical systems. ESAIM Proc. 2005;14:1–13. [Google Scholar]
- 46.Goecks J., Nekrutenko A., Taylor J. GALAXY: a comprehensive approach for supporting accessible, reproducible, and transparent computational research in the life sciences. Genome Biol. 2010;11:R86. doi: 10.1186/gb-2010-11-8-r86. [DOI] [PMC free article] [PubMed] [Google Scholar]
- 47.Smith G.D., Keizer J.E., Cheng H. A simple numerical model of calcium spark formation and detection in cardiac myocytes. Biophys. J. 1998;75:15–32. doi: 10.1016/S0006-3495(98)77491-0. [DOI] [PMC free article] [PubMed] [Google Scholar]
- 48.Picht E., Zima A.V., Bers D.M. SPARKMASTER: automated calcium spark analysis with IMAGEJ. Am. J. Physiol. Cell Physiol. 2007;293:C1073–C1081. doi: 10.1152/ajpcell.00586.2006. [DOI] [PubMed] [Google Scholar]
- 49.Brouwer A.E., Haemers W.H. Springer; New York: 2011. Spectra of Graphs. [Google Scholar]
- 50.Sobie E.A., Dilly K.W., Jafri M.S. Termination of cardiac Ca2+ sparks: an investigative mathematical model of calcium-induced calcium release. Biophys. J. 2002;83:59–78. doi: 10.1016/s0006-3495(02)75149-7. [DOI] [PMC free article] [PubMed] [Google Scholar]
- 51.Tan W., Fu C., Cheng H. An anomalous subdiffusion model for calcium spark in cardiac myocytes. Appl. Phys. Lett. 2007;91:183901. [Google Scholar]
- 52.Cheng H., Lederer W.J. Calcium sparks. Physiol. Rev. 2008;88:1491–1545. doi: 10.1152/physrev.00030.2007. [DOI] [PubMed] [Google Scholar]
- 53.Wier W.G., Egan T.M., Balke C.W. Local control of excitation-contraction coupling in rat heart cells. J. Physiol. 1994;474:463–471. doi: 10.1113/jphysiol.1994.sp020037. [DOI] [PMC free article] [PubMed] [Google Scholar]
- 54.Jafri M.S., Rice J.J., Winslow R.L. Cardiac Ca2+ dynamics: the roles of ryanodine receptor adaptation and sarcoplasmic reticulum load. Biophys. J. 1998;74:1149–1168. doi: 10.1016/S0006-3495(98)77832-4. [DOI] [PMC free article] [PubMed] [Google Scholar]
- 55.Winslow R.L., Rice J., O’Rourke B. Mechanisms of altered excitation-contraction coupling in canine tachycardia-induced heart failure, II: model studies. Circ. Res. 1999;84:571–586. doi: 10.1161/01.res.84.5.571. [DOI] [PubMed] [Google Scholar]
- 56.Gillespie D., Fill M. Pernicious attrition and inter-RyR2 CICR current control in cardiac muscle. J. Mol. Cell. Cardiol. 2013;58:53–58. doi: 10.1016/j.yjmcc.2013.01.011. [DOI] [PMC free article] [PubMed] [Google Scholar]
- 57.Shannon T.R., Ginsburg K.S., Bers D.M. Quantitative assessment of the SR Ca2+ leak-load relationship. Circ. Res. 2002;91:594–600. doi: 10.1161/01.res.0000036914.12686.28. [DOI] [PubMed] [Google Scholar]
- 58.Trafford A.W., Díaz M.E., Eisner D.A. Modulation of CICR has no maintained effect on systolic Ca2+: simultaneous measurements of sarcoplasmic reticulum and sarcolemmal Ca2+ fluxes in rat ventricular myocytes. J. Physiol. 2000;522:259–270. doi: 10.1111/j.1469-7793.2000.t01-2-00259.x. [DOI] [PMC free article] [PubMed] [Google Scholar]
- 59.van Oort R.J., Garbino A., Wehrens X.H. Disrupted junctional membrane complexes and hyperactive ryanodine receptors after acute junctophilin knockdown in mice. Circulation. 2011;123:979–988. doi: 10.1161/CIRCULATIONAHA.110.006437. [DOI] [PMC free article] [PubMed] [Google Scholar]
- 60.Liu N., Denegri M., Priori S.G. Abnormal propagation of calcium waves and ultrastructural remodeling in recessive catecholaminergic polymorphic ventricular tachycardia. Circ. Res. 2013;113:142–152. doi: 10.1161/CIRCRESAHA.113.301783. [DOI] [PubMed] [Google Scholar]
- 61.Denegri M., Bongianino R., Priori S.G. Single delivery of an adeno-associated viral construct to transfer the CASQ2 gene to knock-in mice affected by catecholaminergic polymorphic ventricular tachycardia is able to cure the disease from birth to advanced age. Circulation. 2014;129:2673–2681. doi: 10.1161/CIRCULATIONAHA.113.006901. [DOI] [PubMed] [Google Scholar]
- 62.Kohl T., Parlitz U., Lehnart S.E. Analysis of fluorescence microscopy super-resolution data of protein assemblies. Biophys. J. 2013;104:444a. [Google Scholar]
- 63.Yin C.C., Lai F.A. Intrinsic lattice formation by the ryanodine receptor calcium-release channel. Nat. Cell Biol. 2000;2:669–671. doi: 10.1038/35023625. [DOI] [PubMed] [Google Scholar]
- 64.Jiang D., Xiao B., Chen S.R. RyR2 mutations linked to ventricular tachycardia and sudden death reduce the threshold for store-overload-induced Ca2+ release (SOICR) Proc. Natl. Acad. Sci. USA. 2004;101:13062–13067. doi: 10.1073/pnas.0402388101. [DOI] [PMC free article] [PubMed] [Google Scholar]
- 65.Faloutsos, M., P. Faloutsos, and C. Faloutsos. 1999. On power-law relationships of the internet topology. Proceedings, SIGCOMM ‘99. Association for Computing Machinery, New York. 251–262.
- 66.Cozzo E., Ba R.A., Moreno Y. Contact-based social contagion in multiplex networks. Cond. Matter. 2013 doi: 10.1103/PhysRevE.88.050801. arXiv:1307.1656 [physics.soc-ph] [DOI] [PubMed] [Google Scholar]
- 67.Kannan N., Vishveshwara S. Identification of side-chain clusters in protein structures by a graph spectral method. J. Mol. Biol. 1999;292:441–464. doi: 10.1006/jmbi.1999.3058. [DOI] [PubMed] [Google Scholar]
- 68.Banerjee A., Jost J. Spectral plots and the representation and interpretation of biological data. Theory Biosci. 2007;126:15–21. doi: 10.1007/s12064-007-0005-9. [DOI] [PubMed] [Google Scholar]
- 69.Zhang S.-B., Zhou S.-Y., Lai J.-H. Phylogeny inference based on spectral graph clustering. J. Comput. Biol. 2011;18:627–637. doi: 10.1089/cmb.2009.0028. [DOI] [PubMed] [Google Scholar]
- 70.Ahmadlou M., Adeli H., Adeli A. New diagnostic EEG markers of the Alzheimer’s disease using visibility graph. J. Neural Transm. 2010;117:1099–1109. doi: 10.1007/s00702-010-0450-3. [DOI] [PubMed] [Google Scholar]
- 71.Youssef M., Scoglio C. An individual-based approach to SIR epidemics in contact networks. J. Theor. Biol. 2011;283:136–144. doi: 10.1016/j.jtbi.2011.05.029. [DOI] [PubMed] [Google Scholar]
- 72.Stern M.D., Song L.S., Ríos E. Local control models of cardiac excitation-contraction coupling. A possible role for allosteric interactions between ryanodine receptors. J. Gen. Physiol. 1999;113:469–489. doi: 10.1085/jgp.113.3.469. [DOI] [PMC free article] [PubMed] [Google Scholar]
- 73.Zima A.V., Picht E., Blatter L.A. Partial inhibition of sarcoplasmic reticulum Ca release evokes long-lasting Ca release events in ventricular myocytes: role of luminal Ca in termination of Ca release. Biophys. J. 2008;94:1867–1879. doi: 10.1529/biophysj.107.114694. [DOI] [PMC free article] [PubMed] [Google Scholar]
- 74.Stern M.D., Ríos E., Maltsev V.A. Life and death of a cardiac calcium spark. J. Gen. Physiol. 2013;142:257–274. doi: 10.1085/jgp.201311034. [DOI] [PMC free article] [PubMed] [Google Scholar]
- 75.Terentyev D., Nori A., Gyorke S. Abnormal interactions of calsequestrin with the ryanodine receptor calcium release channel complex linked to exercise-induced sudden cardiac death. Circ. Res. 2006;98:1151–1158. doi: 10.1161/01.RES.0000220647.93982.08. [DOI] [PubMed] [Google Scholar]
- 76.Tao T., O’Neill S.C., Zhang H. Alternans of cardiac calcium cycling in a cluster of ryanodine receptors: a simulation study. Am. J. Physiol. Heart Circ. Physiol. 2008;295:H598–H609. doi: 10.1152/ajpheart.01086.2007. [DOI] [PMC free article] [PubMed] [Google Scholar]
- 77.Bovo E., de Tombe P.P., Zima A.V. The role of dyadic organization in regulation of sarcoplasmic reticulum Ca2+ handling during rest in rabbit ventricular myocytes. Biophys. J. 2014;106:1902–1909. doi: 10.1016/j.bpj.2014.03.032. [DOI] [PMC free article] [PubMed] [Google Scholar]
- 78.George C.H., Jundi H., Lai F.A. Ryanodine receptors and ventricular arrhythmias: emerging trends in mutations, mechanisms and therapies. J. Mol. Cell. Cardiol. 2007;42:34–50. doi: 10.1016/j.yjmcc.2006.08.115. [DOI] [PubMed] [Google Scholar]
- 79.Knollmann B.C., Chopra N., Pfeifer K. Casq2 deletion causes sarcoplasmic reticulum volume increase, premature Ca2+ release, and catecholaminergic polymorphic ventricular tachycardia. J. Clin. Invest. 2006;116:2510–2520. doi: 10.1172/JCI29128. [DOI] [PMC free article] [PubMed] [Google Scholar]
- 80.Brunello L., Slabaugh J.L., Györke S. Decreased RyR2 refractoriness determines myocardial synchronization of aberrant Ca2+ release in a genetic model of arrhythmia. Proc. Natl. Acad. Sci. USA. 2013;110:10312–10317. doi: 10.1073/pnas.1300052110. [DOI] [PMC free article] [PubMed] [Google Scholar]
- 81.Lehnart S.E., Mongillo M., Marks A.R. Leaky Ca2+ release channel/ryanodine receptor 2 causes seizures and sudden cardiac death in mice. J. Clin. Invest. 2008;118:2230–2245. doi: 10.1172/JCI35346. [DOI] [PMC free article] [PubMed] [Google Scholar]
- 82.Chen W., Wang R., Chen S.R. The ryanodine receptor store-sensing gate controls Ca2+ waves and Ca2+-triggered arrhythmias. Nat. Med. 2014;20:184–192. doi: 10.1038/nm.3440. [DOI] [PMC free article] [PubMed] [Google Scholar]
- 83.Gómez A.M., Guatimosim S., Lederer W.J. Heart failure after myocardial infarction: altered excitation-contraction coupling. Circulation. 2001;104:688–693. doi: 10.1161/hc3201.092285. [DOI] [PubMed] [Google Scholar]
- 84.Domeier T.L., Blatter L.A., Zima A.V. Alteration of sarcoplasmic reticulum Ca2+ release termination by ryanodine receptor sensitization and in heart failure. J. Physiol. 2009;587:5197–5209. doi: 10.1113/jphysiol.2009.177576. [DOI] [PMC free article] [PubMed] [Google Scholar]
- 85.Ai X., Curran J.W., Pogwizd S.M. Ca2+/calmodulin-dependent protein kinase modulates cardiac ryanodine receptor phosphorylation and sarcoplasmic reticulum Ca2+ leak in heart failure. Circ. Res. 2005;97:1314–1322. doi: 10.1161/01.RES.0000194329.41863.89. [DOI] [PubMed] [Google Scholar]
- 86.Terentyev D., Györke I., Györke S. Redox modification of ryanodine receptors contributes to sarcoplasmic reticulum Ca2+ leak in chronic heart failure. Circ. Res. 2008;103:1466–1472. doi: 10.1161/CIRCRESAHA.108.184457. [DOI] [PMC free article] [PubMed] [Google Scholar]
- 87.Song L.-S., Sobie E.A., Cheng H. Orphaned ryanodine receptors in the failing heart. Proc. Natl. Acad. Sci. USA. 2006;103:4305–4310. doi: 10.1073/pnas.0509324103. [DOI] [PMC free article] [PubMed] [Google Scholar]
- 88.Izu L.T., Wier W.G., Balke C.W. Evolution of cardiac calcium waves from stochastic calcium sparks. Biophys. J. 2001;80:103–120. doi: 10.1016/S0006-3495(01)75998-X. [DOI] [PMC free article] [PubMed] [Google Scholar]
- 89.Weiss J.N., Nivala M., Qu Z. Alternans and arrhythmias: from cell to heart. Circ. Res. 2011;108:98–112. doi: 10.1161/CIRCRESAHA.110.223586. [DOI] [PMC free article] [PubMed] [Google Scholar]
- 90.Cheng H., Lederer M.R., Cannell M.B. Calcium sparks and [Ca2+]i waves in cardiac myocytes. Am. J. Physiol. 1996;270:C148–C159. doi: 10.1152/ajpcell.1996.270.1.C148. [DOI] [PubMed] [Google Scholar]
- 91.Lukyanenko V., Chikando A., Lederer W.J. Mitochondria in cardiomyocyte Ca2+ signaling. Int. J. Biochem. Cell Biol. 2009;41:1957–1971. doi: 10.1016/j.biocel.2009.03.011. [DOI] [PMC free article] [PubMed] [Google Scholar]
- 92.Fischer T.H., Neef S., Maier L.S. The Ca-calmodulin dependent kinase II: a promising target for future antiarrhythmic therapies? J. Mol. Cell. Cardiol. 2013;58:182–187. doi: 10.1016/j.yjmcc.2012.11.003. [DOI] [PubMed] [Google Scholar]
- 93.Jayasinghe I.D., Cannell M.B., Soeller C. Organization of ryanodine receptors, transverse tubules, and sodium-calcium exchanger in rat myocytes. Biophys. J. 2009;97:2664–2673. doi: 10.1016/j.bpj.2009.08.036. [DOI] [PMC free article] [PubMed] [Google Scholar]
- 94.Kekenes-Huskey P.M., Cheng Y., Michailova A.P. Modeling effects of L-type Ca2+ current and Na+-Ca2+ exchanger on Ca2+ trigger flux in rabbit myocytes with realistic T-tubule geometries. Front. Physiol. 2012;3:351. doi: 10.3389/fphys.2012.00351. [DOI] [PMC free article] [PubMed] [Google Scholar]
Associated Data
This section collects any data citations, data availability statements, or supplementary materials included in this article.
Supplementary Materials
Scale Bars, 2 μm.
Same spark as shown in Movie S1.