Abstract
This paper presents implementation details, system characterization, and the performance of a wearable sensor network that was designed for human activity analysis. Specific machine learning mechanisms are implemented for recognizing a target set of activities with both out-of-body and on-body processing arrangements. Impacts of energy consumption by the on-body sensors are analyzed in terms of activity detection accuracy for out-of-body processing. Impacts of limited processing abilities in the on-body scenario are also characterized in terms of detection accuracy, by varying the background processing load in the sensor units. Through a rigorous systems study, it is shown that an efficient human activity analytics system can be designed and operated even under energy and processing constraints of tiny on-body wearable sensors.
Keywords: Wearable Sensor Network, Activity Analytics, Machine Learning, Neural Network, On-body Processing
I. Introduction
Recent advances in low-cost and energy-efficient sensing and networking technology are opening up new possibilities for wearable medical diagnostics[1][2][3]. A number of tiny sensors, strategically placed on human body, can create a network that can monitor physical activities and vital signs, and provide real-time feedback analytics to medical service providers. Many patient diagnostic procedures can benefit from such continuous health monitoring for optimal management of chronic conditions and supervised illness recovery.
In this paper we report the results from a systems level study of a wearable sensor network applied for human activity analytics. A wearable sensor system with networked machine learning for activity identification was developed. Based on six data streams containing acceleration reading from three sensors, the system was trained for identifying 14 activities (i.e. lying down, sitting reclined, sitting up straight, standing, walking briskly and slowly, jogging, climbing stairs, riding a bike briskly and slowly, sweeping, jumping jacks, squatting, and bicep curls). Important design issues, including sensing, processing, data collection, energy efficiency, and application level accuracy are studied in the paper individually as well as in terms of their interdependencies in various operating conditions.
Motivation
Regular participation in physical activity provides many important health benefits, including reduced risk of coronary heart disease, hypertension, type II diabetes, obesity, several types of cancers, and loss of bone mass. Most of the evidence linking physical activity to health benefits has been based on self-reported, which often provides an index of all four components of activity (frequency, duration, intensity, and type). Such self-reports do not indicate the fine granularity (i.e., breakdown for the time spent on different activities) information which can substantially enhance the assessment accuracy of metabolic energy expenditures due to physical activity. A wearable activity identification system can provide quantifiable fine-grain activity information from day-to-day life, enabling remote assessment and epidemiologic/clinical research in an automated manner. Such a system can also enable real-time remote monitoring of soldiers, elderly population, and athletes during sporting events.
Objectives
The objective of this study is to: a) develop a wearable system that is capable of collecting and streaming acceleration samples out of on-body sensors over a wireless link, b) develop machine learning mechanisms for recognizing a target set of activities, c) characterize sensor energy consumption, identification accuracy, and their trade-offs, and d) characterize the impacts of processing constraint on the sensors and its impact of activity detection accuracy.
II. System Architecture
A. Sensor Network
Each wearable sensor is a small 6cm × 3.2cm × 1.5cm package, weighing approximately 20 grams. As shown in Fig. 1, the package contains a sensor subsystem (MTS310 from MemSic Inc.) and a processor and radio subsystem (Mica2 motes), running TinyOS operating system. Batteries weigh approximately 13 grams and are attached separately. For each sensor package, two 600mAh AAAA batteries are able to support the system for more than 30 hours.
Fig. 1. Wearable sensor network for activity analysis.
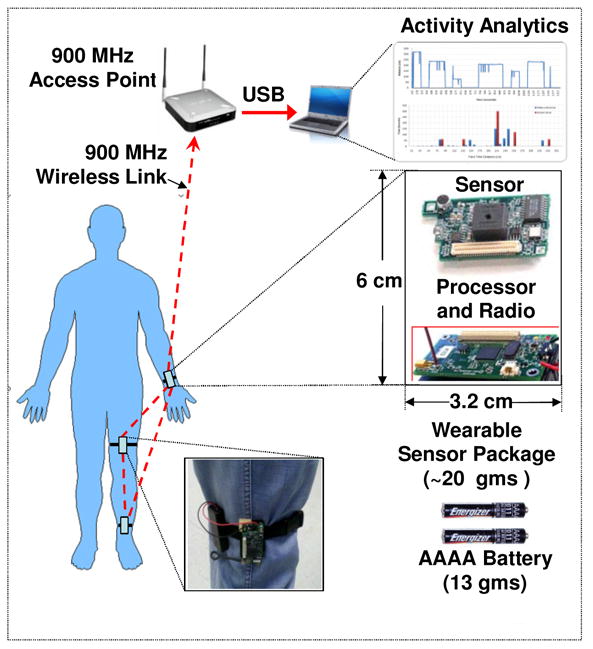
A sensor package is worn with an elastic band so that once worn, the sensor orientation does not change with respect to the body segments. Three sensor packages are worn on ankle, thigh, and wrist of the same side of the body. Fig. 1 shows the picture of a thigh-worn sensor package. Once activated, each sensor package continuously samples its acceleration (-2g to +2g) in two axes and sends them to a nearby (within 50 meters) laptop computer using a 900MHz wireless link via an access point. Activity analytics are performed either on-body in the sensors, or out-of-body in the laptop. As shown in the diagram, the sensor nodes form an ad hoc sensor network with dynamic reconfigurable mesh topology.
B. Medium Access Control
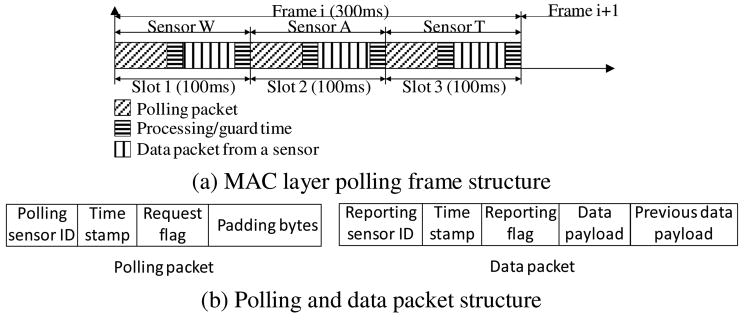
A collision-free TDMA MAC protocol is used for radio communication. As shown in Fig. 2:a, the access point is programmed to send periodic polling packets to sensors W, A, and T, referring to those on the wrist, ankle, and thigh respectively. Upon reception of a polling packet, a sensor sends its data packet out (either to another sensor or to the access point). A guard time is allocated between the polling and data packets in order to accommodate clock drifts and processing latencies. Frame duration of 300 ms is used in the polling process. A packet occupies approximately 30ms, and the allocated guard time is approximately 20ms.
Fig. 2. TDMA MAC layer for on- and off-body communication.
Fig. 2:b depicts the polling and data packet structures. In a polling packet, the Polling Sensor ID represents the sensor that is being polled, and the sent Time Stamp captures the current time of the access point. The polled sensor returns this Time Stamp as is with the sampled acceleration data, thus enabling the receivers to synchronize data samples from all three sensors with reference to the Access Point's time. The Request Flag is used to indicate the requested type of data. Finally, the Padding Bytes are inserted to keep its size equal to that of the data packets.
In a data packet, the Reporting Sensor ID represents the sending node's identity, and the Time Stamp contains the same value in the corresponding received polling packet. The Request Flag is used to indicate the type of data being sent. As shown in Fig. 2:b, the data part of the packet contains two components: 1) Data Payload, consisting of 3 most recent acceleration samples (4 bytes each) which are being sent for the first time, 2) Previous Data Payload, consisting of 3 previous samples that were already sent as the Data Payload in the last frame. In other words, there is a three-sample overlapping redundancy from each sensor over consecutive frames.
In the event of a polling packet or data packet loss, a recipient sensor (or access point) can recover data up to a certain extent due to that redundantly. Meaning, the effective data loss rate is lower than the packet loss rate. For a given packet loss, a data loss would occur only when two consecutive packets get lost. Therefore, for a packet loss rate p, the effective data loss rate P can be expressed as P = p2. For example, for a packet loss rate of 5%, the effective data loss rate is 0.25%, which is a significant improvement.
C. Transmission Power Control
A transmission power control [4] protocol is developed for on-body-sensor to out-of-body access point radio links for reducing energy consumption. A measurement based link power control with closed-loop feedback control techniques is used. The mechanism requires to: a) measure and record packet drop rates and the radio Signal Strength Indicator (RSSI) on a wireless link with varying transmission power, b) develop a model for channel behavior based on measured data, and c) employ a feedback control instruction from receiver to transmitter for adjusting transmission power based on current transmission power, channel model, and the difference between current RSSI and a targeted RSSI range.
D. Processing Modes
Activity analytics is categorized into two processing modes, namely on-body and out-of-body. For out-of-body, all sensor data is wirelessly collected to an out-of-body machine which is used for the analysis. In on-body scenarios, analysis is performed at the sensor nodes themselves, either at a single node or at multiple nodes for improved load distribution. From an application standpoint, on-body processing is more suitable for outdoor applications since a separate processing server may not usually be available. In indoor settings, however, such servers may be available and therefore out-of-body applications can be supported. This paper presents activity analysis implementation and performance for both on-body and out-of-body scenarios.
III. Data Collection
This section presents collected acceleration data for out-of-body activity analytics. Each of three sensors in Fig. 1 is equipped with an ADXL202 accelerometer, which is able to detect acceleration up to ±2g with a granularity of 300mV/g, and the attached A/D converter has a resolution of 10 bits; thus a 0.01g resolution can be achieved using 3V power supply. Based on previous results reported in [5][6], such resolution is expected to be sufficient for activity analytics as targeted in this study. ADXL202 is able to provide linear output within the range of ±2g. Each sensor is programmed to sample acceleration at the rate of 10Hz. According to [7], majority of the spectral energy (computed through Fast Fourier Transform) for daily activities is found between 0.3Hz and 3.5Hz. Therefore, the 10Hz sampling rate is expected to be able to capture most of the activities and provide satisfactory accuracy.
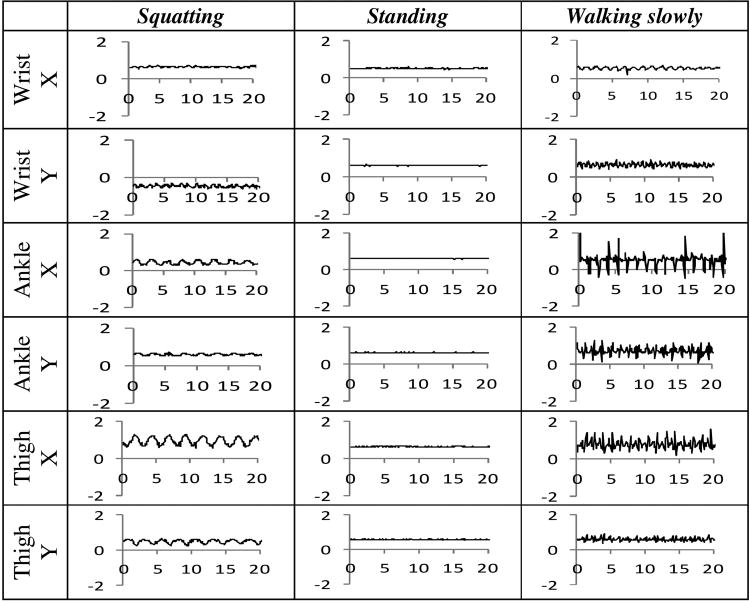
Six acceleration data streams from three sensors (two axes) are collected for all fourteen activities, namely, lying down, sitting reclined, sitting up straight, standing, walking briskly and slowly, jogging, climbing stairs, riding a bike briskly and slowly, sweeping, jumping jacks, squatting, and bicep curls. Fig. 3 demonstrates data from three representative activities, namely, standing, squatting, and walking slowly. The horizontal axis is time in seconds, and the vertical axis shows acceleration in the unit of g. The vertical bias in the graphs is due to the gravity.
Fig. 3. Acceleration data streams for three representative activities.
IV. Machine Learning
This section presents out-of-body supervised machine learning mechanisms for activity recognition using the system.
A. Learning Features
Mean and entropy of acceleration, computed over overlapping time windows, are used as the machine learning features for activity detection. Mean and entropy are computed for each of the six acceleration streams as shown in Fig. 3. Mean contains the DC value of the signal and entropy captures the intensity of activities during each computation window. As a feature, entropy was chosen over raw acceleration values because of its lower dimensionality within a window. This simplifies the classifier design and acts as a more scalable feature for machine learning compared to raw acceleration data. The features are computed on windows of 42 consecutive samples, representing 4.2 seconds at 10Hz sampling rate. Overlapped sliding windows are used so that 50% of the samples in a window overlap with those in the previous window. A 4.2s window size was chosen based on previous studies [8][9] with good identification performance using window size spanning 2 to 5 seconds with 50% overlapping.
For calculating entropy, acceleration samples within a window are first placed into a number of non-overlapping bins covering the entire data range. Entropy is defined as: [10], where xi represents the ith bin, and p(xi) indicates the probability that an accelerometer reading falls into bin xi. Hence, log p(xi) indicates the amount of information derived when an accelerometer reading falls into bin xi; when the base number is 2, log p(xi) is in the unit of bits. Consequently, entropy H(X) represents the expected amount of information within a window. Generally, it is positively correlated with the intensity of activity. Comparing to standard deviation, entropy can be calculated using different bin sizes, which would facilitate our future research on system load.
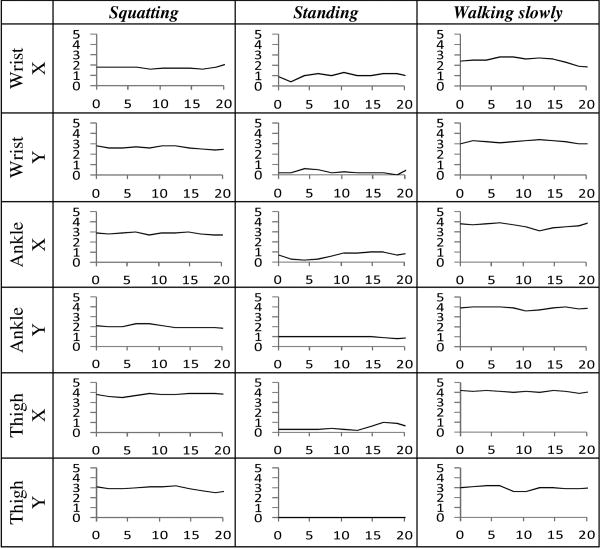
Fig. 4 reports computed entropy for all six acceleration data streams corresponding to the representative activities shown in Fig. 3. It can be generally observed that for a given activity, the sensors in low-activity parts of the body produce low entropy values. For example, while standing, the entropies for all sensor streams are generally low - indicating mild variation of acceleration data during standing. Another example is the Y-axis acceleration from the ankle sensor during squatting and standing. The entropy stream from that sensor while squatting produces larger values compared to standing, thus indicating higher levels of variations of the ankle acceleration during squatting. Consistent observations were made for all six entropy streams produced by all fourteen activities.
Fig. 4. Entropy streams for the representative activities.
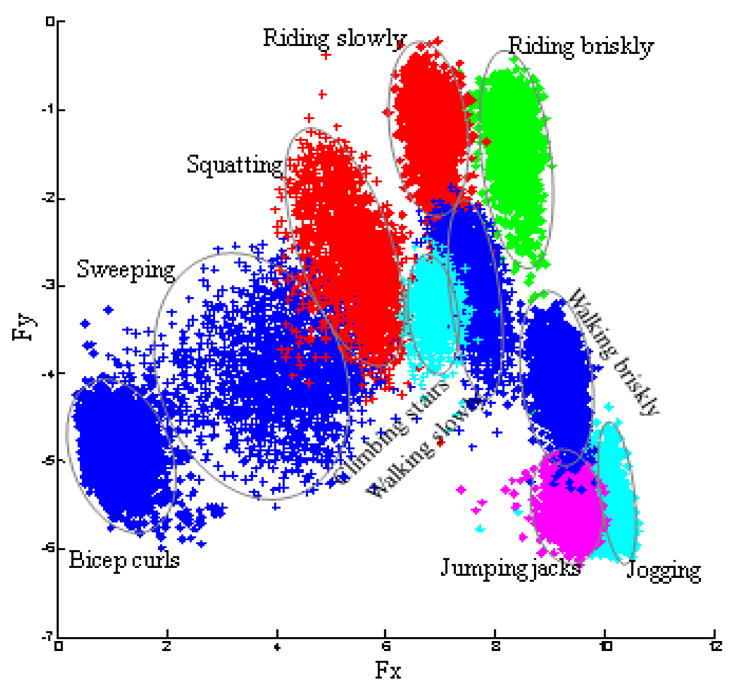
In order to investigate how the dynamic activities are separated in their feature space, we conducted Principal Component Analysis (PCA) [11] that reduces the number of features (i.e. entropy) from six (i.e. X-axis and Y-axis entropies from each of the three sensors) to two. The reduced features are computed as F = PV, where P is an Eigen vector of the scatter matrix of the samples, and V is a vector of the original features (i.e. entropies). These are derived as:
Fig. 5 depicts the reduced feature space in the Fx-Fy plane for the dynamic activities. The two horizontal vectors are two Eigen vectors of the scatter matrix of the extracted entropy with largest Eigen values, and they best represent the clusters. Fig. 5 clearly demonstrates that the dynamic activities form fairly non-overlapping clusters in the Fx-Fy feature plane. This provides visual evidence that entropy is an effective feature for expecting good recognition accuracy from machine learning.
Fig. 5. Principal Component Analysis for 10 dynamic activities.
B. Classifier Layering
The fourteen target activities are divided into two categories, namely static and dynamic. Lying down, sitting reclined, sitting up straight and standing would fall into the static category, and the other ten activities would be in the dynamic category.
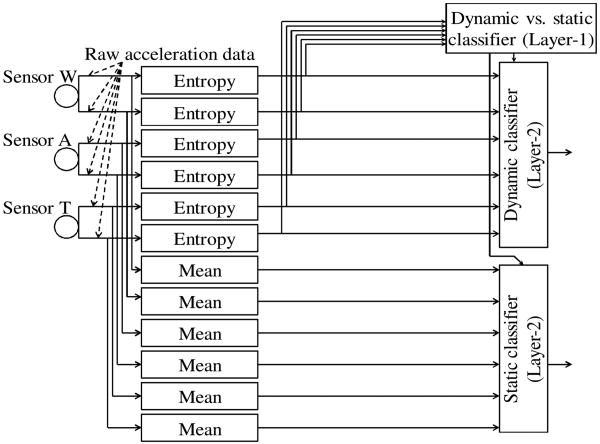
As shown in Fig. 6, a two layer hierarchical classifier mechanism with different feature usage is used. This is in contrast to using a single classifier with both mean and entropy as its useable features. This approach was used because increasing dimensionality does not always improve classification accuracy, and less number of features can often lead to simplified and more manageable classifier design [11].
Fig. 6. Hierarchical classifier layering.
In Fig. 6, a classifier in the first layer would classify static versus dynamic activities using entropy as the input. The first classifier in the second layer for dynamic activity recognition also uses entropy as the input. The classifier for static activity recognition, however, uses mean acceleration as the input. Those classifiers in the second layer work mutually exclusively, meaning the result would be chosen only from one of them based on the outcome of the layer-1 classifier. Different machine learning algorithms, including, Neural Networks, Decision Tree (J48) and Naïve Bayes, were separately experimented with as the layer-1 and layer-2 classifiers. The Machine Learning Toolkit Weka [12] was used for implementing the classifiers here.
V. Experimental evaluation
For each learning algorithm, all three classifiers were trained with data obtained from the system worn by a subject set of 10 people, consisting of 5 male and 5 female between 22 to 30 years of age. Each subject performed 4 sessions, and each session includes all 14 activities. During each session, a subject was asked to wear the networked sensor system and to perform each activity for 2 minutes. The acceleration sampling rate was 10Hz for each of the sensors. After evaluating a number of classifiers, including Nearest Neighbor, Support Vector Machine, Neural networks, Decision Tree (J48) and Naïve Bayes, it was found that Neural Networks, Decision Tree (J48), and Naïve Bayes provide the best accuracy for this particular application. Neural Networks provided in Weka is a multilayer perceptron, which deploy a feed-forward artificial neural network and use supervised back-propagation for training. In our experiments, 15 hidden neurons are used in the network.
Table 1 presents recognition accuracy of the layer-1 classifier in Fig. 6 that classifies dynamic and static activities. For this and all subsequent results, accuracy is reported in a subject-independent manner by training the classifier based on the data collected on 9 subjects, and testing it on the last subject. This procedure is repeated ten times, each time for a different test subject. Average accuracy from ten such runs is reported.
Table 1. Recognition accuracy for dynamic vs. static classifier.
| Classifier | Accuracy (%) | |
|---|---|---|
| Dynamic vs. static | Neural Network | 100 |
| Decision Trees | 99.94 | |
| Naïve Bayes | 99.99 |
Table 2 reports the recognition accuracy of the layer-2 classifier in Fig. 6 that classifies 10 dynamic activities based on entropy. Accuracy for 4 test subjects using all three classifiers is presented in the table. Results for the other six test subjects showed similar recognition accuracy for the dynamic activities. Results indicate that all three chosen classifiers are able to provide above 90% detection accuracies for most of the subjects.
Table 2. Recognition accuracy for dynamic activities.
| Classifier | Accuracy (%) | |
|---|---|---|
| Subject 1 | Neural Network | 95.61 |
| Decision Trees | 94.98 | |
| Naïve Bayes | 95.38 | |
| Subject 2 | Neural Network | 94.99 |
| Decision Trees | 94.36 | |
| Naïve Bayes | 94.77 | |
| Subject 3 | Neural Network | 95.17 |
| Decision Trees | 92.99 | |
| Naïve Bayes | 97.50 | |
| Subject 4 | Neural Network | 94.65 |
| Decision Trees | 89.55 | |
| Naïve Bayes | 93.27 |
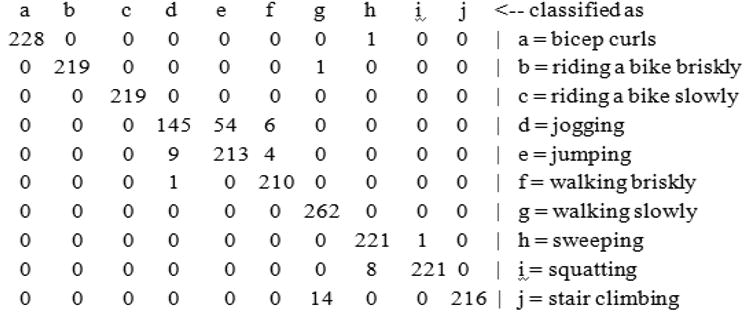
Further details about the recognition inaccuracies for the layer-2 dynamic classifier are shown in the form a confusion matrix (for Subject 1 using Neural Networks) in Fig. 7. It can be seen that 100% accuracy can be achieved for riding bike slowly and walking slowly, while for the other activities, accuracy could be lower. For instance, accuracy for jogging is only 71%, as 26% of the instances are confused with jumping jacks, which indicates that the decision boundary between jogging and jumping jacks is not as clear as other boundaries.
Fig. 7. Confusion matrix for the dynamic activity classification.
Finally, Table 3 demonstrates recognition accuracy of the layer-2 static classifier in Fig. 6 that classifies 4 static activities based on mean acceleration data. Detection accuracy for the static activities is always near 100% for the reported four and all other subjects in our experiments.
Table 3. Recognition accuracy for static activities.
| Classifier | Accuracy (%) | |
|---|---|---|
| Subject 1 | Neural Network | 100 |
| Decision Trees | 100 | |
| Naïve Bayes | 100 | |
| Subject 2 | Neural Network | 100 |
| Decision Trees | 94.31 | |
| Naïve Bayes | 100 | |
| Subject 3 | Neural Network | 100 |
| Decision Trees | 100 | |
| Naïve Bayes | 100 | |
| Subject 4 | Neural Network | 100 |
| Decision Trees | 94.10 | |
| Naïve Bayes | 100 |
VI. Energy-Accuracy Trade-off
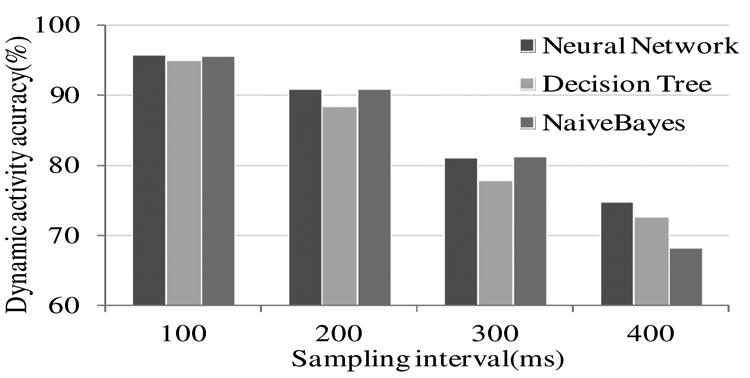
Energy efficiency of the networked sensor system and its implications on activity recognition accuracy is studied in this section. Fig. 8 reports accuracy of the layer-2 classifier for dynamic activity recognition, when the acceleration sampling rates of the wearable sensors are changed. As expected, with lower sampling rates (i.e. higher intervals) the overall accuracy degrades for all three classifiers in a linear manner.
Fig. 8. Classification accuracy vs. sampling interval.
In order to establish the connection between sensor sampling rate and its impacts on energy consumption due to variable radio transmissions, experiments were performed for measuring the run-time current consumption by the on-body sensors. As shown in Fig. 9, a 1Ω resistor is inserted into the power supply circuit, and the voltage across the resistor is monitored by an oscilloscope. The typical baseline current consumption of an on-body sensor unit is around 20mA, and around 35mA during radio transmissions; the resulting equivalent resistance is around 100Ω. The input impedance of the oscilloscope is 1MΩ. Therefore, the 1Ω resistor causes very minimal impact on the system power consumption. The current consumption by the sensors package is first computed from the voltage across the 1Ω resistor, and then the power consumption is estimated based on the supply voltage and measured current.
Fig. 9. Power monitoring arrangement.
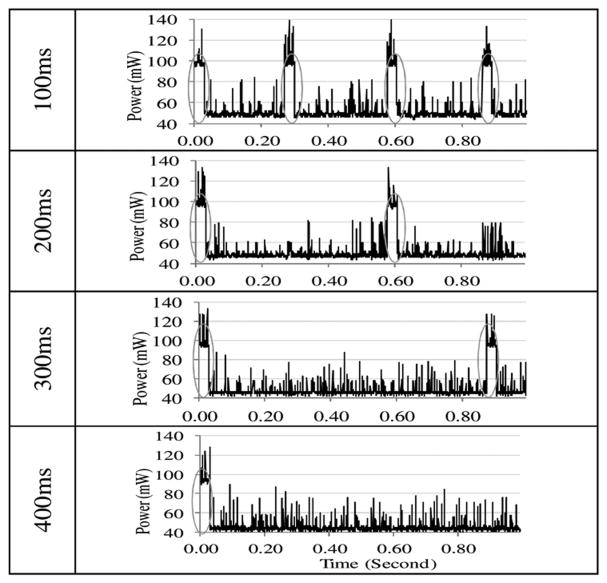
Fig. 10 depicts the sensor power consumption traces for different acceleration sampling intervals. Each gray ellipse in the graphs indicates the surge of consumption due to a radio packet transmission. With higher sampling rates (e.g. lower intervals), more such surges occur due to more frequent packet transmissions, thus causing higher overall power consumption.
Fig. 10. Power consumption traces for different sampling rates.
As observed in Fig. 10, since a given power budget for the on-body sensors bounds the maximum rate at which acceleration can be sampled (and radio packets can be sent), it also dictates the resulting activity detection accuracy.
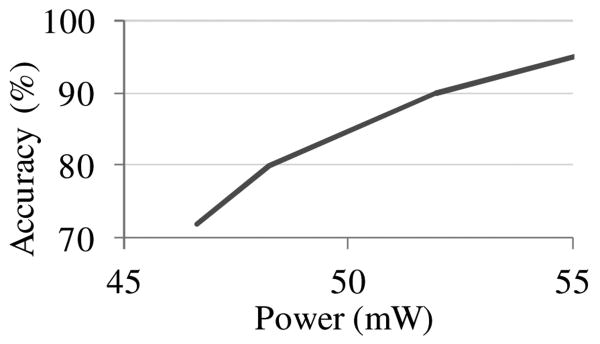
Maximum detection accuracy for off-body activity analysis for a given per-sensor power budget is shown in Fig. 11. The reported accuracy represents average over three different classifiers, namely, Neural Network, Decision tree (J48) and Naïve Bayes. As expected, better detection accuracy can be achieved via higher power consumption at the sensor nodes.
Fig. 11. Activity recognition as function of power consumption.
VII. Networked On-Body Analytics
Study for on-body detection is presented in this Section
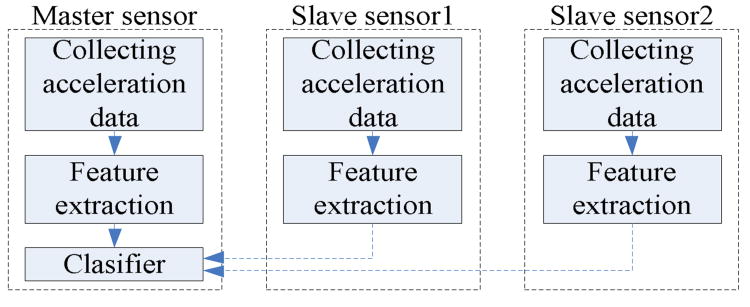
One of the on-body sensors, chosen dynamically, is designated as the master node for data processing. As shown in Fig. 12, two of the three on-body sensors designated as the slave units sample their own acceleration data and extracts features (i.e. mean and entropy) before sending them to the designated master using the MAC protocol described in Section II. The master sensor also collects its own acceleration and computes the corresponding features. Once sufficient amount (i.e. 4.2s worth) of feature data is available at the master unit, it executes a previously trained decision tree classifier to recognize the current activity and then periodically sends the detected activity to an access point, when available in range. Decision tree was chosen for its lower computational complexity.
Fig. 12. On-body processing model.
Given that the processor on the on-body sensors are generally cycle-limited, and the activity analytics is expected to share the CPU with other applications [13], the amount of total processing load is expected to impact the activity detection accuracy in the on-body processing mode. Impacts of such background load on activity detection accuracy are studied in this subsection, and all the results shown above have no background load.
While executing the decision tree based classifier (which was trained off-body), a synthetic background load generating process was executed. The background load comprised of periodic multiplication of two 4×4 unsigned 32-bit integer matrices. It was observed that each matrix multiplication takes 1.5ms. Multiplications are carried out with exponentially distributed periodicity and duration, for which the mean is changed for varying the effective background load. Background load is expressed in percentage as the mean execution time of each multiplication operation over the mean interval between two consecutive multiplications. Consequently, background load is executed in addition to the posture recognition application.
The effects of background load are depicted in Fig. 13:a. Experimental analysis revealed that the loss of detection accuracy is primarily due to sampling irregularities and sample losses caused by the background process. The detection process uses a 100ms periodic timer for sampling acceleration data. It turns out that increased background load can: 1) insert large timing jitter for the 100ms sampling timer, and 2) subsequently reduce the effective number of samples within each 4.2s entropy computation window. Therefore, the assumption used in [13][14] that a modularized criteria may not be valid.
Fig. 13. Loss of detection accuracy due to limited processing cycles.

These effects which cause the loss of detection accuracy are shown in Fig. 13:b. The sample interval variation in Fig. 13:b reports effect-1 above, which is sample interval variance caused by the background process. And the sample loss rate represents effect-2 in terms of the fraction of samples that were pushed out of the 4.2s window by the background load. Deterioration of both these quantities with higher background load explains the loss of accuracy. Note that the impacts of background load appeared to be significantly more pronounced for the dynamic activities, which is why Fig. 13 reports only the dynamic case. Since the static detection uses mean as the only feature, sample loss and irregularities did not affect the accuracy much.
VIII. Related Work
Human activity recognition research have appeared in the literature primarily from an out-of-body analysis standpoint. The work in [8] collects annotated acceleration data from 20 subjects, and then different classifiers were deployed to analyze the data. It was shown that a decision tree classifier provides the best accuracy, and the sensors on thigh and wrist are most important for high accuracy. The approach in [9] implemented a real-time out-of-body decision tree algorithm that provided high accuracy using subject-dependent training. The system developed in [13], which is called Titan, is also used in [14]. When a task is inserted, the Network Manager would inspect the capabilities of the sensor nodes, and insert it into a node accordingly.
In contrast to those work in the literature, our approach in this paper is to develop a systems study that, in addition to developing activity analytics classifiers, characterizes energy and processing constraints of the on-body sensor units. The impacts of energy consumption by the sensors on out-of-body activity detection accuracy are analyzed by varying the acceleration sampling rate, and its subsequent energy overhead due to data reporting requirement over radio links. Subsequently, on-body activity detection accuracy in the presence of processing load constraints is characterized by modeling and stochastically varying the background processing loads on sensors.
To our knowledge, this is the first work to report a systematic approach towards designing a networked wearable sensor system with energy and processing considerations.
IX. Summary and Ongoing Work
This paper reported the design and systems level details of a wearable sensor network that is capable of monitoring human activity dynamics for remote health monitoring applications. An elaborate machine learning mechanism was used to demonstrate that accurate activity analytics can be performed both on-body and off-body. It was also demonstrated that the detection accuracy can be traded for reducing energy expenditure at the sensor nodes. Other systems performance including how the background CPU load in the sensors can affect the detection accuracy in the off-body processing mode was also presented. Ongoing work on this topic includes: 1) developing various other applications, including an automatic on-body eating detection system, and 2) developing a middleware framework for autonomous process migration for switching between on-body and off-body processing modes based on available energy and processing resources.
Acknowledgments
This project is supported by NIH grant HL093395
Contributor Information
Bo Dong, Email: dongbo@egr.msu.edu.
Subir Biswas, Email: sbiswas@egr.msu.edu.
References
- 1.Wu WH, Bui AA, Batalin MA, Liu D, Kaiser WJ. Incremental Diagnosis Method for Intelligent Wearable Sensor Systems. IEEE Transactions on Information Technology in Biomedicine. 2007 Sep;11(no. 5):553–562. doi: 10.1109/titb.2007.897579. [DOI] [PubMed] [Google Scholar]
- 2.Wu W, Bui A, Batalin M, Au L, Binney J, Kaiser w. MEDIC: Medical embedded device for individualized care. Artif Intell Med. 2008 Feb;42(no. 2):137–152. doi: 10.1016/j.artmed.2007.11.006. [DOI] [PubMed] [Google Scholar]
- 3.Hung K, Zhang YT, Tai B. Wearable medical devices for tele-home healthcare. 26th Annual International Conference of the IEEE Engineering in Medicine and Biology Society, 2004 IEMBS ′04; 2004. pp. 5384–5387. [DOI] [PubMed] [Google Scholar]
- 4.Quwaider M, Rao J, Biswas S. Transmission power assignment with postural position inference for on-body wireless communication links. ACM Transactions on Embedded Computing Systems. 2010 Aug;10:1–27. [Google Scholar]
- 5.Maurer U, Smailagic A, Siewiorek DP, Deisher M. Activity Recognition and Monitoring Using Multiple Sensors on Different Body Positions. :113–116. [Google Scholar]
- 6.Quwaider M, Rao J, Biswas S. Body-posture-based dynamic link power control in wearable sensor networks. IEEE Communications Magazine. 2010 Jul;48(no. 7):134–142. [Google Scholar]
- 7.Sun M, Hill JO. A method for measuring mechanical work and work efficiency during human activities. Journal of Biomechanics. 1993 Mar;26(no. 3):229–241. doi: 10.1016/0021-9290(93)90361-h. [DOI] [PubMed] [Google Scholar]
- 8.Bao L, Intille SS. Activity Recognition from User-Annotated Acceleration Data. In: Ferscha A, Mattern F, editors. Pervasive Computing. Vol. 3001. Berlin, Heidelberg: Springer Berlin Heidelberg; 2004. pp. 1–17. [Google Scholar]
- 9.Tapia EM, et al. Real-Time Recognition of Physical Activities and Their Intensities Using Wireless Accelerometers and a Heart Rate Monitor. 2007 11th IEEE International Symposium on Wearable Computers; 2007. pp. 37–40. [Google Scholar]
- 10.Gray RM. Entropy and Information Theory. 1st. Springer; 1990. [Google Scholar]
- 11.Duda RO, Hart PE, Stork DG. Pattern Classification. 2nd. Wiley-Interscience; 2000. [Google Scholar]
- 12.Hall M, Frank E, Holmes G, Pfahringer B, Reutemann P, Witten IH. The weka data mining software. ACM SIGKDD Explorations Newsletter. 2009 Nov;11:10. [Google Scholar]
- 13.Roggen D, Stäger M, Tröster G, Lombriser C. Titan: A Tiny Task Network for Dynamically Reconfigurable Heterogeneous Sensor Networks. 2007:127–138. [Google Scholar]
- 14.Zappi P, et al. Activity Recognition from On-Body Sensors: Accuracy-Power Trade-Off by Dynamic Sensor Selection. In: Verdone R, editor. Wireless Sensor Networks. Vol. 4913. Berlin, Heidelberg: Springer Berlin Heidelberg; 2008. pp. 17–33. [Google Scholar]


