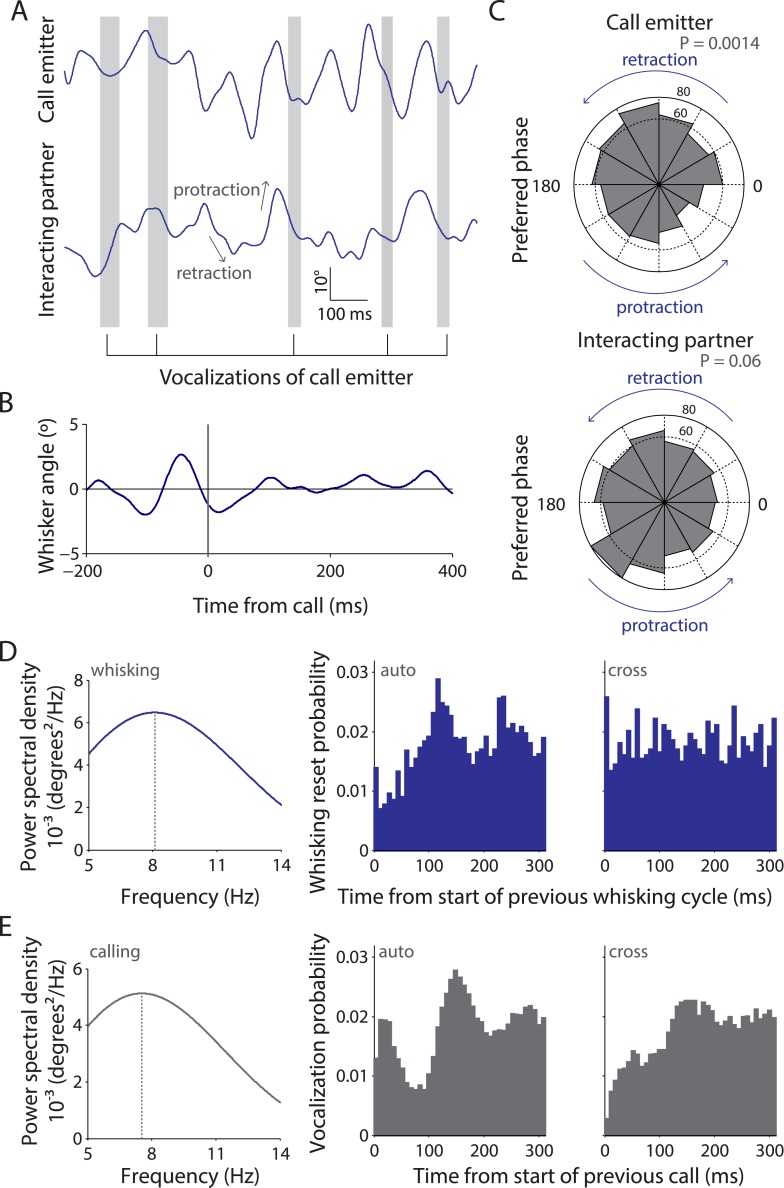
Figure 2. Whisking and vocalization are coordinated during facial touch.
(A) Sample whisker traces of a call emitter (top) when aligned to its own vocalizations (gray bars) indicate a correlation with the retraction phase of the whisker. This was not the case with the whisker trace of the interacting partner (bottom). (B) Call-triggered whisking average wherein the average of all whisking traces is aligned with respect to the emitter's call onset. (C) Distribution of call onsets were significantly non-uniform (Hodges–Anje test) relative to whisking cycle of emitter itself (top) but not for the interacting partner (bottom). There appears to be a substantial bias for calls during the retraction phase of the emitter's whisking (top) unlike for calls during the interacting partner's whisking (bottom). (D) Predominant whisking rates determined by power spectral density of whisker traces during social touch is 8.1 Hz (left). Distribution of time intervals between whisking cycles within one animal (auto) correspondingly shows a peak at ca. 112 ms (middle). Points of maximum protraction were used for binning. Inter-animal (cross) whisking interval distribution suggests that the interacting animals do not whisk with a fixed phase relationship (right). (E) Power spectral density analysis to determine the predominant calling rates revealed a 7.6 Hz predominant frequency component (left). The distribution of time intervals between start of two subsequent vocalizations peaks around 144 ms (‘auto’, middle). The effect is not as pronounced when triggering to calls that were assigned to a different animal (‘cross’, right).

