

Abstract
Context
Symptoms and quality of life (QOL) are critically important in hematopoietic stem cell transplantation (HSCT). However, few studies have examined these factors by transplant type among diverse cultures.
Objectives
To identify and compare QOL and symptom severity and prevalence by transplant type in a diverse population having HSCT.
Methods
The M. D. Anderson Symptom Inventory Blood and Marrow Transplantation (MDASI-BMT) module measured symptom severity and its impact. The Functional Assessment of Cancer Therapy-Bone Marrow Transplant (FACT-BMT) measured QOL.
Results
Symptom data were collected from 164 patients at eight points (pretransplant to 100 days post-transplant) and QOL data at four times. Over time, symptom severity was significantly correlated with QOL and patients who had allogeneic transplants with myeloablative regimens showed more severe sleep disturbance and poorer QOL than patients having autologous transplants. Male patients reported less fatigue than female patients. However, ethnicity was not significant. Patients whose functional status was good had fewer of the five worst symptoms and higher QOL than patients with a poor functional status. Patients with acute graft-versus-host disease had more severe symptoms than those who did not.
Conclusion
Type of transplant and preparative regimen are the most important aspects to consider when managing symptoms and QOL. This information is important for providing anticipatory guidance and support needed during the transplantation experience, to explore in future research the mechanisms involved in symptoms after HSCT, and to develop additional effective interventions.
Keywords: Hematopoietic stem cell transplantation, symptoms, quality of life, ethnic diversity, transplant type
Introduction
Comprehensive reviews have examined studies of quality of life (QOL)1,2 and symptoms3 after hematopoietic stem cell transplantation (HSCT). Numerous studies have found both significant short- and long-term sequelae. Although patients report good overall QOL, they also report compromised aspects of QOL. Physical functioning rapidly declines after HSCT and improves after 100 days, with plateaus reported to occur between one year4,5 and four years.6 Emotional functioning is most compromised immediately before and after HSCT,5 with improvements over time.5,7 Data are conflicting about whether social functioning improves,8 deteriorates,7 or has no change.9 Role functioning gradually improves after an immediate decline after transplantation.7
Recent studies have examined symptoms in persons having autologous stem cell transplantation.10,11 Campagnaro et al. 11 used the M. D. Anderson Symptom Inventory (MDASI), and Anderson et al. 10 used the MDASI Blood and Marrow Transplantation (MDASI-BMT) module. Both studies found that symptoms intensified throughout transplantation and decreased by Day 30.
Although symptoms have been examined, many of these studies are limited by small sample sizes and considerable attrition. Because transplantation protocols have changed, the earlier studies must be viewed with some caution. In addition, although health disparities in ethnic minorities have been examined, few studies have examined African American or Hispanic experiences or symptoms with HSCT. Studies have included primarily Caucasian and upper middle class patients. Serna et al. 12 reported that between 1995 and 1999, Hispanics compared with whites had lower survival one and three years after HSCT. No significant differences were found between whites and blacks or with Asians. Survival did improve for the entire cohort over time. Loberiza et al. 13 described the difficulties in conducting research with sufficient numbers of ethnically diverse patients to understand differences among persons having HSCT that may be based on biologic or psychosocial determinants such as the role of socioeconomic status. Whereas Bevans et al. 5,14 had a diverse sample (35 Caucasian, 23 Hispanic, five black, seven Asian, and six “other” participants), only survivorship was reported in relation to ethnicity. Potential differences in diverse cultures underscore the importance of examining a diverse sample. In addition, most studies have included only persons who had either allogeneic or autologous transplants, and few compared these types of HSCT.
When the source of stem cells is allogeneic donors, 25%–80% of patients will experience graft-versus-host disease (GVHD). GVHD can occur in the early, acute or later stages or as chronic GVHD. Chronic GVHD usually appears 100 days after HSCT, but the timing can vary.15 Clinical manifestations of GVHD are more important criteria than time, according to the National Institutes of Health consensus criteria.16 GVHD has features of autoimmune and immunologic disorders, although the pathogenesis is not well understood.16 Treatment options are less than satisfactory but usually include additional immunosuppressants to control GVHD, which further increase the risk of infection and may cause hypertension, hyperglycemia, and muscle atrophy. In the most severe cases, GVHD is life threatening for patients as a result of infection, acute liver dysfunction, or gastrointestinal bleeding. Symptom patterns may be different for patients with GVHD compared with those without GVHD. Pidala et al. 17 found that the severity of chronic GVHD was significantly associated with QOL reports, independent of other factors. The effect was found over several domains of QOL, showing the wide-reaching effects of GVHD. However, the small sample size of this study limits generalizability.
Describing symptoms and QOL and understanding who is most at risk is an important basis for developing interventions to improve patients’ experiences. The aim of this study was to examine symptoms and QOL over the first 100 days after transplantation among African American, Latino, and Caucasian patients. The specific hypotheses addressed were the following: 1) symptoms and QOL will be worse for persons with allogeneic transplants with myeloablative preparation and 2) symptoms will be lowest for persons with autologous transplants.
Methods
Subjects
Patients eligible for participation in the study were recruited in the outpatient transplantation clinic before their admission to the hospital for HSCT. Data were collected from patients who agreed to participate and provided written informed consent.
Procedures
This longitudinal descriptive study involved collecting data from 164 patients. Data were collected on performance status, demographic and biomedical variables, and symptom data from the MDASI-BMT. QOL was measured with the Functional Assessment of Cancer Therapy-Bone Marrow Transplant (FACT-BMT). Symptom and performance data were collected at eight time points: pretransplant, conditioning regimen (Day 3–4 of regimen), day of transplant, nadir of white blood cell count (WBC), engraftment, and Days 30, 60, and 100 post-transplantation. These time points were selected because they represent times when symptoms were both clinically relevant for assessment and were most likely to change. QOL measures were done at four times: pretransplant and Days 30, 60, and 100 post-transplantation.
Measures
MDASI-BMT (English and Spanish Versions)
The MDASI-BMT was used to rate symptoms. The core MDASI instrument18 is brief and easily understood. Patients rate the intensity of 13 physical, affective, and cognitive symptoms: pain, fatigue, nausea, disturbed sleep, distress, shortness of breath, problems remembering, lack of appetite, drowsiness, dry mouth, feeling sad, vomiting, and numbness or tingling, and six items related to how much symptoms have interfered with: general activity, mood, work, relations with others, walking, and enjoyment of life. In consultation with physicians and nurses from M. D. Anderson’s Department of Stem Cell Transplantation and Cellular Therapy, five additional symptoms important to this population were added. The Blood and Marrow Transplantation symptoms rated are feeling physically sick, weak, diarrhea, mouth sores, and bleeding. All symptoms are rated on 0–10 numeric scales from “not present” to “as bad as you can imagine.” Patients also rate the amount of interference with daily activities caused by symptoms on 0–10 numeric scales from “did not interfere” to “interfered completely.” The MDASI-BMT has demonstrated good internal reliability in prior studies.10,18 The MDASI-BMT has been translated to Spanish.
FACT-BMT (English and Spanish Versions)
The FACT-BMT was used to measure QOL. This scale was developed and validated at the Rush-Presbyterian-St. Luke’s Medical Center, Chicago, IL.19 The Functional Assessment of Cancer Therapy scales are self-report measures of QOL, and the questionnaire was developed specifically for patients with cancer; nearly all patients with a sixth grade reading level can easily complete this questionnaire without assistance. The FACT-BMT has 50 items, 27 general questions, and 23 specific questions for blood or marrow transplant patients. Subscales of the FACT-BMT assess physical well-being, social/ family well-being, emotional well-being, functional well-being, and “additional concerns.” Items are scored on a 0–4 scale ranging from “not to all” to “very much,” with higher scores indicating better QOL. Total scores on the FACT-BMT range from 0 to 148 (because only 37 items are scored). Patients who were unable to read completed the questions with assistance. Concurrent validity is supported by a strong Pearson correlation with the Functional Living Index-Cancer (0.79) and a patient-completed version of the QOL Index (0.74). Evidence for construct validity includes 1) moderate to high correlations with mood state as measured by the Taylor Manifest Anxiety Scale (−0.58) and a shortened version of the Profile of Mood States (−0.65) and 2) moderate correlation with activity level (negative direction of the coefficient because of reverse scaling) as measured by the Eastern Cooperative Oncology Group (ECOG) five-point rating of performance status (−0.56). The FACT-BMT has been translated and validated in Spanish.20
The ECOG Performance Status Scale
The ECOG scale was used to assess the health care provider’s estimate of the patient’s functional status.21 The ECOG scale is a five-point measure of functional ability, ranging from fully active (able to carry on all predisease performance without restriction) to completely disabled (cannot carry on any self-care; totally confined to bed or chair). A lower score indicates better functional status. The ECOG Performance Scale, which is the same as the Zubrod Score, has demonstrated excellent reliability and validity in numerous ECOG clinical trials and descriptive studies.22
Demographic Characteristics
Age, gender, marital status, education, employment, and ethnicity were assessed. Demographic data were obtained from the medical record when possible. Other data, such as education level, were obtained from patients. Ethnicity was defined by the patients.
Statistical Analyses
Descriptive statistics were used to summarize patient demographic and clinical characteristics. Correlations were calculated to examine the relationship among symptoms and QOL. Descriptive analysis was conducted to understand the distribution of variables by transplant type. The effect of various factors on symptoms reported was analyzed with longitudinal linear mixed models.
The five worst symptoms based on the grand mean (arithmetic average across all patients and across all time points) (fatigue, sleep disturbance, physically weak, drowsiness, and lack of appetite) from the MDASI-BMT were used for linear mixed model analysis. This analysis was done to reduce the impact of symptoms rated to be of low severity. Longitudinal linear mixed models23,24 were fitted with each of the top five symptoms, with the average of the top five symptoms and the FACT-BMT as dependent variables. In each of the longitudinal models, in addition to eight levels of the time factor, the following covariates and their coding were included: ECOG performance status (0 = good, 1 = poor); type of transplant (0 = myeloablative, 1 = nonmyeloablative, 2 = autologous); gender (1 = male, 2 = female); ethnicity (0 = black or Hispanic, 1 = white non-Hispanic); and age (treated as a continuous variable). Ethnicity was condensed into two groups because of the small sample size of patients who were black or Hispanic. Interaction terms of transplant type by time and transplant type by ethnicity were explored. Because age and ethnicity variables were not found to be significant, models were recomputed without them. Final models were computed with compound symmetry and heterogeneous compound symmetry for the repeated observations, and the model that minimized the Akaike Information Criterion25 was retained. Compound symmetry was sufficient for fatigue, sleep disturbance, FACT-BMT, and interference.
For the linear mixed models, P-values were deemed significant if less than 0.01 to control for Type 1 error given the multiple comparisons conducted. All tests were two-tailed. Analysis was performed using SPSS version 19 (IBM, Armonk, NY).
Results
Sample
Data were collected from 164 patients longitudinally. QOL data were collected at four times and all other data at eight points from pretransplant to 100 days post-transplant. Spanish versions of the instruments were used to collect all data for 19 of the 164 patients (11.6%). Among the patients, 49 (30%) had allogeneic transplants with a myeloablative conditioning regimen, 53 (32%) had allogeneic transplants with a nonmyeloablative conditioning regimen, and 62 patients (38%) had autologous transplants. Most patients, 102 (62%), were white non-Hispanics, 38 (23%) were Hispanic, and 24 (15%) were black non-Hispanics. Further demographic and clinical characteristics are presented in Table 1. These data represent characteristics at baseline. The three transplant groups had similar demographic characteristics except for age. The mean ages were 41 years, 43 years, and 50 years for the myeloablative, non-myeloablative, and autologous groups, respectively (F = 6.665, P = 0.002). In addition, pretransplant FACT-BMT scores differed. The FACT-BMT mean scores were 106.07, 102.42, and 112.98 for the autologous, myeloablative, and nonmyeloablative groups, respectively (F = 4.155, P = 0.017). We examined the distribution of patient dropout and/or attrition over time based on ethnicity and found no significant difference. The proportion of non-Hispanic blacks, Hispanics, and non-Hispanic whites who dropped out did not vary significantly over the course of the study.
Table 1.
Demographic and Clinical Characteristics at Baseline (n = 164)
| Characteristic | Total | Allogeneic Myeloablative | Allogeneic Nonmyeloablative | Autologous |
|---|---|---|---|---|
| Gender, n (%) | ||||
| Male | 91 (56) | 27 (55) | 27 (51) | 37 (60) |
| Female | 73 (44) | 22 (45) | 26 (49) | 25 (40) |
| Mean age (range) | 45 (19–74) | 41 (20–65) | 43 (19–72) | 50 (22–74) |
| Employment, n (%) | ||||
| Working | ||||
| Employed full-time | 19 (12) | 6 (12) | 5 (10) | 8 (13) |
| Employed part-time | 3 (2) | 3 (6) | ||
| Disabled/medical leave | 18 (11) | 4 (8) | 6 (11) | 8 (13) |
| Housewife/student/self-employed | 6 (4) | 1 (2) | 2 (4) | 3 (5) |
| Retired | 20 (12) | 1 (2) | 7 (13) | 12 (19) |
| Not currently working | 94 (57) | 34 (70) | 31 (60) | 29 (47) |
| Other | 3 (2) | 1 (2) | 2 (3) | |
| Marital status, n (%) | ||||
| Married | 109 (66) | 34 (69) | 33 (62) | 42 (68) |
| Single/widowed/divorced | 55 (34) | 15 (31) | 20 (38) | 20 (32) |
| Ethnicity, n (%) | ||||
| African American (black, non-Hispanic) | 24 (15) | 3 (6) | 6 (11) | 15 (24) |
| Latino (Hispanic) | 38 (23) | 14 (29) | 12 (23) | 12 (19) |
| Caucasian (white, non-Hispanic) | 102 (62) | 32 (65) | 35 (66) | 35 (57) |
| Education, n (%) | ||||
| Some high school or less | 11 (8) | 4 (8) | 2 (4) | 5 (8) |
| High school graduate | 48 (29) | 15 (31) | 13 (25) | 20 (33) |
| Some college/college grad | 75 (46) | 26 (53) | 25 (49) | 24 (39) |
| Postdoctoral | 27 (17) | 4 (8) | 11 (22) | 12 (20) |
| Type of transplant, n (%) | ||||
| Allogeneic myeloablative | 49 (30) | |||
| Allogeneic nonmyeloablative | 53 (32) | |||
| Autologous | 62 (38) | |||
| Deaths at 100 days | ||||
| Allogeneic myeloablative | 8 | |||
| Allogeneic nonmyeloablative | 6 | |||
| Autologous | 2 | |||
Time Course of Symptoms and QOL
Mean scores and standard deviations for symptoms and QOL over the time points are presented in Figs. 1 and 2 and Table 2. Mean scores were calculated for all symptoms and for the five most severe symptoms across all time points, which were physical weakness, sleep disturbance, lack of appetite, fatigue, and drowsiness. Mean symptom ratings showed mild or moderate intensity, and the standard deviations showed ratings had wide variability. Compared with pretransplant, lack of appetite was present at all time periods, whereas at the nadir of the WBC count, patients had significant symptoms in all areas except sleep disturbance. Overall, the five worst symptoms and interference were higher at the day of transplant, nadir of the WBC count, and at engraftment when compared with pretransplant symptoms. QOL was reported as worse at Day 30 (Fig. 3).
Fig. 1.

Mean of most severe symptoms of the MDASI-BMT. MDASI-BMT = M. D. Anderson Symptom Inventory Blood and Marrow Transplantation.
Fig. 2.

MDASI-BMT: mean symptom severity, mean core symptoms, mean BMT subscale, and mean interference subscale. MDASI-BMT = M. D. Anderson Symptom Inventory Blood and Marrow Transplantation.
Table 2.
MDASI-BMT, FACT-BMT Scores at Study Time Points
| Time Point | Mean of 13 Core Symptoms | Mean of All Symptoms for MDASI-BMT | Mean of Interference Items | Mean of Five Worst Symptoms | FACT-BMT Score |
|---|---|---|---|---|---|
| Pretransplant | |||||
| Mean | 1.58 | 1.37 | 2.46 | 2.10 | 107.2221 |
| n | 164.00 | 164.00 | 163.00 | 164.00 | |
| SD | 1.42 | 1.26 | 2.33 | 1.72 | 19.26437 |
| Conditioning | |||||
| Mean | 2.02 | 1.77 | 2.95 | 2.82 | |
| n | 153.00 | 153.00 | 153.00 | 153.00 | |
| SD | 1.60 | 1.44 | 2.56 | 2.10 | |
| Day of transplant | |||||
| Mean | 2.64 | 2.40 | 3.65 | 3.84 | |
| n | 156.00 | 156.00 | 156.00 | 156.00 | |
| SD | 1.68 | 1.57 | 2.46 | 2.27 | |
| Nadir WBC | |||||
| Mean | 3.10 | 3.01 | 4.08 | 4.49 | |
| n | 154.00 | 154.00 | 154.00 | 154.00 | |
| SD | 1.74 | 1.71 | 2.64 | 2.42 | |
| Engraftment | |||||
| Mean | 2.59 | 2.47 | 3.74 | 3.77 | |
| n | 147.00 | 147.00 | 147.00 | 147.00 | |
| SD | 1.57 | 1.50 | 2.49 | 2.22 | |
| Day 30 | |||||
| Mean | 2.24 | 2.06 | 3.36 | 3.29 | 100.1914 |
| n | 148.00 | 148.00 | 148.00 | 148.00 | |
| SD | 1.78 | 1.62 | 2.50 | 2.33 | 19.94096 |
| Day 60 | |||||
| Mean | 1.85 | 1.69 | 2.69 | 2.58 | 103.8391 |
| n | 141.00 | 141.00 | 141.00 | 141.00 | |
| SD | 1.68 | 1.58 | 2.44 | 1.99 | 20.72232 |
| Day 100 | |||||
| Mean | 1.69 | 1.58 | 2.71 | 2.37 | 105.5461 |
| n | 139.00 | 139.00 | 139.00 | 139.00 | |
| SD | 1.59 | 1.51 | 2.60 | 2.10 | 21.97852 |
| Total | |||||
| Mean | 2.22 | 2.04 | 3.21 | 3.16 | 104.2573 |
| n | 1202.00 | 1202.00 | 1201.00 | 1202.00 | |
| SD | 1.70 | 1.61 | 2.56 | 2.28 | 20.56134 |
MDASI-BMT = M. D. Anderson Symptom Inventory Blood and Marrow Transplantation; FACT-BMT = Functional Assessment of Cancer Therapy-Bone Marrow Transplant; WBC = white blood cell.
Fig. 3.
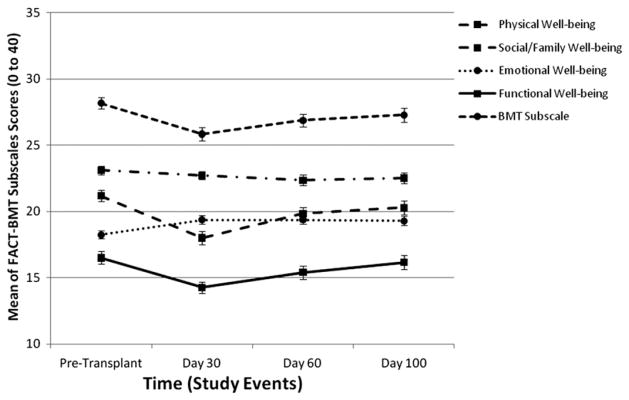
Mean of FACT-BMT subscales—physical well-being, social-family well-being, emotional well-being, functional well-being, and BMT subscale. FACT-BMT = Functional Assessment of Cancer Therapy-Bone Marrow Transplant.
Symptom severity was significantly correlated at pretransplant with both interference (r = 0.59, P = 0.01) and QOL (r = −0.57, P = 0.01). As expected, patients reporting high QOL reported less severe symptoms and interference compared with those reporting low QOL scores. The relationship between symptom severity and interference was even stronger at 100 days (r = 0.73, P = 0.01), as was the correlation between symptom severity and QOL (r = −0.70, P = 0.01). In addition, patients reporting less interference from their symptoms at 100 days reported a higher QOL (r = −0.74, P = 0.01).
Functional/performance status (ECOG scores) varied over the eight time points. At pretransplant, 77% of the patients had good performance status (scored as a binary variable of 0, which is good, or 1, which is poor). This score worsened at each time point until nadir (50% were scored good at conditioning regimen, 35% at transplant, and 29% at nadir). ECOG scores improved after that, from 36% having scores of 0 at engraftment, 50% at Day 30, 51% at Day 60, and 67% at Day 100.
Transplant Type
Transplant type had a significant influence on the symptoms reported by patients (Fig. 4). Those who had an allogeneic transplant with a myeloablative regimen reported increased disturbance of sleep compared with autologous transplant patients. In addition, when measured by the FACT-BMT, the allogeneic patients with myeloablative regimens reported a lower QOL than the autologous patients. At the time of conditioning, patients with nonmyeloablative conditioning had more physical weakness than those patients with autologous transplants. At Day 100, patients with the nonmyeloablative regimen had higher symptom scores for both the worst five symptoms and for physical weakness than the patients with autologous transplants. Also at Day 100, patients with myeloablative conditioning had higher scores for the top five symptoms, fatigue, and physical weakness than patients with autologous transplants (Table 3).
Fig. 4.

Symptoms over time by transplant type.
Table 3.
Estimates of Fixed Effects by Symptoms and QOL
| Variable | Mean of Worst Five Symptoms | Fatigue | Physical Weakness | Sleep Disturbance | Drowsiness | Lack of Appetite | FACT-BMT (QOL) | Interference |
|---|---|---|---|---|---|---|---|---|
| Intercept | 3.1 (0.23)a | 4.4 (0.36)a | 3.3 (0.29)a | 3.1 (0.32)a | 3.1 (0.20)a | 1.9 (0.20)a | 101.0 (2.4)a | 3.6 (0.21)a |
| ECOG = good | −1.2 (0.12)a | −1.5 (0.15)a | −1.4 (0.15)a | −0.9 (0.18)a | −1.3 (0.16)a | −1.1 (0.17)a | 10.5 (1.3)a | −1.5 (0.13)a |
| ECOG = poor | 0 | 0 | 0 | 0 | 0 | 0 | 0 | 0 |
| Male | — | −0.7 (0.24)a | — | — | — | — | — | — |
| Female | — | 0 | — | — | — | — | — | — |
| Myeloablative | 0.1 (0.33) | −0.4 (0.46) | −0.2 (0.40) | 1.0 (0.35)a | — | — | −9.5 (3.1)a | — |
| Nonmyeloablative | −0.2 (0.32) | −0.6 (0.46) | −1.0 (0.39) | 0.8 (0.34) | — | — | 3.2 (3.0) | — |
| Autologous | 0 | 0 | 0 | 0 | — | — | 0 | — |
| Pretransplant | 0 | 0 | 0 | 0 | 0 | 0 | 0 | 0 |
| Conditioning | 0.0 (0.27) | 0.2 (0.38) | −0.5 (0.35) | 0.4 (0.27) | 0.2 (0.22) | 1.2 (0.22)a | — | 0.1 (0.20) |
| Day of transplant | 1.2 (0.29)a | 0.7 (0.37) | 0.5 (0.35) | 0.5 (0.28) | 1.3 (0.26)a | 2.2 (0.27)a | — | 0.6 (0.21)a |
| Nadir WBC | 2.3 (0.31)a | 1.8 (0.39)a | 1.9 (0.40)a | 0.6 (0.28) | 1.6 (0.27)a | 3.4 (0.28)a | — | 0.9 (0.21)a |
| Engraftment | 1.1 (0.29)a | 0.6 (0.38) | 1.0 (0.38)a | 0.1 (0.28) | 1.1 (0.26)a | 2.6 (0.29)a | — | 0.7 (0.21)a |
| Day 30 | 0.5 (0.28) | 0.6 (0.38) | 0.6 (0.37) | −0.1 (0.27) | 0.4 (0.24) | 1.8 (0.25)a | −4.7 (1.4)a | 0.5 (0.21) |
| Day 60 | 0.1 (0.27) | 0.2 (0.38) | 0.1 (0.33) | −0.3 (0.28) | −0.2 (0.23) | 0.8 (0.24)a | −1.2 (1.4) | −0.1 (0.21) |
| Day 100 | −0.4 (0.27) | −0.2 (0.38) | −0.3 (0.35) | −0.8 (0.28)a | −0.1 (0.23) | 0.7 (0.23)a | −1.7 (1.4) | 0.2 (0.21) |
| Conditioning × myeloablative | 0.7 (0.40) | 0.6 (0.56) | 1.2 (0.51) | — | — | — | — | — |
| Conditioning × nonmyeloablative | 0.6 (0.39) | 0.5 (0.55) | 1.5 (0.50)a | — | — | — | — | — |
| Day of transplant × myeloablative | −0.1 (0.43) | 0.0 (0.56) | 0.7 (0.53) | — | — | — | — | — |
| Day of transplant × nonmyeloablative | 0.3 (0.42) | 1.0 (0.55) | 1.2 (0.51) | — | — | — | — | — |
| Nadir × myeloablative | −0.6 (0.46) | −0.1 (0.57) | −0.3 (0.58) | — | — | — | — | — |
| Nadir × nonmyeloablative | −0.7 (0.44) | −0.3 (0.55) | 0.0 (0.56) | — | — | — | — | — |
| Engraft × myeloablative | 0.3 (0.44) | 1.0 (0.58) | −0.2 (0.58) | — | — | — | — | — |
| Engraft × nonmyeloablative | 0.2 (0.42) | 0.5 (0.55) | 0.4 (0.55) | — | — | — | — | — |
| Day 30 × myeloablative | 1.1 (0.43) | 1.5 (0.57) | 1.2 (0.56) | — | — | — | — | — |
| Day 30 × nonmyeloablative | 0.2 (0.42) | 0.3 (0.56) | 0.8 (0.54) | — | — | — | — | — |
| Day 60 × myeloablative | 0.5 (0.41) | 0.8 (0.58) | 1.1 (0.50) | — | — | — | — | — |
| Day 60 × nonmyeloablative | 0.0 (0.39) | 0.0 (0.56) | 0.2 (0.48) | — | — | — | — | — |
| Day 100 × myeloablative | 0.7 (0.39) | 1.6 (0.59)a | 2.0 (0.55)a | — | — | — | — | — |
| Day 100 × nonmyeloablative | 1.4 (0.41)a | 0.9 (0.56) | 1.5 (0.52)a | — | — | — | — | — |
QOL = quality of life; FACT-BMT = Functional Assessment of Cancer Therapy-Bone Marrow Transplant; ECOG = Eastern Cooperative Oncology Group; WBC = white blood cell.
The values are estimates of fixed effects, and the numbers in parentheses are the standard errors. Because age and race variables were not found to be significant, models were recomputed without them. Final models were computed with compound symmetry and heterogeneous compound symmetry, and the model that minimized the Akaike Information Criterion was retained. Compound symmetry was sufficient for fatigue, sleep disturbance, FACT-BMT, and interference.
P < 0.01.
Gender and Ethnicity
Male patients reported less fatigue than female patients. However, ethnicity was not significant. Because the data of interaction of ethnicity with transplant type were very sparse, there was not sufficient power to detect differences.
ECOG and Symptoms
ECOG was a consistently important factor in all longitudinal mixed models. Patients with good functional status had a lower mean for the five worst symptoms. They had less fatigue, physical weakness, sleep disturbance, drowsiness, and lack of appetite than those patients with poor functional status. Patients with good functional status had a higher QOL than those patients with poor functional status (Table 3).
Table 3 summarizes the model dependencies of factors such as ECOG performance status, type of transplant, gender, and age on outcomes, namely the average of the top five symptoms, each of the five worst individual symptoms, and QOL. Each column represents a separate linear mixed model using the factors enumerated above. Cells with no parameter estimate indicate that the factor was discarded because it was not a significant predictor of the corresponding outcome at P < 0.01. For factors with two possible levels, for example, ECOG performance status, the estimate shows the difference between the groups across time. For example, patients with good performance status reported fatigue to be 1.5 points lower than those with poor performance status on average over time. For factors with three levels, for example, the type of transplant, the level with zero estimate is the reference level. Patients with myeloablative transplant reported, on average across time, that their sleep disturbance was 1.0 point higher than patients with autologous transplant. Similar interpretation can be made about the FACT-BMT scale as outcome. The only difference is that the estimates are generally reversed in sign from those of the symptoms because higher FACT-BMT scores correspond to better QOL.
Graft-Versus-Host Disease
Of the 104 patients who received an allogeneic (matched sibling, matched unrelated and cord blood as a source of stem cells) transplantation, 41 (40%) patients developed acute GVHD, which usually occurs in the first 100 days after transplantation. The grade of GVHD varied: 16 patients (16% of all patients) had Grade 1 GVHD that was limited and did not progress to a higher grade; 13 patients (12%) progressed but were limited to Grade 2 GVHD; and 11 patients (10%) experienced Grade 3 or 4, the most severe and potentially life-threatening acute GVHD. The average day after transplant for patients to develop acute GVHD was 30 (range 9–100).
Although our study’s focus was assessment until Day 100, of interest was that 49 (53%) of the 91 allogeneic patients (13 patients were not evaluable at Day 100) developed chronic GVHD, with 20 of these patients developing de novo (no previous acute GVHD). The average time for development of chronic GVHD was 4.3 months (range 3–7 months).
We compared the area under the curve (AUC) for the mean of the top five symptoms and the corresponding individual symptoms from the day of transplant up to 100 days for allogeneic patients who had acute GVHD against those who did not. There were significant differences in the AUC for the mean of the top five symptoms (257 vs. 330, P < 0.036). Of the top five symptoms, there were significant differences in fatigue AUC (301.2 vs. 389, P < 0.03) and physically weak AUC (238.1 vs. 336.5, P < 0.015). The AUCs for sleep, drowsiness, and lack of appetite showed similar trends but were not statistically significant. Patients who developed acute GVHD also were likely to develop chronic GVHD. Of the 44 patients (27%) who had acute GVHD, 28 patients (64%) also had chronic GVHD (P < 0.001). GVHD was not included in the longitudinal models because the precise time course was unavailable and because of its irrelevance to the autologous group.
Discussion
Our analysis provides a detailed description of cancer symptoms in patients before and after HSCT that included measures at pre-transplant, during the conditioning regimen, the day of the transplant, WBC nadir, engraftment, and Days 30, 60, and 100 post-transplantation. HSCT patients were in three groups: autologous transplantation, allogeneic with myeloablative conditioning, and allogeneic with nonmyeloablative conditioning. To our knowledge, this study is the most comprehensive analysis of symptoms in patients having HSCT.
For analysis, the top five symptoms were followed over time (physical weakness, lack of appetite, sleep disturbance, fatigue, and drowsiness). The pattern of symptom severity for these five symptoms differed by transplant type. The autologous transplant group demonstrated a curve with a peak at the WBC nadir, whereas the allogeneic patients with myeloablative regimens had a curve with peaks at the WBC nadir and at Day 30. The allogeneic patients with myeloablative regimens had higher symptom severity than the other two groups except for symptoms at nadir, when the autologous patients had the highest level of symptoms. The fact that these patients were the oldest may help explain that finding. The allogeneic patients with nonmyeloablative regimens had persistent increased symptom severity between the day of transplant and engraftment. ECOG levels indicated that functional status followed the same pattern, with functional levels gradually decreasing as symptoms increased, and then functional levels increasing as symptoms decreased. However, 8% fewer returned to good functional status at Day 100 compared with pretransplant. These patterns of functional status and symptoms provide a basis for patient education before transplant that can be tailored to the type of transplant and conditioning the patient will receive. Anticipatory guidance will allow patients to anticipate both when symptoms may be severe and also when they should abate and how this may relate to their functional status. This knowledge may decrease anxiety and enhance coping with the symptoms.
No differences were found in symptoms and QOL among ethnic groups. However, male patients reported less fatigue than female patients. Campagnaro et al. 11 also found that men reported lower symptom severity at nadir. Other studies have not reported gender and ethnic differences. The larger sample size and ethnic diversity of the sample in this study as compared with previous studies allow these results to be generalized to a diverse population. Further studies with much larger sample sizes need to be conducted to have enough power to test the ethnicity by transplant type effect.
Further studies with larger samples need to be conducted on the relationship of GVHD, transplant type, and symptoms over time. Feeling physically weak and fatigued were significant for patients with GVHD and the other three top symptoms trended toward significance. Understanding the symptom trajectory for patients who develop GVHD may provide early means of assessment and treatment.
This study provides information on the trajectory of the symptoms through multiple time points, giving a more complete picture of the symptom experience. As in previous studies, QOL and severity of symptoms were related. In addition, those patients who had increased severity of symptoms reported more interference in their daily activities. Patient and family preparation for the transplantation should include discussion of the period of time that patients will be unable to complete their normal activities.
Strengths of this study included the larger sample size than previous studies. This sample size, along with the diversity of the sample, allowed the ethnic and gender differences to be explored as well as differences in symptoms by transplant type. However, ethnic data were sparse when considering the three types of transplants. In addition, because data were collected at one major cancer center, additional studies need to be conducted at additional centers. Although this study collected data at more time points than previous studies, additional time points are needed to confirm the trajectory of cancer symptoms over time and between the time points in this study. The MDASI-BMT was a quick instrument that patients were able to complete even when symptoms were the most severe and was found to be a useful way to assess symptoms.
Further research with larger sample sizes at multiple sites needs to be conducted to further explore the gender and ethnic differences in symptoms of HSCT patients found in this study, as well as the differences by transplant type. Knowledge of these differences will allow health care providers to anticipate the guidance and support patients will need during their transplantation experience.
As well, further research on interventions is needed. Whereas few intervention studies to improve QOL have been conducted, exercise is one intervention with some promise to improve aspects of QOL and symptoms. A review of 15 studies of physical exercise in people with HSCT found modest benefits of exercise on strength, endurance, and/or QOL, although the studies included many methodological weaknesses.26 Baumann et al. 27 found that exercise improved global QOL and physical functioning; another study found that although a multimodal program of exercise, relaxation, and psychoeducation improved several aspects of physical capacity, changes in QOL and symptoms were not statistically significant.28
In addition, future work is needed to better understand the mechanisms involved in symptoms after transplantation. Wang et al. 29 found that systemic inflammatory cytokines, mainly interleukin 6, corresponded to increases in treatment-related symptoms during the nadir period among 30 persons who had allogeneic HSCT. Future work examining genetic polymorphisms, the role of cytokines and cytokine blockade, or inhibition of tumor necrosis factor would be useful to advance the understanding of the mechanisms related to symptoms after HSCT.
Acknowledgments
This project, Symptom Management in Blood and Marrow Transplantation, was funded by grant no. R01 NR05188 from the National Institutes of Health, National Institute of Nursing Research, to principal investigator Marlene Z. Cohen.
Footnotes
Disclosures
The authors declare no conflicts of interest.
References
- 1.Pidala J, Anasetti C, Jim H. Quality of life after allogeneic hematopoietic cell transplantation. Blood. 2009;114:7–19. doi: 10.1182/blood-2008-10-182592. [DOI] [PMC free article] [PubMed] [Google Scholar]
- 2.Hacker ED. Quantitative measurement of quality of life in adult patients undergoing bone marrow transplant or peripheral blood stem cell transplant: a decade in review. Oncol Nurs Forum. 2003;30:613–629. doi: 10.1188/03.onf.613-631. [DOI] [PubMed] [Google Scholar]
- 3.Mosher CE, Redd WH, Rini CM, Burkhalter JE, DuHamel KN. Physical, psychological, and social sequelae following hematopoietic stem cell transplantation: a review of the literature. Psychooncology. 2009;18:113–127. doi: 10.1002/pon.1399. [DOI] [PMC free article] [PubMed] [Google Scholar]
- 4.Syrjala KL, Langer SL, Abrams JR, et al. Recovery and long-term function after hematopoietic cell transplantation for leukemia or lymphoma. JAMA. 2004;291:2335–2343. doi: 10.1001/jama.291.19.2335. [DOI] [PubMed] [Google Scholar]
- 5.Bevans MF, Marden S, Leidy NK, et al. Health-related quality of life in patients receiving reduced-intensity conditioning allogeneic hematopoietic stem cell transplantation. Bone Marrow Transplant. 2006;38:101–109. doi: 10.1038/sj.bmt.1705406. [DOI] [PubMed] [Google Scholar]
- 6.Bush NE, Donaldson GW, Haberman MH, Dacanay R, Sullivan KM. Conditional and unconditional estimation of multidimensional quality of life after hematopoietic stem cell transplantation: a longitudinal follow-up of 415 patients. Biol Blood Marrow Transplant. 2000;6:576–591. doi: 10.1016/s1083-8791(00)70067-x. [DOI] [PubMed] [Google Scholar]
- 7.Schulz-Kindermann F, Mehnert A, Scherwath A, et al. Cognitive function in the acute course of allogeneic hematopoietic stem cell transplantation for hematological malignancies. Bone Marrow Transplant. 2007;39:789–799. doi: 10.1038/sj.bmt.1705663. [DOI] [PubMed] [Google Scholar]
- 8.Syrjala KL, Chapko MK, Vitaliano PP, Cummings C, Sullivan KM. Recovery after allogeneic marrow transplantation: prospective study of predictors of long-term physical and psychosocial functioning. Bone Marrow Transplant. 1993;11:319–327. [PubMed] [Google Scholar]
- 9.McQuellon RP, Russell GB, Rambo TD, et al. Quality of life and psychological distress of bone marrow transplant recipients: the ‘time trajectory’ to recovery over the first year. Bone Marrow Transplant. 1998;21:477–486. doi: 10.1038/sj.bmt.1701115. [DOI] [PubMed] [Google Scholar]
- 10.Anderson KO, Giralt SA, Mendoza TR, et al. Symptom burden in patients undergoing autologous stem-cell transplantation. Bone Marrow Transplant. 2007;39:759–766. doi: 10.1038/sj.bmt.1705664. [DOI] [PubMed] [Google Scholar]
- 11.Campagnaro E, Saliba R, Giralt S, et al. Symptom burden after autologous stem cell transplantation for multiple myeloma. Cancer. 2008;112:1617–1624. doi: 10.1002/cncr.23299. [DOI] [PubMed] [Google Scholar]
- 12.Serna DS, Lee SJ, Zhang MJ, et al. Trends in survival rates after allogeneic hematopoietic stem-cell transplantation for acute and chronic leukemia by ethnicity in the United States and Canada. J Clin Oncol. 2003;21:3754–3760. doi: 10.1200/JCO.2003.03.133. [DOI] [PubMed] [Google Scholar]
- 13.Loberiza FR, Jr, Lee SJ, Freytes CO, et al. Methodological and logistical considerations to study design and data collection in racial/ethnic minority populations evaluating outcome disparity in hematopoietic cell transplantation. Biol Blood Marrow Transplant. 2009;15:903–909. doi: 10.1016/j.bbmt.2009.04.005. [DOI] [PMC free article] [PubMed] [Google Scholar]
- 14.Bevans MF, Mitchell SA, Marden S. The symptom experience in the first 100 days following allogeneic hematopoietic stem cell transplantation (HSCT) Support Care Cancer. 2008;16:1243–1254. doi: 10.1007/s00520-008-0420-6. [DOI] [PMC free article] [PubMed] [Google Scholar]
- 15.Min CK. The pathophysiology of chronic graft-versus-host disease: the unveiling of an enigma. Korean J Hematol. 2011;46:80–87. doi: 10.5045/kjh.2011.46.2.80. [DOI] [PMC free article] [PubMed] [Google Scholar]
- 16.Filipovich AH, Weisdorf D, Pavletic S, et al. National Institutes of Health consensus development project on criteria for clinical trials in chronic graft-versus-host disease: I. Diagnosis and staging working group report. Biol Blood Marrow Transplant. 2005;11:945–956. doi: 10.1016/j.bbmt.2005.09.004. [DOI] [PubMed] [Google Scholar]
- 17.Pidala J, Kurland B, Chai X, et al. Patient-reported quality of life is associated with severity of chronic graft-versus-host disease as measured by NIH criteria: report on baseline data from the Chronic GVHD Consortium. Blood. 2011;117:4651–4657. doi: 10.1182/blood-2010-11-319509. [DOI] [PMC free article] [PubMed] [Google Scholar]
- 18.Cleeland CS, Mendoza TR, Wang XS, et al. Assessing symptom distress in cancer patients: the M. D. Anderson Symptom Inventory. Cancer. 2000;89:1634–1646. doi: 10.1002/1097-0142(20001001)89:7<1634::aid-cncr29>3.0.co;2-v. [DOI] [PubMed] [Google Scholar]
- 19.Cella DF, Tulsky DS, Gray G, et al. The Functional Assessment of Cancer Therapy scale: development and validation of the general measure. J Clin Oncol. 1993;11:570–579. doi: 10.1200/JCO.1993.11.3.570. [DOI] [PubMed] [Google Scholar]
- 20.Cella D, Hernandez L, Bonomi AE, et al. Spanish language translation and initial validation of the functional assessment of cancer therapy quality-of-life instrument. Med Care. 1998;36:1407–1418. doi: 10.1097/00005650-199809000-00012. [DOI] [PubMed] [Google Scholar]
- 21.Oken MM, Creech RH, Tormey DC, et al. Toxicity and response criteria of the Eastern Cooperative Oncology Group. Am J Clin Oncol. 1982;5:649–655. [PubMed] [Google Scholar]
- 22.Cleeland CS, Gonin R, Baez L, Loehrer P, Pandya KJ. Pain and treatment of pain in minority patients with cancer. The Eastern Cooperative Oncology Group Minority Outpatient Pain Study. Ann Intern Med. 1997;127:813–816. doi: 10.7326/0003-4819-127-9-199711010-00006. [DOI] [PubMed] [Google Scholar]
- 23.Brown H, Prescott R. Applied mixed models in medicine. 2. Hoboken, NJ: John Wiley & Sons; 2006. [Google Scholar]
- 24.Pinheiro JC, Bates DM. Mixed effects models in S and S-Plus. New York: Springer; 2000. [Google Scholar]
- 25.Akaike HA. A new look at the statistical model identification. IEEE Trans Automat Contr. 1974;19:716–723. [Google Scholar]
- 26.Wiskemann J, Huber G. Physical exercise as adjuvant therapy for patients undergoing hematopoietic stem cell transplantation. Bone Marrow Transplant. 2008;41:321–329. doi: 10.1038/sj.bmt.1705917. [DOI] [PubMed] [Google Scholar]
- 27.Baumann FT, Kraut L, Schule K, Bloch W, Fauser AA. A controlled randomized study examining the effects of exercise therapy on patients undergoing haematopoietic stem cell transplantation. Bone Marrow Transplant. 2010;45:355–362. doi: 10.1038/bmt.2009.163. [DOI] [PubMed] [Google Scholar]
- 28.Jarden M, Baadsgaard MT, Hovgaard DJ, Boesen E, Adamsen L. A randomized trial on the effect of a multimodal intervention on physical capacity, functional performance and quality of life in adult patients undergoing allogeneic SCT. Bone Marrow Transplant. 2009;43:725–737. doi: 10.1038/bmt.2009.27. [DOI] [PubMed] [Google Scholar]
- 29.Wang XS, Shi Q, Williams LA, et al. Serum interleukin-6 predicts the development of multiple symptoms at nadir of allogeneic hematopoietic stem cell transplantation. Cancer. 2008;113:2102–2109. doi: 10.1002/cncr.23820. [DOI] [PMC free article] [PubMed] [Google Scholar]