

Abstract
Mouse models of human diseases are used to study the metabolic and physiological processes leading to altered whole‐body energy expenditure (EE), which is the sum of EE of all body organs and tissues. Isotopic techniques, arterio‐venous difference of substrates, oxygen, and blood flow measurements can provide essential information to quantify tissue/organ EE and substrate oxidation. To complement and integrate experimental data, quantitative mathematical model analyses have been applied in the design of experiments and evaluation of metabolic fluxes. In this study, a method is presented to quantify the energy expenditure of the main mouse organs using metabolic flux measurements. The metabolic fluxes and substrate utilization of the main metabolic pathways of energy metabolism in the mouse tissue/organ systems and the whole body are quantified using a mathematical model based on mass and energy balances. The model is composed of six organ/tissue compartments: brain, heart, liver, gastrointestinal tract, muscle, and adipose tissue. Each tissue/organ is described with a distinct system of metabolic reactions. This model quantifies metabolic and energetic characteristics of mice under overnight fasting conditions. The steady‐state mass balances of metabolites and energy balances of carbohydrate and fat are integrated with available experimental data to calculate metabolic fluxes, substrate utilization, and oxygen consumption in each tissue/organ. The model serves as a paradigm for designing experiments with the minimal reliable measurements necessary to quantify tissue/organs fluxes and to quantify the contributions of tissue/organ EE to whole‐body EE that cannot be easily determined currently.
Keywords: Energy metabolism, flux balance analysis, metabolic pathway fluxes, oxygen consumption, substrate utilization
e12159
The model relates metabolic flux measurements to the energy expenditure in tissue–organ systems and whole body. The model can be used in designing experiments by selecting the minimal reliable tissue/organs flux measurements necessary to quantify the contributions of tissue/organ to whole‐body energy expenditure that cannot be easily obtained with the current experimental methodologies.
Introduction
Mouse‐human metabolism relation
Mouse models are valuable tools to investigate and identify metabolic processes that regulate energy metabolism and body weight (BW) (Tam et al. 2009; Guo and Hall 2011). The results obtained from the models in mice can be translated to humans to a large extent because mice and humans share similar physiological functions at cellular, tissue/organ, and whole‐body levels (Rangarajan and Weinberg 2003; Shultz et al. 2007). However, subtle yet important distinctions are evident in the energy metabolism of mice and humans. For example, the energy expenditure (EE) per gram of body weight in mice is seven times higher than that in humans (Blaxter 1989; Wang et al. 2012) and EE per unit mass of liver and brain is respectively eight times and three times higher in mice than that in humans (Wang et al. 2012). Even though mice and humans share metabolic similarities associated with energy metabolism, the magnitude of these processes in organs and tissues differ significantly between them. Thus, it is important to identify and quantify the metabolic processes that lead to those distinctions in mice and humans for translational research of metabolic diseases. Because key metabolic data are limited and difficult to obtain, modeling is necessary to identify and quantify the metabolic processes involving mice models of human disease.
Significance of altered metabolic fluxes
Fuel homeostasis in the whole body requires coordination of metabolic fluxes among organs and tissues. These are regulated by neuroendocrine and hormonal factors (Hall 2006; Kim et al. 2007; Pattaranit and van den Berg 2008). The whole‐body metabolic fluxes that are important for energy metabolism are glycolysis, glycogenolysis, gluconeogenesis, lipolysis, de novo lipogenesis, triglyceride‐fatty acid cycling, proteolysis, and oxidation of macronutrients (carbohydrate, fat, and protein). The total EE is equal to sum of the rates of oxidation of macronutrients. These fluxes change in chronic disease (e.g., diabetes), exercise and dietary perturbations as a result of altered cellular metabolic processes in various tissues and organs (Hall 2006; Kim et al. 2007; Pattaranit and van den Berg 2008). These pathophysiologic perturbations alter metabolic pathways and fluxes in individual organs and alter interorgan exchange rates of substrates with subsequent changes in substrate utilization, EE, and BW (Hall 2006; Kim et al. 2007; Pattaranit and van den Berg 2008). Although most metabolic pathways of substrate utilization are known, the relationships between these pathways and body weight regulation are yet to be quantified. By quantifying EE and metabolic pathway fluxes in organs and tissues, we can obtain key information that relates changes in metabolic processes with regulation of energy metabolism and BW in disease.
EE and metabolic fluxes
Several techniques are available to measure organ/tissue EE and metabolic fluxes in animal models and humans. The product of blood flow and arterio‐venous difference of oxygen is commonly used to determine organ/tissue oxygen consumption (VO2) in vivo. The VO2 of different organs/tissues is then used to quantify their contribution to the whole‐body EE (Elia 1992). The application of this approach is limited in mice because it is challenging to measure blood flow and arterio‐venous difference of oxygen across organs/tissues. Alternatively, investigators have used allometric equations of EE and BW to obtain organ EE in animals (Wang et al. 2012). This approach does not account for changes in body composition and its contribution to whole‐body energy metabolism. Stable isotope tracers combined with measurements of isotopomer labeling using NMR and mass spectroscopy are used to determine metabolic pathway fluxes in vivo (Choi and Antoniewicz 2011). However, they require fairly large amount of sample, long analytical time, and expensive equipment and provide partial information about the distribution of isotopomers. Thus, it is desirable to identify the minimal number of the metabolic flux measurements required to quantify the energy metabolism of each organ in relation to the whole‐body energy expenditure.
Mathematical models of energy metabolism
To relate energy metabolism to the regulation of BW in humans and mice, mathematical models have been developed (Hall 2006, 2012; Tam et al. 2009; Guo and Hall 2011). Although these models can identify whole‐body metabolic fluxes responsible for changes in body weight and composition in response to dietary changes, they do not quantify the metabolic processes in the organs responsible for body weight regulation. Previously, a complementary approach was developed to evaluate metabolic fluxes of organs and tissues by integrating stoichiometric metabolic network models with organ/tissue measurements of uptake and/or production of metabolites and metabolic fluxes (Kim et al. 2007, 2011; Li et al. 2009). By this method, in vivo fluxes can be quantified and relate metabolism of organs and tissues to whole‐body at rest and during exercise in humans. In this study a similar mathematical approach is applied to quantify organ/tissue metabolic fluxes in mice.
Here, we develop a unique quantitative framework to estimate metabolic fluxes of the main pathways of energy metabolism in key tissue/organs of the mouse. Our mathematical framework integrates mass balances, energy balances, and metabolic fluxes obtained from the literature. Specific assumptions are also used to estimate metabolic fluxes that are difficult to measure in each organ of the mouse and are not available in literature. Consequently, the model is used to evaluate (1) the metabolic pathway fluxes of tissues and organs from a limited set of experimental data and (2) the contribution of tissue/organ energy metabolism to whole‐body energy metabolism. Furthermore, by quantifying differences of whole‐body and intraorgan metabolic fluxes between mouse and human, we could relate energy metabolism of mice to humans.
Methods
Overview
In this work, a model paradigm is developed to relate organ‐level energy expenditure to metabolic flux as an alternative to the Fick principle in mice. The main goal is to provide a method to quantify the energy expenditure of organs using metabolic fluxes of the main pathways involved in fuel metabolism. Here, the main organs and tissues involved in lipid, carbohydrates, and protein metabolism and the organs for which there is sufficient metabolic information about mice are considered. The methodology presented here allows quantitative analysis of metabolic fluxes (MF) of overnight‐fasted mouse organs/tissues: brain, heart, liver, skeletal muscle, adipose tissue, and gastrointestinal tract (GI), which includes stomach, spleen, intestines, and visceral fat. The model provides a mechanistic framework to study substrate utilization in each organ. Liver, gastrointestinal (GI) tract, skeletal muscle, and adipose tissue are key organs/tissues that contribute to the adaptive responses to pathophysiological conditions and provide metabolic fuels necessary for sustenance. Additionally, brain and heart consume energy for sending biochemical signals and transport energy. Because of insufficient data on fuel metabolism of lung and kidney in mice, these organs are not included.
Steady‐state mass balance equations are developed for each key metabolite in the biochemical pathways of organs and tissues. This builds upon the approach by others (Kim et al. 2007) used to determine organ/tissue MFs of humans. For mice, however, data are lacking in regard to rates of substrate uptake/release and MFs to construct all the pathway fluxes of organs/tissues. To compensate for this lack of data, the mathematical model combines mass and energy balances to quantify organ/tissue energy expenditure (EE). Consequently, this model analysis yields MFs, substrate uptake/release, substrate utilization, oxygen consumption (VO2), and carbon dioxide production (VCO2) in various organs/tissues of mice. The data inputs given in Tables 1–4 and 10 allow the mathematical model (Fig. 1) to predict the data outputs (Table 5–Table 9 and 12).
Table 1.
Metabolic fluxes (MFs) of mouse organs/tissues.
| Organ/tissue | MF | (μmol/min/kg)1 | Reference |
|---|---|---|---|
| Brain | ϕ GLY→G6P | 2.0 | (Kim et al. 2007) |
| ϕ PYR→LAC | 469.8 | (Kim et al. 2007) | |
| Heart | ϕ GLY→G6P | 160.0 | (Kim et al. 2007) |
| ϕ PYR→LAC | 352.0 | (Kim et al. 2007) | |
| ϕ TG→GLR | 16.0 | (Kim et al. 2007) | |
| Liver | ϕ GLC→G6P | 73.12 | (Mulligan and Tisdale 1991) |
| ϕ G6P→GAP | 73.13 | (Kim et al. 2007) | |
| ϕ GAP→PYR | 146.23 | (Kim et al. 2007) | |
| ϕ PYR→LAC | 140.0 | (Kim et al. 2007) | |
| ϕ G6P→GLY | 66.0 | (Kim et al. 2007) | |
| ϕ GLY→G6P | 305.42 | (Chacko et al. 2012) | |
| ϕ TG→GLR | 2.7 | (Kim et al. 2007) | |
| ϕ AcoA→FFA | 74.7 | (Kim et al. 2007) | |
| ϕ PYR→ACoA | 0.0 | (Kim et al. 2007) | |
| GI | ϕ PYR→LAC | 100.0 | (Kim et al. 2007) |
| Skeletal muscle | ϕ LAC→PYR | 44.4 | (Kim et al. 2007) |
| ϕ GLY→G6P | 6.2 | (Kim et al. 2007) | |
| ϕ TG→GLR | 6.5 | (Kim et al. 2007) | |
| Adipose tissue | ϕ PYR→LAC | 3.3 | (Kim et al. 2007) |
| ϕ LAC→PYR | 0.9 | (Kim et al. 2007) | |
| ϕ FFA→TG | 138.44 | (Kim et al. 2007) |
All fluxes otherwise indicated by 2, 3 and 4 are calculated using the assumption that the metabolic fluxes (MFs) (per unit organ/tissue mass) in mouse and human are similar.
The ϕGLC→G6P and ϕGLY→G6P in the mouse liver were obtained using isotope tracers.
1per kg of organ weight.
2Experimental data.
3The relationships of MFs for ϕG6P→GAP (=ϕGLC→G6P) and ϕGAP→PYR (=2xϕGLC→G6P) in mouse liver were based on the fluxes in human liver.
4The relationship of MFs for ϕFFA→TG (=0.2ϕTG→FFA) in mouse adipose tissue was based on the fluxes in human adipose tissue. 20% of the FFA resulted from lipolysis reesterified to TG.
Table 4.
EE of mouse and human organs/tissues.
| Organ/Tissue | Mouse | Human | Mouse/Human | ||||
|---|---|---|---|---|---|---|---|
| (kcal/kg/day)1 | (kcal/day) | (%) | (kcal/kg/day)1 | (kcal/day) | (%) | Xi‐fold | |
| Brain | 740.7 | 0.4 | 6.42 | 247.1 | 368.2 | 21.35 | 3.0 |
| Heart | 1352.9 | 0.23 | 3.69 | 705.5 | 176.4 | 10.23 | 1.92 |
| Liver | 1747.3 | 3.25 | 52.17 | 224.5 | 336.7 | 19.53 | 7.78 |
| GI tract | 52.8 | 0.14 | 2.25 | 36.8 | 73.6 | 4.27 | 1.43 |
| Skeletal muscle | 78.9 | 0.81 | 13.0 | 13.0 | 361.9 | 20.99 | 6.06 |
| Adipose tissue | 100.0 | 0.31 | 4.98 | 4.1 | 44.9 | 2.6 | 24.5 |
| Others | 95.6 | 1.09 | 17.5 | 14 | 362.7 | 21.03 | 6.84 |
| Whole body | 207.7 | 6.23 | 100.0 | 24.6 | 1724.4 | 100.0 | 8.43 |
EE of brain, heart, liver were determined using allometric equations that relate organ/tissue EE to body mass. The EE of GI tract and “others” were obtained using “residual organs” allometric equation (Wang et al. 2012). “Others” includes the rest of the organs/tissues including kidneys. Adipose tissue EE was determined from FM EE (Guo and Hall 2011). Muscle EE was determined by subtracting brain, heart, liver, GI tract, and others EE from FFM EE (Guo and Hall 2011; Wang et al. 2012).
Human organ/tissue EE was determined from sum of carbohydrate and fat utilization rates (Kim et al. 2007).
Xi‐fold for each organ/tissue: mouse EE (kcal/kg/day)/human EE (kcal/kg/day).
1Per kg of organ weight.
Table 10.
Appearance rates of metabolic fuels in the plasma of mouse and human.
| Metabolic fuel | Appearance rate (Ra) (μmol/min/kg)1 | Appearance rate (Ra) (μmol/min) | Xi‐fold | ||
|---|---|---|---|---|---|
| Mouse | Human | Mouse | Human | Mouse/Human | |
| Glucose | 71.6 ± 4.57 (Chacko et al. 2012) | 10.87 | 2.15±0.14 | 761.0 | 6.59 |
| Lactate | 31.12 (this work) | 4.43 | 0.93 (this work) | 310.0 | 7.02 |
| Pyruvate | 0.0 (this work) | 0.07 | 0.0 (this work) | 5.0 | NA |
| Alanine | 64.9 ± 11.8 (Andrikopoulos and Proietto 1995) | 4.57 | 1.95 ± 0.35 | 320.0 | 14.21 |
| Free Fatty acid | 96.3 ± 17.3 (Bergman et al. 2006) | 4.73 | 2.89 ± 0.52 | 331.0 | 20.37 |
| Glycerol | 32.6 ± 4.3 (Xu et al. 2002) | 2.00 | 0.98 ± 0.13 | 140.0 | 16.30 |
| Triglyceride | 0.67 ± 0.03 (Goudriaan et al. 2005) | 0.41 | 0.020 ± 0.001 | 29.0 | 1.63 |
NA, not available.
Xi‐fold for each organ/tissue: mouse Ra (μmol/kg/min)/human Ra (μmol/kg/min). 1Per kg of body weight.
The references for mouse substrate appearance rates are reported in the brackets. Human substrate appearance rates were obtained from Kim et al. (2007).
Figure 1.

(A) Essential model inputs and equations for estimating computational outputs; (B) Whole‐body systems:Venous (gray arrows) and arterial blood (black arrows) leaving/going to the organ/tissue systems, respectively. RQ is respiratory quotient; VO2 and VCO2 are oxygen consumption and carbon dioxide release rates respectively; CHO and FAT are rates of carbohydrate and fat utilization.
Table 5.
Mouse and human organ/tissue substrate uptake/release rates.
| Organ/Tissue | Substrate | Substrate Uptake/Release (μmol/min/kg)1 | ||
|---|---|---|---|---|
| Mouse | Human | |||
| Calculated | Measured | Calculated/Measured | ||
| Brain | Glucose | 764.4 | 1270.0, 700.0 (Growdon et al. 1971; Mulligan and Tisdale 1991) | 255.0 |
| Heart | Glucose | 108.7 | 49.1 (Matsui et al. 2006) | 160.0 |
| Free fatty acid | 268.8 | NA | 140.0 | |
| Liver | Free fatty acid | 592.8 | NA | 140.0 |
| Lactate | 437.1 | NA | 180.0 | |
| GI tract | Glucose | 54.5 | 236 (Mulligan and Tisdale 1991) | 38.0 |
| Glycerol | −117.82 | NA | −20.02 | |
| Skeletal muscle | Free fatty acid | 13.6 | NA | 2.3 |
| Adipose tissue | Glucose | 59.1 | 43 (Mulligan and Tisdale 1991) | 3.50 |
| Lactate | −2.42 | NA | 5.1 | |
NA, not available.
1Per kg of organ weight.
2The negative sign indicates substrate release.
Table 9.
Carbohydrates and fat oxidation rates in mouse and human organs.
| Organ/Tissue | Substrate utilization (μmol/min/kg)1 | Xi‐fold | ||||
|---|---|---|---|---|---|---|
| Mouse | Human | Mouse/Human | ||||
| CHO | FAT | CHO | FAT | CHO | FAT | |
| Brain | 30574 | 0 | 10199 | 0 | 3.0 | – |
| Heart | 17163 | 39079 | 9028 | 20300 | 1.9 | 1.9 |
| Liver | −4251.2 | 77160 | −1700 | 11078 | 2.5 | 7 |
| GI tract | 2180.5 | 0 | 1520 | 0 | 1.4 | – |
| Skeletal muscle | 1197.7 | 2078.9 | 180.84 | 360.21 | 6.6 | 5.8 |
| Adipose tissue | 1282.7 | 2874.2 | 52.12 | 117.52 | 24.6 | 24.5 |
CHO, carbohydrate; FAT, fat.
Xi‐fold for each organ/tissue: mouse substrate utilization/human substrate utilization.
Negative sign indicates CHO production.
1Per kg of organ weight
Table 12.
Contribution of CHO and FAT oxidation to substrate utilization in mouse and human organs.
| Organ/Tissue | CHO (%) | FAT (%) | ||
|---|---|---|---|---|
| Mouse | Human | Mouse | Human | |
| Brain | 100.0 | 100.0 | 0.0 | 0.0 |
| Heart | 30.5 | 30.8 | 69.5 | 69.2 |
| Liver | −5.8 | −18.1 | 105.8 | 118.1 |
| GI tract | 100.0 | 100.0 | 0.0 | 0.0 |
| Skeletal muscle | 36.6 | 33.4 | 63.4 | 66.6 |
| Adipose tissue | 30.9 | 30.7 | 69.1 | 69.3 |
Mathematical model
Based on the primary function of the organ/tissue in the whole‐body energy metabolism, we specified the major specialized metabolic pathways, which dictate the exchange and distribution of metabolic fuels among tissues/organs. The main metabolic fuels that exchange among tissues and organs via blood circulation are glucose, free fatty acid, glycerol, triglyceride, lactate, and amino acids (represented here by alanine) (Fig. 2). The systems of metabolic reactions that are present in each tissue and organ are provided in Figure 2 and Appendix 1 (Kim et al. 2007). The distinctive metabolic reactions present in each tissue and organ are shown in Figure 3. The protein breakdown is present in most of the organs/tissues after overnight fasting, however, we considered proteolysis only in skeletal muscle because in all other organs the contribution of proteolysis to whole body is not significant compared to skeletal muscle. Furthermore, although gluconeogenesis also takes place in the GI tract but we neglected for this analysis because its contribution to the whole body is not significant.
Figure 2.
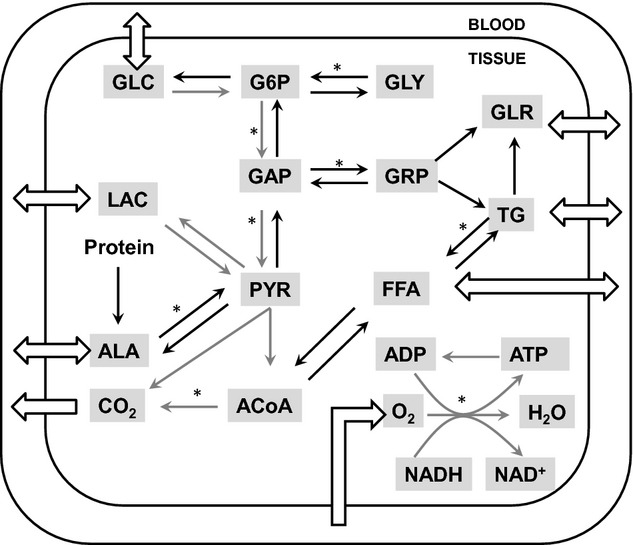
General metabolic pathways in whole‐body model. Eight substrates connected with open arrays are transported between tissue and blood. While gray arrows are common pathways in all tissues, black arrows are tissue‐specific pathways. The pathways marked with (*) are composed of several reaction steps but lumped into one step in this model. ADP, adenosine diphosphate; ATP, adenosine triphosphate; ACoA, acetyl CoA; AA, amino acids; GLC, glucose; G6P, glucose‐6‐phosphate; GAP, glyceraldehyde‐3‐phosphate; GLR, glycerol; GRP, glycerol‐3‐phosphate; GLY, glycogen; FFA, free fatty acid; LAC, lactate; PYR, pyruvate; TG, triglycerides.
Figure 3.
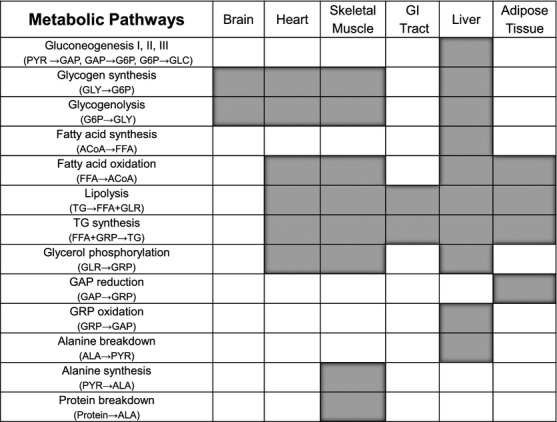
Map for tissue‐specific metabolic pathways. In addition to the common pathways shown in Figure 2, each tissue has different kinds of metabolic pathways. Blank filled with gray color means the existence of the corresponding pathway.
Mass balances
A system of mass balance equations is defined for each tissue/organ system. The mass balance for each metabolite is based on the metabolic flux (production/utilization) and uptake/release rates of the metabolite in each tissue/organ. The metabolic fluxes of substrate production and utilization in tissues and organs depend on many complex biochemical reactions. We assume that the tissue and capillary subcompartments are spatially lumped in all tissues and organs. The concentration dynamics Cx,i(t) of each substrate (i) in each tissue and organ (x) can be described by the following dynamic mass balance equation:
where Vx,i is the volume of substrate i in tissue or organ x, Px,i, and Ux,i are the substrate production and utilization rates in tissue or organ x. Qx is the tissue or organ blood flow rate. The input arterial concentration is Ca,i and the output venous concentration is Cxv,i. At steady state, the transient term is zero so that
The uptake (Uptx,i) or release (Relx,i) of substrate i in tissue or organ x is related to blood flow and arterio‐venous difference:
For substrates that exist only within tissues/organs, we set Qx = 0. The net rate of metabolic reaction is
where ϕx,k→i and βk→i are the flux and stoichiometric coefficient of the reaction from substrate k to substrate i, respectively. The steady‐state mass balance equations for the system of reactions shown in Figure 2 and Appendix 1 are presented in Appendix 2. The specific metabolic functions of each tissue/organ system and the number of metabolites in the pathways determine steady‐state mass balance equations of organs/tissues, which vary from one organ/tissue to another.
Energy balances
The EE for each organ and tissue is related to the carbohydrate and fat oxidation according to the following equation:
where CECHO and CEFAT are the calorific ATP equivalents of carbohydrate and fat oxidation, respectively and ![]() and
and ![]() are the carbohydrate and fat oxidation for organ x (Appendix 3). These fluxes are calculated according to
are the carbohydrate and fat oxidation for organ x (Appendix 3). These fluxes are calculated according to
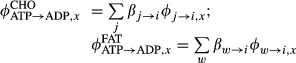 |
where ![]() ,
, ![]() and βj→i, βw→i are fluxes and stoichiometric coefficients of the reaction from substrate j (or w) to substrate i associated with carbohydrate (or fat) utilization.
and βj→i, βw→i are fluxes and stoichiometric coefficients of the reaction from substrate j (or w) to substrate i associated with carbohydrate (or fat) utilization.
We solved coupled steady‐state mass and energy balance equations numerically to obtain estimates of mouse organ/tissue MFs (using MATLAB R2011b, fsolve). We also computed rates of substrate utilization, VO2, and VCO2 for each organ/tissue from the MFs. A model calculation for estimating liver metabolic fluxes is provided in the Appendix 6. The “others” organs/tissues VO2 is determined by subtracting the VO2 of brain, heart, liver, GI tract, muscle, and adipose tissue from the whole‐body VO2.
We also used standard empirical relationships (Tang et al. 2002) to compute whole‐body and organ/tissue (x = brain, liver, heart, skeletal muscle, adipose tissue, GI tract, others) VO2:
The VO2 and VCO2 rates (per unit mass of organ/tissue) thus obtained using both FBA and standard approach are compared.
Model inputs
Substrate uptake/release, metabolic fluxes, energy expenditure, and respiratory quotients are the data inputs to the organ/tissue mathematical model (Fig. 1). To the extent possible, available data from literature are used. In the absence of experimental data, specific assumptions are made to determine metabolic pathway fluxes based on current knowledge of fuel homeostasis in human and mice. Quantification of the key information in each organ/tissue of the mouse is described in the following sections.
Mouse physiological parameters
The model analysis is based on a 30 g adult wild‐type mouse. The weights of the organs and tissues were determined from measurements of organ weights expressed as percent of total body weight (Martin and Fuhrman 1955). The rates of organ and tissue blood flow were calculated from blood flow rates expressed as a fraction of the cardiac output (Q) (Fenneteau et al. 2009). The mouse organ and tissue weights and blood flows are reported in Table 3. The respiratory quotient (RQ) of each organ and tissue in mouse is assumed to be the same as that of an overnight fasting human (Kim et al. 2007) (Table 3). This assumption is consistent with the experimental evidence that whole‐body RQ under fasting conditions is similar in both human and mice (Kim et al. 2007; Kaiyala et al. 2010).
Table 3.
Mouse and human physiological parameters.
| Organ/Tissue | Mass | Blood flow | Respiratory quotient (RQ) (Kim et al. 2007)3 | ||||
|---|---|---|---|---|---|---|---|
| Mouse (Martin and Fuhrman 1955) | Human (Lindstedt and Schaeffer 2002; Kim et al. 2007) | Mouse (Fenneteau et al. 2009) | Human (Kim et al. 2007) | Mouse/Human | |||
| (g) | (% of BW) | (103g) | (% of BW) | (mL/min/100 g)1 | (mL/min/100 g)1 | (−) | |
| Brain | 0.54 | 1.8 | 1.49 | 2.1 | 98.15 | 50.34 | 1.0 |
| Heart | 0.17 | 0.57 | 0.25 | 0.36 | 658.82 | 100.0 | 0.79 |
| Liver | 1.86 | 6.2 | 1.5 | 2.1 | 146.77 | 100.0 | 0.72 |
| GI tract | 2.65 | 8.83 | 2.0 | 2.9 | 90.19 | 55.0 | 1.0 |
| Skeletal Muscle | 10.27 | 34.23 | 27.8 | 39.7 | 26.19 | 3.24 | 0.78 |
| Adipose Tissue | 3.10 | 10.33 | 11.0 | 15.7 | 38.39 | 3.27 | 0.81 |
| Others | 11.41 | 38.03 | 25.96 | 37.1 | 55.21 | 2.47 | 0.80/0.67 (this work) |
| Whole body | 30.0 | 100.0 | 70.0 | 100.0 | 56.47 | 7.86 | 0.77/0.82 |
Appearance rates of substrate in plasma
The appearance (or disappearance) of metabolic fuels in plasma occurs when one or more organs and tissues release (or take up) substrates. Under steady‐state conditions, the appearance rate equals the disappearance rate. The rate of appearance of various substrates in plasma measured in an overnight fasting (8–16 h) mouse from tracer infusion studies are reported in Table 10 (Andrikopoulos and Proietto 1995; Xu et al. 2002; Goudriaan et al. 2005; Bergman et al. 2006; Chacko et al. 2012).
Substrate uptake/release rates
The rate of uptake of glucose determined using isotope tracers are available in literature for brain, heart, GI tract, skeletal muscle, and adipose tissue (Tables 2 and 5). Unknown mouse substrate uptake/release rates were calculated based on appearance rates of substrate in the plasma of mice and the fractional rates of substrate uptake/release in humans (Table 2):
Table 2.
Mouse organ/tissue substrate uptake/release rates.
| Organ/tissue | Uptake (Upt) Release (Rel) | Uptake/Release as %Ra of substrate | Upt/Rel (μmol/min/kg)1 | Reference |
|---|---|---|---|---|
| Heart | UptLAC | 12.9% of Ra,LAC | 708.3 | (Kim et al. 2007) |
| Liver | RelGLC | 100% Ra,GLC | 1154.82 | (Chacko et al. 2012) |
| RelTG | 100% Ra,TG | 10.8 | (Kim et al. 2007) | |
| UptGLR | 100% of Ra,GLR | 545.7 | (Kim et al. 2007) | |
| UptALA | 100% of Ra,ALA | 860.2 | (Kim et al. 2007) | |
| GI | UptTG | 20.7% of Ra,TG | 1.6 | (Kim et al. 2007) |
| RelFFA | 36.2% of Ra,FFA | 353.3 | (Kim et al. 2007) | |
| Skeletal muscle | UptGLC | Mouse data | 58.32 | (Toyoda et al. 2011) |
| RelLAC | 36.1% of Ra,LAC | 32.8 | (Kim et al. 2007) | |
| UptTG | 10.3% of Ra,TG | 0.2 | (Kim et al. 2007) | |
| RelGLR | – | 0.23 | (Kim et al. 2007) | |
| RelALA | 100% of Ra,ALA | 155.8 | (Kim et al. 2007) | |
| Adipose tissue | UptTG | 69% of Ra,TG | 4.5 | (Kim et al. 2007) |
| RelGLR | 70.4% of Ra,GLR | 230.6 | (Kim et al. 2007) | |
| RelFFA | 63.7% of Ra,FFA | 531.2 | (Kim et al. 2007) |
Ra, appearance rate; Upt, substrate uptake; Rel, substrate release rate.
All substrate uptake/release rates otherwise indicated by 2 and 3 are calculated using the following assumption. The appearance rate fraction of metabolic fuels taken out (or released) of (or into) plasma by organs/tissues is similar in both human and mouse. Mouse organ/tissue substrate uptake/release rates were calculated by multiplying appearance rate fraction of metabolic fuels of human organs/tissues with mouse appearance rate of substrates in plasma (Ra,i) reported in Table 10.
The RelGLC from liver and UptGLC into skeletal muscle were determined using isotope tracers.
1Per kg of organ weight.
2Experimental data.
3The relationships of RelGLR = UptTG in mouse muscle was based on the substrate uptake/release rate in human muscle.
Fractional rates of substrate uptake/release determine tissue/organs contributions to appearance rates of substrate in the plasma. It is assumed that the appearance rate fractions of metabolic fuels taken (or released) out of (or into) plasma by organs/tissues are similar in both human and mouse (Table 2). Based on the literature (Kim et al. 2007), we can specify substrate uptake (or release) by (or from) each tissue and organ. We assume that all the glucose that appears in plasma comes from liver and all other organs/tissues consume glucose, which holds true both in human and mouse. Adipose tissue (AT) and GI tract are the sources of FFA in the plasma, while all other organs consume FFA. Glycerol is released from AT, GI tract, and skeletal muscle (SM), while liver consumes all plasma glycerol. Triglyceride (TG) is released by liver, while TG is consumed by the GI tract, SM, and AT. Alanine is released by SM and consumed by liver. We assumed alanine as the representative amino acid of all amino acids. Lactate is released by SM, AT, and “others” tissues (e.g., red blood cells) and consumed by liver and heart. The organ/tissue substrate uptake/release rates are presented in Tables 2.
Metabolic fluxes
The metabolic fluxes (MFs) of glucose to glucose‐6‐phosphate (ϕGLC→G6P) and glycogen to glucose‐6‐phosphate (ϕGLY→G6P) are available in literature for mouse liver, which are determined using isotope tracers (Table 1). For any MF that is not known from literature, we assume organ/tissue MFs that the reaction flux (per unit weight of organ/tissue) in mouse is equal to the reaction flux in human (Table 1). This assumption corresponds to the flux relationship between ϕGLC→G6P and ϕGLY→G6P from MFs measured in mouse and human liver (Mulligan and Tisdale 1991; Kim et al. 2007; Chacko et al. 2012).
Organ energy expenditure
To calculate EE of mouse organs and tissues, we used an allometric function that relates EE (kcal/kg/day) to body mass BW (kg) (Wang et al. 2012):
where αx and βx are the parameters for organ x, which are reported in Table 11. EEx refers to the energy expenditure of organs and tissues, and BW refers to the mouse whole body mass under overnight fasting conditions (unless otherwise specified). Similar allometric functions that relate organ size to body mass were successfully used to estimate organ masses of different mature mammalian species ranging in body size from mice to elephants (Elia 1992; Wang et al. 2001). Furthermore, the whole‐body EE determined from the sum of the EE of individual organs predicted the whole‐body EE, which is a function of BW (Wang et al. 2012). Therefore, we chose this relation as a first approximation to obtain mouse organ/tissue EE.
Table 11.
Parameters of the organ/tissues EE allometric relationships (Wang et al. 2012).
| Organ/Tissue | α | β |
|---|---|---|
| Brain | 446.6 | −0.1423 |
| Heart | 890.3 | −0.1181 |
| Liver | 683.9 | −0.2677 |
| Kidneys | 689.7 | −0.0833 |
| Other organs | 29.96 | −0.1667 |
This allometric equation was used to calculate EE only for brain, heart, liver, kidney, and “residual” organs/tissues. The EE of the GI tract was evaluated using equation 9 with the parameters of the “residual organs”. The EE of “others” was evaluated as the weighted average of kidney EE and other nonspecified organs and tissues. Kidney EE was evaluated using equation 9. Other nonspecified organs and tissues EE was determined using equation 9 with the parameters of the “residual organs”. The adipose tissue EE was evaluated using the specific metabolic activity of fat mass proposed in a previous study (Guo and Hall 2011) (Appendix 4). Muscle EE was evaluated subtracting EEs of brain, heart, liver, GI, and “others” from the fat‐free mass (FFM) EE of the whole body. The EE of mouse and human FM and FFM are reported in Appendix 4. For human tissues/organs, the values of EE was evaluated using sum of the carbohydrate and fat substrate utilization rates estimated from flux balance analysis (Kim et al. 2007). The EE of mouse and human organs and tissues are reported in Table 4.
Mouse whole‐body VO2 prediction
Using body composition and oxygen consumption data for each organ and tissue, the whole‐body VO2 (mL/h) can be predicted according to:
where Mx is the organ/tissue mass (g) and VO2,x is the oxygen consumption (mL/h/g) of the organ/tissue x of a 30 g wild‐type mouse. For this prediction, the masses (Fig. 4A) and estimated rates of VO2 (Table 6) of mouse organs/tissues were used for HRS/J strain of mice at 23 and 30°C (Konarzewski and Diamond 1995).
Figure 4.
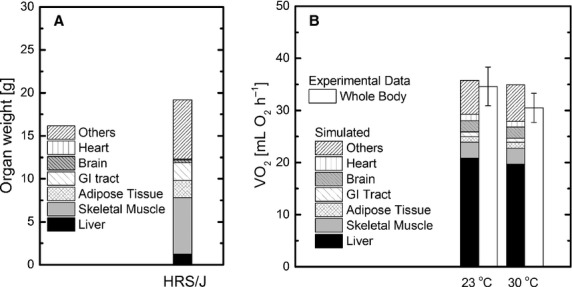
(A) Body composition; (B) Comparison of whole‐body VO2 of the HRS/J mouse strain between simulated and experimental data obtained at 23° and 30°C.
Table 6.
Mouse VO2 and VCO2 rates calculated with flux balance analysis (FBA) and standard approach.
| Organ/Tissue | VO2 (mL/min/kg1) | VCO2 (mL/min/kg1) | ||
|---|---|---|---|---|
| FBA | Standard approach | FBA | Standard approach | |
| Brain | 102.74 | 102.47 | 102.74 | 102.47 |
| Heart | 200.70 | 197.40 | 158.55 | 155.95 |
| Liver | 278.19 | 259.68 | 200.29 | 186.97 |
| GI tract | 7.33 | 7.31 | 7.33 | 7.31 |
| Skeletal muscle | 11.45 | 11.54 | 8.93 | 9.00 |
| Adipose tissue | 15.69 | 14.51 | 12.71 | 11.76 |
1Per kg of organ weight.
Sensitivity analysis
We simulated the effect of ±25% changes of the metabolic fluxes and substrate uptake/release rates from mouse basal levels (Tables 1 and 2) derived from human data on carbohydrate and fat utilization rates. Some simulations of metabolic flux or substrate uptake/release variations produced negative intraorgan fluxes that were ignored as not physiological.
Results
Energy expenditure
The EE (per organ/tissue mass) of all mouse organs/tissues is significantly higher than their respective human organs/tissues (Table 4). The EE of brain, heart, liver, and GI tract in mouse is 3.0, 1.9, 7.8, and 1.4 times higher than the respective organ/tissue in human. The EE of muscle and adipose tissue in mouse are 6.0 and 24.5 times higher than those tissues in human. The EE of FFM and FM in mouse are 7.9 and 25.0 times higher than those tissues in human (Appendix 4).
Organ/tissue metabolic fluxes and rates
For each organ/tissue, Equations (2–6) were solved to quantify metabolic fluxes and rates of O2 consumption, CO2 production, as well as rates of substrate uptake/release and utilization. As a representative case, the model calculation to estimate the liver metabolic fluxes is given in the Appendix 6 and results are presented in Figure A1. The inputs to the model equations are reported in the Tables 1–4 and 10. The solution of the mass and energy balance provides the rates of substrate uptake/release and gas exchange of mouse organs/tissues (Tables 5–6) and whole body (Table 7), the metabolic fluxes (Table 8), and substrate utilization (Table 9). For convenience, the simulated metabolic pathway fluxes are reported in Table 8 with the input metabolic fluxes highlighted in bold.
Table 7.
Whole‐body fuel metabolic fluxes.
| Metabolic flux | Mouse | Human | Xi‐fold |
|---|---|---|---|
| (μmol/min/kg)1 | Mouse/Human | ||
| Glycogenolysis | 14.8 | 5.4 | 2.7 |
| Gluconeogenesis | 56.8 | 5.0 | 11.4 |
| De novo lipogenesis | 4.8 | 0.3 | 16.7 |
| Proteolysis | 44.3 | 4.0 | 11.1 |
| Lipolysis | 36.7 | 3.9 | 9.4 |
Xi‐fold for each flux: mouse flux/human flux.
1Per kg of body weight.
Table 8.
Mouse organ/tissue metabolic fluxes.
| Fluxes | Metabolic fluxes (μmol/min/kg)1 | |||||
|---|---|---|---|---|---|---|
| Brain | Heart | Liver | GI | Skeletal muscle | Adipose tissue | |
| GLC → G6P | 764.4 | 108.7 | 73.1 | 54.5 | 58.3 | 59.3 |
| G6P → GAP | 764.4 | 108.7 | 73.1 | 54.5 | 58.3 | 59.3 |
| GAP → PYR | 1528.8 | 217.5 | 146.2 | 109.0 | 116.6 | 72.5 |
| PYR → GAP | – | – | 1443.6 | – | – | – |
| GAP → G6P | – | – | 1978.5 | – | – | – |
| G6P → GLC | – | – | 1228 | – | – | – |
| G6P → GLY | 2.0 | 160.0 | 66.7 | – | 6.25 | – |
| GLY → G6P | 2.0 | 160.0 | 305.4 | – | 6.25 | – |
| PYR → LAC | 469.8 | 352.0 | 140.0 | 100.0 | 77.2 | 3.3 |
| LAC → PYR | 469.8 | 1060.3 | 577.1 | 100.0 | 44.4 | 0.9 |
| GLR → GRP | – | 16.0 | 548.4 | – | 6.3 | 0.0 |
| GAP → GRP | – | – | 0.0 | – | 0.0 | 46.1 |
| GRP → GAP | – | – | 534.9 | – | 0.0 | – |
| PYR → ALA | – | – | 0.0 | – | 26.5 | – |
| ALA → PYR | – | – | 860.2 | – | 0.00 | – |
| PYR → ACoA | 1528.8 | 925.8 | 0.0 | 109.0 | 57.3 | 70.2 |
| FFA → ACoA | – | 268.8 | 569.7 | – | 14.2 | 22.3 |
| ACoA → FFA | – | – | 74.7 | – | – | – |
| TGL → GLR | – | 16.0 | 2.7 | 117.8 | 6.50 | 230.6 |
| FFA → TG | – | 48.0 | 40.4 | – | 18.9 | 138.4 |
| ACoA → CO2 | 1528.8 | 3076.1 | 4483.1 | 109.0 | 170.7 | 248.6 |
| O2 → H2O | 4586.3 | 8959.4 | 12418.8 | 327.1 | 511.3 | 700.5 |
| ATP → ADP | 30574.1 | 56241.7 | 72908.6 | 2180.5 | 3276.6 | 4156.8 |
| Protein → ALA | – | – | – | – | 129.3 | – |
Values in bold are assumed fluxes (see Table 1) and the rest are calculated with flux balance analysis.
1Per kg of organ weight.
Glucose uptake and gas exchange rates
The estimated glucose uptake in the brain and adipose tissue is within the range of the measured glucose uptake. The estimated glucose uptake, for heart is almost twofold higher, and for GI tract is an order‐of‐magnitude lower, than the measured glucose uptake (See Table 5). The VO2 and VCO2 are compared with those calculated with the standard approach Eq. 9 (Tang et al. 2002) (Table 6). The VO2 and VCO2 for brain, heart, GI tract, muscle, and adipose tissue estimated using these two approaches are similar. In contrast, the VO2 and VCO2 of the liver differ significantly between these two approaches.
Whole‐body metabolic fluxes
With our methods, we could estimate whole‐body metabolic fluxes including glycogenolysis and gluconeogenesis (Table 7). The equations that relate organ/tissue to whole‐body metabolic fluxes are provided in Appendix 5. The results quantify the higher whole‐body metabolic fluxes in mouse compared to human. Gluconeogenesis in mouse is about 11 times higher than that in human. The rates of de novo lipogenesis, proteolysis, and lipolysis are about 16, 11, and 9 times respectively higher in mouse than those in human.
Substrate utilization rates
The rates of carbohydrate (CHO) and FAT utilization in mouse organs/tissues are higher compared to human (Table 9). FAT utilization is absent in the brain and GI tract of mouse and human. The relative contributions of CHO and FAT to energy production are reported in Table 12. The percent contribution of CHO and FAT to energy production in the liver is significantly different for mouse and human, but they are only slightly different in heart, muscle, and adipose tissue. CHO is the only fuel for brain and GI tract energy metabolism and FAT utilization is absent in these organs. The negative carbohydrate utilization of liver indicates that liver is producing glucose with the energy from fat metabolism.
Whole‐body VO2 prediction
The predicted organ and whole‐body VO2 at 23°C and 30°C for HRS/J strain of mice were reported in Figure 4B. The simulated whole‐body VO2 is close to the experimental value at 23°C, while the simulated VO2 at 30°C is slightly higher than the measured value (Konarzewski and Diamond 1995).
Sensitivity analysis
The sensitivity results are presented in Figure 5. When ϕG6P→GLY flux in liver varied by ±25%, the carbohydrate utilization value varied slightly (±2.7%) and the fat utilization varied less than ±1% (Fig. 5A). From a ±25% variation of UptGLR,Liver, the carbohydrate utilization changed by ±9.6%, and the fat utilization varied less than ±1% (Fig. 5B). When RelLAC,SM varied by ±25%, small changes occurred in carbohydrate (±4.1%) and fat utilization (±2.4%) (Fig. 5C). The variation in other metabolic fluxes and substrate uptake/release (±25%) derived from human data (Tables 1 and 2) had negligible (<1%) effect on carbohydrate and fat utilization rates. When ϕFFA→TG flux and RelFFA and RelGLR rates in adipose tissue were changed by ±25%, the results produced negative values of metabolic fluxes, which are not physiological. The simultaneous (+25%) variation of RelFFA and RelGLR affected carbohydrate and fat utilization rates by +20% and −40%, respectively (Fig. 5D).
Figure 5.
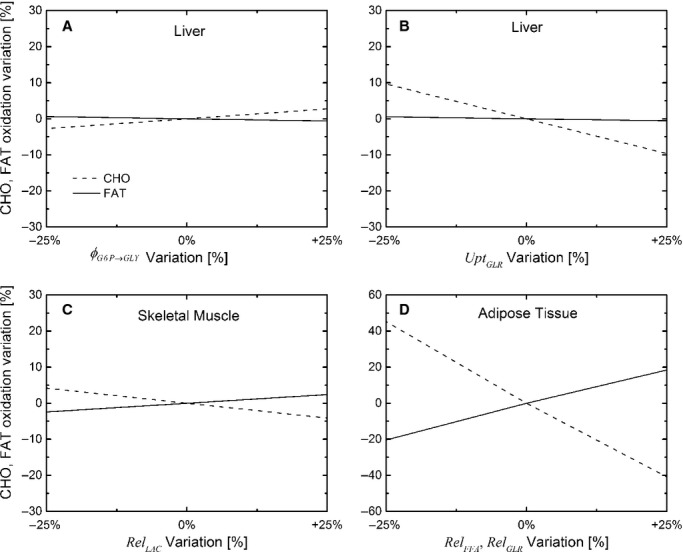
Sensitivity analysis. The effect of variation (±25% from the base case value) of ϕG6P→GLY in liver (A), UptGLR in liver (B), RelLAC, in skeletal muscle (C), and simultaneous variation (±25% from the base case value) of RelFFA and RelGLR in adipose tissue (D) on carbohydrate and fat utilization.
Discussion
Mouse metabolism
In this study, a multiorgan analysis is applied to obtain mouse organ/tissue metabolic fluxes and rates of exchange of substrates. Using mass and energy balances for each organ, the rates of organ/tissue carbohydrate and fat utilization are evaluated. In turn, rates of substrate utilization were used to obtain organ/tissue energy expenditure (EE). The whole‐body and organ/tissue physiological parameters, EE, rates of substrate utilization, and rates of oxygen consumption of mice and humans are compared to quantify the differences in their energy and metabolic processes.
Flux balance analysis in determining energy expenditure
The flux balance analysis with limited experimental data (organ/tissue metabolic fluxes and whole‐body metabolic parameters) can be used to quantify the fluxes that cannot be obtained easily with experiments and identifies the number of experiments required for obtaining unknown measurements (Tables 5,7–8). Currently, experimental data related to rates of free fatty acid uptake of heart, liver, skeletal muscle, lactate uptake/release of liver and adipose tissue, and glycerol release from GI tract are not available for mice. Our model analysis yields estimates of these rates. Furthermore, the model also estimates rates of glucose uptake for brain, heart, adipose tissue, and GI tract. We observed few differences between rates of glucose uptake obtained with model simulations and experiments. The rates of glucose uptake of brain and adipose tissue derived with model simulations are consistent with the experimental data (Table 5). This indicates that the model proposed with EE values and other assumptions utilized for these organs are consistent with experimental data obtained under similar physiological conditions. On the other hand, significant differences were noticed between estimated and measured rates of glucose uptake for heart and GI tract (Table 5). These differences in glucose uptake could be related to the inputs values for EE used for heart and GI tract. It is expected that for the same RQ, the increase in the EE of organs/tissues results in the simultaneous increase in the rates of carbohydrate and fat oxidation, which is followed by an increase in glucose and fatty acid uptake and vice versa. Therefore, the lower (or higher) glucose uptake for GI tract (or heart) can be caused by an underestimation (or overestimation) of the EE determined by allometric functions. This was verified by simulations using different EE values of GI tract and heart. The actual EE of GI tract and heart used for the FBA are 0.14 and 0.23 kcal/day, respectively. It was found that at 0.61 kcal/day EE value, the GI tract measured, and estimated rates of glucose uptake (234.3 μmol/min/kg) are the same. At 0.2 kcal/day EE value, the measured and calculated rates of glucose uptake by the heart (49.1 μmol/min/kg) are the same and the free fatty acid uptake by the heart decreased from 268.8 to 234.3 μmol/min/kg (Table 5).
Sensitivity analysis for model justification and experiment design
Under the assumption that the metabolic flux per unit organ/tissue mass in mouse and human are similar (Table 1), sensitivity analysis indicates that variations of most metabolic fluxes have a minor effect on the organ substrate utilization. Under the assumption that the appearance rate fractions of metabolic fuels in organs/tissues are similar in both human and mouse (Table 2), variations in all organ/tissue substrate uptake/release rates, only a few showed moderate sensitivity to carbohydrate and fat utilization. (Fig. 5B and C). Since FFA and GLR are both stoichiometrically related to lipolysis (3:1), RelFFA and RelGLR rates (Table 2) are closely coupled and significantly affect carbohydrate and fat utilization rates. Therefore, the relationship between RelFFA and RelGLR in mouse is similar in human. Since RelFFA and RelGLR were estimated using appearance rates of Ra,FFA and Ra,GLR from mouse, the substrate utilization rates estimated in the base case (Table 9 and 12) are plausible. Variation of most assumptions in Tables 1 and 2 has minimal effects on estimates of organ and whole‐body substrate utilization. This sensitivity analysis not only quantified the effect of assumptions on the model outputs, but also identified the most critical metabolic fluxes affecting organ substrate utilization and energy expenditure.
Whole‐body metabolic fluxes
The model also yields estimates of whole‐body metabolic fluxes including gluconeogenesis, de novo lipogenesis, glycogenolysis, lipolysis, proteolysis, and oxidation of macronutrients (Tables 7, 9, and 12). These fluxes are higher in mouse than those in human organs/tissues. For example, the rates of gluconeogenesis and glycogenolysis in mouse liver are 11.4 and 2.7 fold higher than that in human liver, respectively. This is mainly due to the difference in the utilization of glucose as the fuel under overnight fasting conditions. This is supported by a glucose level in mouse plasma 6.6‐fold higher than that in human. The major source of glucose production under fasting conditions via gluconeogenesis and glycogenolysis is the liver.
Comparison of mouse and human metabolism
The whole‐body energy expenditure (expressed per unit BW) in mouse is significantly higher than in human. Furthermore, the organ/tissue contribution to the whole‐body metabolic rate differs in mouse and human. The liver consumes about 52% and 20% of whole‐body energy expenditure in mouse and human, respectively, whereas the contributions of brain, heart, GI tract, skeletal muscle to the whole‐body energy expenditure in mouse are comparatively smaller than those in human (Table 4). These differences in the energy expenditure of mice and humans can be related to differences in the body composition and organ/tissue metabolic activities. While the size of liver and GI tract in mouse relative to body weight are about 3 times that in human, the proportions of skeletal muscle and adipose are lower in mice than that in human (Table 3). The energy expenditure of organs and tissues are higher in mouse than in human (Table 4), which can be related to the differences in the cellular and structural constituents of organs and tissues in these species. Although no direct evidence supports this argument, it can be inferred from studies (Elia 1992) that the energy expenditure of rat cerebral tissue is twofold higher than that in human. The higher energy expenditure of rat cerebral tissue was linked to a much smaller proportion of glial cells (i.e., lower energy expenditure). Furthermore, fiber type and composition of skeletal muscle vary across species. Similar muscles in different species may have different functional and metabolic properties (Schiaffino and Reggiani 2011; Bloemberg and Quadrilatero 2012). The citrate synthase activity, an indicator of mitochondria content, is higher in mouse than in human skeletal muscle, while the fraction of type I fibers in human skeletal muscle is higher than in rodents (Schiaffino and Reggiani 2011). Thus, the higher energy expenditure in mouse can be attributed to the higher mitochondrial density. The higher energy expenditure of mouse at whole‐body and organ/tissue levels is also related to higher rates of organ/tissue carbohydrate and fat oxidation (Table 9) and higher rates of glycogenolysis, gluconeogenesis, de novo lipogenesis, proteolysis, and lipolysis whole‐body metabolic fluxes (Table 7). The higher metabolic activity is also related to more heat loss in mouse than in human (Blaxter 1989).
Mouse oxygen consumption rate
The model predicted the whole‐body VO2 at 23°C for HRS/J strain (Fig. 4B), but overestimated VO2 at 30°C by 15%. This may be related to data at ambient temperature, which can have a significant effect on the mouse metabolic rate (Speakman 2013). A temperature variation of 7–10°C leads to 10–30% of change of the basal metabolic rate (Konarzewski and Diamond 1995; Golozoubova et al. 2004) Therefore, an overestimation of the basal metabolic rate of 15% appears plausible since the model does not take into account the effect of the temperature on the energy expenditure.
The liver VO2 from flux balance analysis differ from indirect calorimetry (Table 6). This difference is mainly due to the inclusion of the stoichiometric reactions of glycogenolysis, gluconeogenesis from alanine and glycerol used for quantifying EE from the main metabolic pathways.
Overview of model analysis
In this study, the organ/tissue contributions to the energy expenditure are quantified using a system of mass and energy balance equations based on the fluxes of the main energy metabolism pathways of each organ. This analysis incorporates available data on metabolic fluxes, substrate uptake and release rates, respiratory quotient (Tables 1–3), and organ/tissue EE allometric relationships. Since experimental data in support of various assumptions are lacking, the reliability of the model predictions is limited. On the other hand, this model analysis can be applied to identify the minimal set of metabolic flux measurements to determine the organ/tissues EE without using any assumptions for EE, metabolic fluxes, or respiratory quotients in Tables 1–3.
Conclusions
The methodology developed in this study can be useful in the design of experimental studies to quantify the metabolic fluxes affecting energy expenditure in mouse models of disease. Furthermore, an integrative approach that combines limited experimental data and computational modeling can quantify changes in the tissue/organ metabolic activities taking into account body composition and metabolic or physiological differences between species. In future studies, contributions of kidney, lungs, and skin to the whole‐body energy balance can be included when sufficient data becomes available. To analyze weight regulation in disease, diet, or exercise, the tissue/organ metabolic flux network presented here would have to be integrated with hormonal control. In summary, the method presented quantifies the energy expenditure of mouse organs using metabolic flux measurements. This methodology can be used as an alternative approach to the traditional measurements based on Fick's principle to determine the organ energy expenditure. The theoretical framework is a paradigm for direct and quantitative human–mouse comparison of fuel utilization in tissue/organ systems and whole‐body fluxes under various metabolic or physiological conditions.
Conflict of Interest
None declared.
Appendix
Biochemical reactions of the metabolic pathways in tissue/organ x
| 1. Glycolysis I | GLC + ATP → G6P + ADP |
| 2. Glycolysis II | G6P + ATP → 2GAP + ADP |
| 3. Glycolysis III | GAP + Pi + NAD+ + 2ADP → PYR + NADH + 2ATP |
| 4. Gluconeogenesis I | PYR + 3ATP + NADH → GAP + 3ADP + NAD+ + 2Pi |
| 5. Gluconeogenesis II | 2GAP → G6P + Pi |
| 6. Gluconeogenesis III | G6P → GLC + Pi |
| 7. Glycogenesis | G6P + ATP → GLY + ADP + 2Pi |
| 8. Glycogenolysis | GLY + Pi → G6P |
| 9. Pyruvate reduction | PYR + NADH → LAC + NAD+ |
| 10. Lactate oxidation | LAC + NAD+ → PYR + NADH |
| 11. Glycerol phosphorylation | GLR + ATP → GRP + ADP |
| 12. GAP reduction | GAP + NADH → GRP + NAD+ |
| 13. Glycerol 3‐P oxidation | GRP + NAD+ → GAP + NADH |
| 14. Alanine formation | PYR → ALA |
| 15. Alanine utilization | ALA → PYR |
| 16. Pyruvate oxidation | PYR + CoA + NAD+ → ACoA + NADH + CO2 |
| 17. Fatty acid oxidation | FA + 8CoA + 2ATP + 14NAD+ → 8ACoA + 2ADP + 2Pi + 14NADH |
| 18. Fatty acid synthesis | 8ACoA + 7ATP + 14NADH → FA + 8CoA + 7ADP + 7Pi + 14NAD+ |
| 19. Lipolysis | TGL → GLR + 3FA |
| 20. Triglyceride synthesis | GRP + 3FA + 6ATP → TGL + 6ADP + 7Pi |
| 21. TCA cycle | ACoA + ADP + Pi + 4NAD+ → 2CO2 + CoA + ATP + 4NADH |
| 22. Oxidative phosphorylation | O2 + 6ADP + 6Pi + 2NADH → 2H2O + 6ATP + 2NAD+ |
| 23. Protein breakdown | Protein → ALA |
| 24. ATP hydrolysis | ATP → ADP + Pi |
Figure 8.
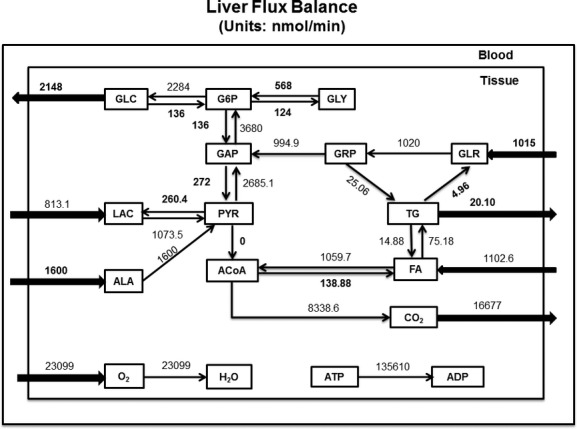
The model equations were solved using the function fsolve in MATLAB. Some of the data inputs were highlighted in bold font in the flux balance diagram. The other data inputs are, RQ: 0.72; EE: 225.7 10−5 kcal min−1; CECHO: 16.8 10−9 kcal nmol−1; CEFAT: 16.6 10−9 kcal nmol−1; All metabolic fluxes are in nmol min−1.
Appendix
Steady‐state mass balance equations of metabolite in tissue/organ x
| 1. Glucose | ϕG6P→GLC − ϕGLC→G6P + Qx(Ca,GLC − Cv,GLC) = 0 |
| 2. Pyruvate | ϕGAP→PYR + ϕLAC→PYR + ϕALA→PYR − ϕPYR→GAP − ϕPYR→LAC − ϕPYR→ALA − ϕPYR→ACoA + Qx(Ca,PYR − Cv,PYR) = 0 |
| 3. Lactate | ϕPYR→LAC − ϕLAC→PYR + Qx(Ca,LAC − Cv,LAC) = 0 |
| 4. Alanine | ϕPYR→ALA + ϕProtein→ALA − ϕALA→PYR + Qx(Ca,ALA − Cv,ALA) = 0 |
| 5. Glycerol | ϕTG→GLR − ϕGLR→GRP + Qx(Ca,GLR − Cv,GLR) = 0 |
| 6. Free Fatty acid |
|
| 7. Triglyceride |
|
| 8. Oxygen |
|
| 9. Carbon dioxide |
|
| 10. Glucose 6 phosphate |
|
| 11. Glycogen | ϕG6P→GLY − ϕGLY→G6P = 0 |
| 12. Glyceraldehyde Phosphate |
|
| 13. Glycerol phosphate |
|
| 14. Acetyl coenzyme A |
|
| 15. Coenzyme A |
|
| 16. NAD+ |
|
| 17. NADH |
|
| 18. ATP |
|
| 19. ADP |
|
| 20. Pi |
|
Appendix
Energy balance equations
| Organ/Tissue | Carbohydrate utilization, |
|---|---|
| Brain |
|
| Heart |
|
| Liver |
|
| GI tract |
|
| Skeletal muscle |
|
| Adipose tissue |
|
| Fat utilization |
|
|---|---|
| Brain |
|
| Heart |
|
| Liver |
|
| GI tract |
|
| Skeletal muscle |
|
| Adipose tissue |
|
Where carbohydrate and fat oxidation fraction is defined as follows:
The overall energy balance for each organ/tissue system is
where, CECHO (16.825 10−9 kcal/nmol) and CEFAT 16.653 10−9 kcal/nmol) are the carbohydrate and fat calorific equivalent of ATP, respectively.
Appendix
Estimation of FM and FFM energy expenditure
Under fasting conditions, the energy expenditure (EE) model for mouse reported by Guo and Hall (2011) reduces to
Where K is the basal thermogenesis rate, while γFM (30 kcal/kg/day) and γFFM (150 kcal/kg/day) are the specific metabolic rates of fat mass (FM) and free fat mass (FFM), respectively. The EE of FM and FFM are calculated with the following equations:
where k (per unit of body mass) is added to the metabolic rates of FFM and FM. We assumed that each gram of 30 g mouse equally contributes to basal thermogenesis. Therefore, k (K per unit of body mass) is 70 kcal/kg/day. The energy expenditure of FFM and FM are reported in Table 4.1.
Human FFM EE (per unit FFM mass) was obtained by dividing sum of the absolute EEs of brain, heart, liver, GI tract, muscle, and others with their total mass and FM EE (per unit FM mass) is similar to the adipose tissue EE (per unit adipose mass).
Appendix
Whole‐body metabolic fluxes
| 1. | Glycogenolysis = |
| 2. | Gluconeogenesis = |
| 3. | De novo lipogenesis |
| 4. | Proteolysis = |
| 5. | Lipolysis = |
Appendix
Model calculations for quantifying liver metabolic fluxes
No of equations: (21) Mass balance (19), energy balance (1), congruence relationship (1)
No of variables: (38) RQ, EE, CECHO, CEFAT, RelGLC, RelTG, UptGLR, UptALA, UptLAC, UptFFA, ![]() ,
, ![]() ,
,
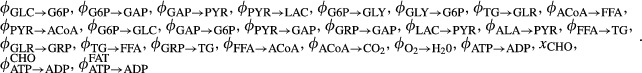 |
Number of data inputs: (38−21 = 17) RQ, EE, CECHO, CEFAT, RelGLC, RelTG, UptGLR, UptALA,
| Substrate steady‐state mass and energy balance equations (21) | |
| 1. Glucose |
|
| 2. Glucose‐6‐phosphate |
|
| 3. Glyceraldehyde phosphate |
|
| 4. Lactate | ϕPYR→LAC − ϕLAC→PYR + UptLAC = 0 |
| 5. Pyruvate | ϕGAP→PYR + ϕLAC→PYR + ϕALA→PYR − ϕPYR→GAP − ϕPYR→LAC − ϕPYR→ACoA = 0 |
| 6. Alanine | − ϕALA→PYR + UptALA = 0 |
| 7. Triglyceride |
|
| 8. Glycerol | ϕTG→GLR − ϕGLR→GRP + UptGLR = 0 |
| 9. Glycerol phosphate |
|
| 10. TG to FFA | ϕTG→FFA − 3ϕTG→GLR = 0 |
| 11. GRP to TG |
|
| 12. Free fatty acid |
|
| 13. Acetyl coenzyme A |
|
| 14. Oxygen |
|
| 15. Carbon dioxide |
|
| 16. Respiratory quotient |
|
| 17. ATP |
|
| 18. CHO utilization |
|
| 19. FAT utilization |
|
| 20. CHO contribution to TCA cycle |
|
| 21. Overall energy balance |
|
Footnotes
Funding Information
This research was supported in part by NIH grants from NIGMS (GM088823), NIAMS (K25AR057206), and NIDDK (DK027651).
References
- Andrikopoulos S., Proietto J. 1995. The biochemical basis of increased hepatic glucose production in a mouse model of type 2 (non‐insulin‐dependent) diabetes mellitus. Diabetologia; 38:1389-1396. [DOI] [PubMed] [Google Scholar]
- Bergman B. C., Jensen D. R., Pulawa L. K., Ferreira L. D., Eckel R. H. 2006. Fasting decreases free fatty acid turnover in mice overexpressing skeletal muscle lipoprotein lipase. Metabolism; 55:1481-1487. [DOI] [PubMed] [Google Scholar]
- Blaxter K. L. Energy metabolism in animals and man. Cambridge, U.K: Cambridge Univ. Press; 1989. p. 336. [Google Scholar]
- Bloemberg D., Quadrilatero J. 2012. Rapid determination of myosin heavy chain expression in rat, mouse, and human skeletal muscle using multicolor immunofluorescence analysis. PLoS ONE; 7:e35273. [DOI] [PMC free article] [PubMed] [Google Scholar]
- Chacko S. K., Haymond M. W., Sun Y., Marini J. C., Sauer P. J., Ma X. 2012. Effect of ghrelin on glucose regulation in mice. Am J Physiol Endocrinol Metab; 302:E1055-E1062. [DOI] [PubMed] [Google Scholar]
- Choi J., Antoniewicz M. R. 2011. Tandem mass spectrometry: a novel approach for metabolic flux analysis. Metab. Eng.; 13:225-233. [DOI] [PubMed] [Google Scholar]
- Elia M. Organ and tissue contribution to metabolic rate. Energy metabolism: tissue determinants and cellular corollaries. New York, NY: Raven Press; 1992. [Google Scholar]
- Fenneteau F., Turgeon J., Couture L., Michaud V., Li J., Nekka F. 2009. Assessing drug distribution in tissues expressing P‐glycoprotein through physiologically based pharmacokinetic modeling: model structure and parameters determination. Theoret. Biol. Med. Model.; 6:1-13. [DOI] [PMC free article] [PubMed] [Google Scholar]
- Golozoubova V., Gullberg H., Matthias A., Cannon B., Vennstrom B., Nedergaard J. 2004. Depressed thermogenesis but competent brown adipose tissue recruitment in mice devoid of all hormone‐binding thyroid hormone receptors. Mol. Endocrinol.; 18:384-401. [DOI] [PubMed] [Google Scholar]
- Goudriaan J. R., den Boer M. A., Rensen P. C., Febbraio M., Kuipers F., Romijn J. A. 2005. CD36 deficiency in mice impairs lipoprotein lipase‐mediated triglyceride clearance. J. Lipid Res.; 46:2175-2181. [DOI] [PubMed] [Google Scholar]
- Growdon W. A., Bratton T. S., Houston M. C., Tarpley H. L., Regen D. M. 1971. Brain glucose metabolism in the intact mouse. Am. J. Physiol.; 221:1738-1745. [DOI] [PubMed] [Google Scholar]
- Guo J., Hall K. D. 2011. Predicting changes of body weight, body fat, energy expenditure and metabolic fuel selection in C57BL/6 mice. PLoS ONE; 6:e15961. [DOI] [PMC free article] [PubMed] [Google Scholar]
- Hall K. D. 2006. Computational model of in vivo human energy metabolism during semistarvation and refeeding. Am. J. Physiol. Endocrinol. Metab.; 291:E23-E37. [DOI] [PMC free article] [PubMed] [Google Scholar]
- Hall K. D. 2012. Metabolism of mice and men: mathematical modeling of body weight dynamics. Curr. Opin. Clin. Nutr. Metab. Care; 15:418-423. [DOI] [PubMed] [Google Scholar]
- Kaiyala K. J., Morton G. J., Leroux B. G., Ogimoto K., Wisse B., Schwartz M. W. 2010. Identification of body fat mass as a major determinant of metabolic rate in mice. Diabetes; 59:1657-1666. [DOI] [PMC free article] [PubMed] [Google Scholar]
- Kim J., Saidel G. M., Cabrera M. E. 2007. Multi‐scale computational model of fuel homeostasis during exercise: effect of hormonal control. Ann. Biomed. Eng.; 35:69-90. [DOI] [PubMed] [Google Scholar]
- Kim J., Saidel G. M., Kalhan S. C. 2011. Regulation of adipose tissue metabolism in humans: analysis of responses to the hyperinsulinemic‐euglycemic clamp experiment. Cell. Mol. Bioeng.; 4:281-301. [DOI] [PMC free article] [PubMed] [Google Scholar]
- Konarzewski M., Diamond J. 1995. Evolution of basal metabolic rate and organ masses in laboratory mice. Evolution; 49:1239-1248. [DOI] [PubMed] [Google Scholar]
- Li Y., Dash R. K., Kim J., Saidel G. M., Cabrera M. E. 2009. Role of NADH/NAD+ transport activity and glycogen store on skeletal muscle energy metabolism during exercise: in silico studies. Am. J. Physiol. Cell Physiol.; 296:C25-C46. [DOI] [PMC free article] [PubMed] [Google Scholar]
- Lindstedt S. L., Schaeffer P. J. 2002. Use of allometry in predicting anatomical and physiological parameters of mammals. Lab. Animals; 36:1-19. [DOI] [PubMed] [Google Scholar]
- Martin A. W., Fuhrman F. A. 1955. The relationship between summated tissue respiration and metabolic rate in the mouse and dog. Physiol. Zool.; 28:18-34. [Google Scholar]
- Matsui T., Nagoshi T., Hong E. G., Luptak I., Hartil K., Li L. 2006. Effects of chronic Akt activation on glucose uptake in the heart. Am. J. Physiol. Endocrinol. Metab.; 290:E789-E797. [DOI] [PubMed] [Google Scholar]
- Mulligan H. D., Tisdale M. J. 1991. Metabolic substrate utilization by tumor and host tissues in cancer cachexia. Biochem. J.; 277:321-326. [DOI] [PMC free article] [PubMed] [Google Scholar]
- Pattaranit R., van den Berg H. A. 2008. Mathematical models of energy homeostasis. J. R. Soc. Interface; 5:1119-1135. [DOI] [PMC free article] [PubMed] [Google Scholar]
- Rangarajan A., Weinberg R. A. 2003. Opinion: Comparative biology of mouse versus human cells: modelling human cancer in mice. Nat. Rev. Cancer; 3:952-959. [DOI] [PubMed] [Google Scholar]
- Schiaffino S., Reggiani C. 2011. Fiber types in mammalian skeletal muscles. Physiol. Rev.; 91:1447-1531. [DOI] [PubMed] [Google Scholar]
- Shultz L. D., Ishikawa F., Greiner D. L. 2007. Humanized mice in translational biomedical research. Nat. Rev. Immunol.; 7:118-130. [DOI] [PubMed] [Google Scholar]
- Speakman J. R. 2013. Measuring energy metabolism in the mouse – theoretical, practical, and analytical considerations. Front. Physiol.; 4:34. [DOI] [PMC free article] [PubMed] [Google Scholar]
- Tam J., Fukumura D., Jain R. K. 2009. A mathematical model of murine metabolic regulation by leptin: energy balance and defense of a stable body weight. Cell Metab.; 9:52-63. [DOI] [PMC free article] [PubMed] [Google Scholar]
- Tang N. L., Chung M. L., Elia M., Hui E., Lum C. M., Luk J. K. 2002. Total daily energy expenditure in wasted chronic obstructive pulmonary disease patients. Eur. J. Clin. Nutr.; 56:282-287. [DOI] [PubMed] [Google Scholar]
- Toyoda T., An D., Witczak C. A., Koh H. J., Hirshman M. F., Fujii N. 2011. Myo1c regulates glucose uptake in mouse skeletal muscle. J. Biol. Chem.; 286:4133-4140. [DOI] [PMC free article] [PubMed] [Google Scholar]
- Wang Z., O'Connor T. P., Heshka S., Heymsfield S. B. 2001. The reconstruction of Kleiber's law at the organ‐tissue level. J. Nutr.; 131:2967-2970. [DOI] [PubMed] [Google Scholar]
- Wang Z., Zhang J., Ying Z., Heymsfield S. B. 2012. Organ‐tissue level model of resting energy expenditure across mammals: new insights into Kleiber's Law. ISRN Zool.; 2012:9 [Google Scholar]
- Xu J., Xiao G., Trujillo C., Chang V., Blanco L., Joseph S. B. 2002. Peroxisome proliferator‐activated receptor alpha (PPARalpha) influences substrate utilization for hepatic glucose production. J. Biol. Chem.; 277:50237-50244. [DOI] [PubMed] [Google Scholar]