Abstract
Population-based studies indicate that between 5 and 9 percent of U.S. children exhibit significant deficits in mathematical reasoning, yet little is understood about the brain morphological features related to mathematical performances. In this work, deformation-based morphometry (DBM) analyses have been performed on magnetic resonance images of the brains of 79 third graders to investigate whether there is a correlation between brain morphological features and mathematical proficiency. Group comparison was also performed between Math Difficulties (MD-worst math performers) and Normal Controls (NC), where each subgroup consists of 20 age and gender matched subjects. DBM analysis is based on the analysis of the deformation fields generated by non-rigid registration algorithms, which warp the individual volumes to a common space. To evaluate the effect of registration algorithms on DBM results, five nonrigid registration algorithms have been used: (1) The Adaptive Bases Algorithm (ABA); (2) The Image Registration Toolkit (IRTK); (3) The FSL Nonlinear Image Registration Tool; (4) The Automatic Registration Tool (ART); and (5) the normalization algorithm available in SPM8. The deformation field magnitude (DFM) was used to measure the displacement at each voxel, and the Jacobian determinant (JAC) was used to quantify local volumetric changes. Results show there are no statistically significant volumetric differences between the NC and the MD groups using JAC. However, DBM analysis using DFM found statistically significant anatomical variations between the two groups around the left occipital-temporal cortex, left orbital-frontal cortex, and right insular cortex. Regions of agreement between at least two algorithms based on voxel-wise analysis were used to define Regions of Interest (ROIs) to perform an ROI-based correlation analysis on all 79 volumes. Correlations between average DFM values and standard mathematical scores over these regions were found to be significant. We also found that the choice of registration algorithm has an impact on DBM-based results, so we recommend using more than one algorithm when conducting DBM studies. To the best of our knowledge, this is the first study that uses DBM to investigate brain anatomical features related to mathematical performance in a relatively large population of children.
Keywords: Non-rigid Registration, Deformation Based Morphometry, Mathematical ability, Brain Atlas
1. Introduction
The ability to comprehend and manipulate numbers are fundamental cognitive skills, but population-based studies indicate that between 5 and 9 percent of U.S. children exhibit significant deficits in mathematical reasoning, which are manifested as learning disabilities or difficulties in developing age-appropriate competencies in math. Even as early as first grade, children with math difficulties (MD) demonstrate a specific weakness in the ability to accurately and quickly retrieve mathematical facts to perform simple arithmetic [1, 2], yet little is understood about the origins of such specific difficulties in the absence of more general limitations on learning and intelligence.
Neuroimaging techniques such as functional magnetic resonance imaging (fMRI) have demonstrated that a reproducible set of parietal, prefrontal and occipitotemporal brain regions are systematically activated when subjects are asked to perform simple calculations [3–5]. For example, Dehaene et al. showed that exact calculations usually rely on semantic identification and retrieval of numerical facts from memory, engaging prefrontal regions, while approximation recruits bilateral areas of the parietal lobes involved in visual-spatial processing [4]. Similarly, Simon et al. characterized the functional specialization of calculation-related activations in the intraparietal sulcus [6]. However, although functional neuroimaging has been extensively applied to the study of populations with math difficulties, to date there have been few studies that have used high resolution structural MRI to see whether there are differences in brain morphology between normal and MD children, and none have examined whether specific structural variations in the brain are associated with the level of math skills in children.
In principle, morphological analysis can reveal differences in the underlying cerebral substrates between normal populations and groups with mathematical difficulties, independent of any specific functional assessment. For example, Issacs et al. [7] used voxel-based morphometry (VBM) to demonstrate that impaired calculation ability in children with very low birth weight could be associated with less gray matter in the left parietal lobe in this population than in a normal cohort, while Rotzer et al. [8] showed that developmental dyscalculia was associated with a significantly reduced gray matter volume in the right intraparietal sulcus, anterior cingulum, the left inferior frontal gyrus, and the bilateral middle frontal gyri. Molko et al. [9] also found an abnormal length, depth, and sulcal geometry of the right intraparietal sulcus in girls with dyscalculia associated with Turner’s syndrome. These studies provide strong evidence for structural differences in populations that suffer from comorbid disorders in calculation skills, but it is not known if there are structural variations which correlate with the range of mathematical ability found in a normal population, or whether children with low math skills can be distinguished by anatomical differences from those with normal abilities.
In this work, deformation-based morphometry (DBM) [10, 11] analysis was performed to identify potential morphological features in the brain related to mathematical performances for normal third-grade children. DBM involves the spatial normalization and co-registration of three dimensional image data into a common space and subsequent analysis of the deformation fields produced by the registration process. As such it does not attempt to make measurements of specific structures as in other techniques, but instead quantifies the local morphological differences in structure for all parts of the brain.
Initially we used a single registration approach to measure group differences but could not establish a rigorous criterion for establishing whether these were significant. We therefore broadened our analysis. Five non-rigid registration algorithms have been compared to study their effect on DBM results when there are clear and reported anatomical differences between the normal control subjects and group being tested as is the case with subjects with Williams Syndrome [12]. In this work, we study a group of subjects for which there are no documented gross anatomical differences and we study whether or not DBM can detect subtle differences that may be related to mathematical ability. We process these data with five non-rigid registration algorithms and we determine the extent to which findings are algorithm-dependent. The five non-rigid registration algorithms we have used are: 1) The Adaptive Bases Algorithm (ABA) [13]; 2) The Image Registration Tool Kit (IRTK) [14]; 3) The FSL nonlinear registration tool [15]; 4) The Automatic Registration Tool (ART) [16]; 5) The normalization toolbox in SPM8 [17].
There are three main questions we aimed to investigate: 1) whether there are anatomical differences between two groups of children with very different mathematical abilities; 2) whether there is a correlation between brain morphological features and mathematical proficiency in a group of children; 3) to what degree the registration algorithms used to perform these studies affect the results. We used the deformation field magnitude, which measures the displacement at each voxel, and the Jacobian determinant, which measures local volumetric changes to quantify group differences. To the best of our knowledge, this is the first study that uses DBM to investigate whether or not brain anatomical features correlate with mathematical performance in a relatively large population of third graders.
2. Materials and Methods
2.1 Data Description
Seventy-nine children were recruited for imaging and testing (43 males; 36 females; mean = 8.86 ± 0.38sd years old) following a protocol approved by the Vanderbilt Institutional Review Board (IRB). The calculation and reading subtests from the Wide Range Achievement Test – Third Edition (WRAT-3) [18] were administered to participants during the first semester of their third-grade year. Because children with a specific disability in mathematical calculation show a different pattern of cognitive deficits than children with a disability in both reading and mathematical calculation [19], we selected participants only with high reading ability as measured by their performance on the WRAT-3. The mean standard score value on the math score WRAT-M was 98.49 (SD = 12.93; range: 74 –135) and 112.47 (SD = 11.55; range: 95–141) on the reading score WRAT-R. No significant relationships between standard scores on the WRAT-3 subtests and participants’ age or gender were observed, and there was no significant correlation between reading and math scores. All subjects also had a score of at least 80 on the Wechsler Abbreviated Scales of Intelligence (WASI) [20].
Two subset groups were extracted from the 79 subjects based on their mathematical performances to conduct a group comparison study. Children who performed below the 20th percentile on WRAT-M were placed into the MD group; children with a WRAT-M percentile score above 50 were placed in the normal control (NC) group. There were twenty participants in the MD group (12 males and 8 females; mean age, 10.8±0.4 years) and twenty normal controls individually matched on age and gender (12 males and 8 females; mean age, 10.9±0.4 years).
The anatomical images were acquired with a 3T Philips Achieva MRI scanner with an 8-channel sensitivity encoding (SENSE) head coil. For each subject, a 3D T1-weighted anatomic volume was obtained with a turbo field echo (TFE) sequence (TR = 8.9ms; TE = 4.6ms; FOV = 256mm*256mm*170mm; image resolution = 1mm*1mm*1mm). All scans were acquired at the Vanderbilt University Institute of Imaging Science (VUIIS).
2.2 Creation of group atlases
All the MRI images were corrected for intensity inhomogeneity with the N3 algorithm [21] and rigidly aligned to the MNI template to correct for differences in pose and orientation during acquisition. First, the affine group atlas for the whole 79 MRI images was constructed in an iterative manner [12]. Due to the blurriness of the affine atlas, one volume was then selected and registered to the affine atlas with a nine-parameter affine transformation. Next, this transformed volume served as the reference volume, to which all the other images were registered with affine transformations.
A DBM atlas was built with all the 79 MRI images and served as the template image in the following DBM analysis using the scheme proposed by Guimond et al. [22]. The atlas creation technique used is an iterative process in which (a) one volume is chosen as a initial reference/atlas, (b) all the other volumes are registered to the atlas using a non-rigid registration method, (c) the deformation fields which register the atlas to each of the other volumes are computed and averaged, (d) the average deformation field is applied to the average of deformed volumes to the atlas, thus resulting in a new atlas, and (e) the process is repeated from (b) until convergence. Experience has shown that the process converges after three to four iterations. The results are insensitive to the choice of the original reference. Previous results showed that the choice of non-rigid registration algorithm does not affect the creation of the group atlases at both the cortical and deep brain structure levels [12]. Registration between volumes was thus achieved using the ABA algorithm [13], which is an intensity-based non-rigid registration algorithm developed in house. The registration and averaging steps were conducted on the Vanderbilt University Advanced Computing Center for Research and Education (ACCRE) parallel-computing cluster.
2.3 Group Differences Identified with DBM
To investigate whether there are anatomical differences between two groups of children with different ranges of mathematical abilities, DBM analysis was first carried on the two extreme subset groups: the NC group and the MD group. Twenty affinely transformed images in both the NC and MD groups were registered to the DBM atlas using five non-rigid registration algorithms: ABA, IRTK, FSL, ART, and SPM. Differences between these five registration algorithms are briefly summarized in [12]. In the study presented herein, standard parameter values suggested by the algorithm developers were used. Each algorithm yielded a series of 20 forward deformation fields, one for each subject in each group. Each forward deformation field contains one three-dimensional vector at each voxel, capturing the displacements along the X, Y and Z directions required to match each voxel in the DBM atlas to its corresponding voxel in each individual subject. Two DBM features derived from each deformation field were calculated: the Jacobian determinant (JAC) and the deformation field magnitude (DFM). The JAC measures local volumetric expansion or shrinkage and the DFM measures anatomical shape variations.
Statistical differences in the JAC or DFM values between the NC and the MD groups were assessed using the general linear model regression implemented in SPM8 (Wellcome Department of Cognitive Neurology, London, UK; www.fil.ion.ucl.ac.uk). For each registration algorithm, two-sample t-tests were performed on a voxel-by-voxel basis between the NC subjects and the MD subjects, leading to one T map for each of the two DBM features. Family Wise Error (FWE) correction based on the random field theory [23] was performed to correct for multiple comparisons at both the peak and cluster level inferences. In this study, a loose threshold of uncorrected p of 0.01 and a commonly used threshold of uncorrected p of 0.001 were both applied on the T maps to visualize different ranges of statistical significance. A FWE corrected p value of 0.05 was then used to define statistically significant clusters/voxels at both the peak and cluster levels. Clusters that survived either peak or cluster level FWE corrections were deemed to be regions of difference identified with DBM.
Different registration algorithms may generate different regions of morphological difference between the NC and the MD groups. Therefore, common regions of interests (ROIs) were defined as follows. The output of the DBM analyses was transformed into a binary image, in which a voxel value is one if the voxel is within a statistically significant cluster after FWE correction and zero otherwise. Adding all the binary images produced by the different registration algorithms leads to a membership image, which is then thresholded empirically at two to localize common regions of interests (ROIs). These regions were then used to perform ROI-based analysis.
2.4 Correlation of DBM Findings with Math Scores
DBM was also performed on the entire dataset of 79 MRI images to explore possible correlations between morphometric features and mathematical performances in children (the second question we are addressing in this work). All the 79 affinely transformed images were registered to the DBM atlas using the five non-rigid registration algorithms: ABA, IRTK, FSL, ART and SPM. For each algorithm, JAC and DFM features were calculated at each voxel from the 79 deformation fields. An ANCOVA test was performed to correlate on a voxel basis the value of these features and the WRAT-M scores, adjusting for age and gender. This yielded T maps of statistical differences for each registration algorithm, which capture the correlations between each of the DBM features and the participants’ WRAT-M standard scores. The T maps were then thresholded at uncorrected p of 0.01 and 0.001 to show the level of statistical significance at each voxel.
As shown in Section 3.2, group differences identified with DFM yielded three common ROIs that were used to perform a ROI-based study on the complete set of image (79 volumes). The mean values of the DFM were computed over each ROI and correlated with the WRAT-M scores. Plots of mean feature values vs. WRAT-M scores were produced to show the general trends that were observed. Regression lines were also computed for each region and each registration algorithm.
3. Results
3.1 Smoothness Estimation of DBM Features
We first estimated the smoothness of the JAC and DFM fields expressed as their full width at half maximum (FWHM) in all directions computed with SPM8. The results are shown in Fig. 1. SPM produced the smoothest fields for both JAC and DFM, followed by IRTK, FSL, ABA and ART. Because the smoothness of the deformation affects the statistical analysis of DBM results, it is possible that differences in field smoothness have an impact on the size, shape, and location of regions for which statistically significant differences in DBM feature values are observed.
Fig. 1.
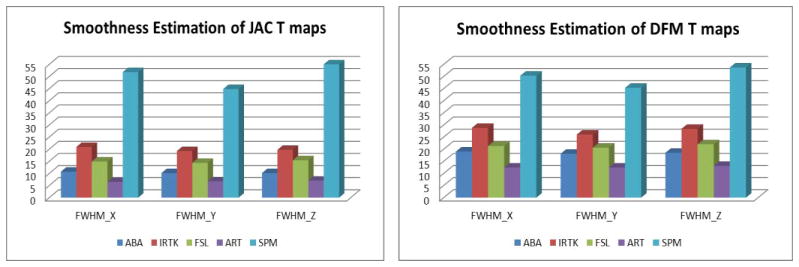
Smoothness estimation (FWHM in X, Y and Z directions) for JAC (left) and DFM (right) T maps for different registration algorithms (from left to right): ABA, IRTK, FSL, ART, and SPM.
3.2 Group Differences Detected with the JAC Feature
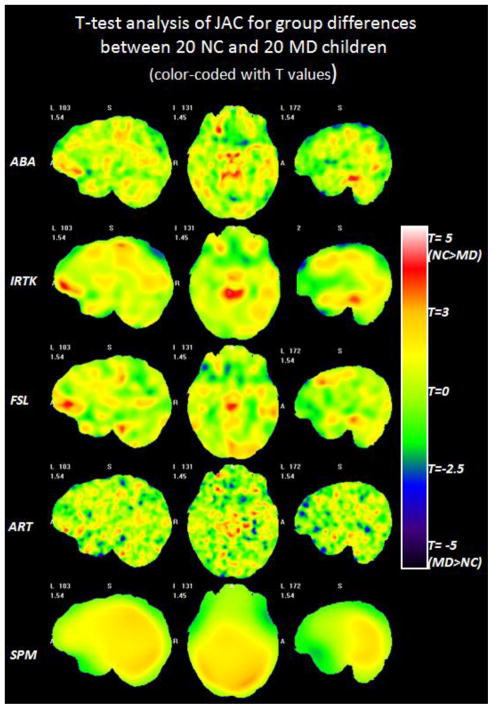
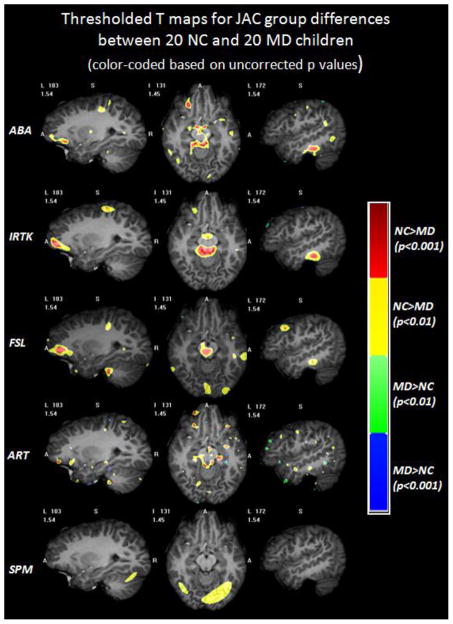
Fig. 2 shows the color-coded T maps of the voxel-wise T-test analysis performed on the JAC feature obtained with five non-rigid registration algorithms. Each row displays selected slices in the T maps obtained with one algorithm. From top to bottom the rows show the results obtained with ABA, IRTK, FSL, ART and SPM. Warm colors mean that a larger JAC value is observed in the NC children than in the children in the MD group. Cold colors mean the opposite. Qualitative comparisons across different registration algorithms show that ABA, IRTK and FSL produce somewhat similar patterns, ART produces a more scattered T map, and SPM yields a smoother map than all the other algorithms. To localize the regions that show a statistical difference in the JAC value, a loose threshold with uncorrected p of 0.01 (T = ±2.43, df = 38) and a widely used threshold with uncorrected p of 0.001 (T = ±3.32, df = 38) are applied on the raw T maps. Fig. 3 shows the regions with different ranges of p values for each registration algorithm. For voxels with positive T values (NC>MD), yellow and red colors are used to label voxels with uncorrected 0.001<p<0.01 and p<0.001 respectively. For voxels with negative T values (NC<MD), green and blue colors are used to indicate the uncorrected 0.001<p<0.01 and p<0.001 respectively. The thresholded maps are superimposed on one volume nonlinearly deformed to the DBM atlas to show the corresponding structures. ABA, IRTK and FSL find consistent red regions around the right inferior frontal gyrus, midbrain area and right inferior temporal gyrus. However, none of these clusters survived the FWE correction (corrected p of 0.05) at either peak or cluster level. Results show that there are no statistically significant volumetric differences between the children with normal and low mathematical abilities. This is so despite the consistency of the results observed across algorithms.
Fig. 2.
The color-coded T maps of the voxel-wise T-test analysis on the JAC features between the NC and the MD group based on five non-rigid registration algorithms. Each row displays selected slices in the T maps obtained based on one algorithm, from top to bottom: ABA, IRTK, FSL, ART and SPM.
Fig. 3.
The regions with different ranges of p values for DBM results of JAC based on each registration algorithm superimposed on one volume deformed to the DBM atlas. Warm colors show that the NC population has larger JAC values than the MD population, and cold colors mean the opposite. None of these clusters survived FWE multiple comparison correction.
3.3 Group Differences Detected with the DFM Feature
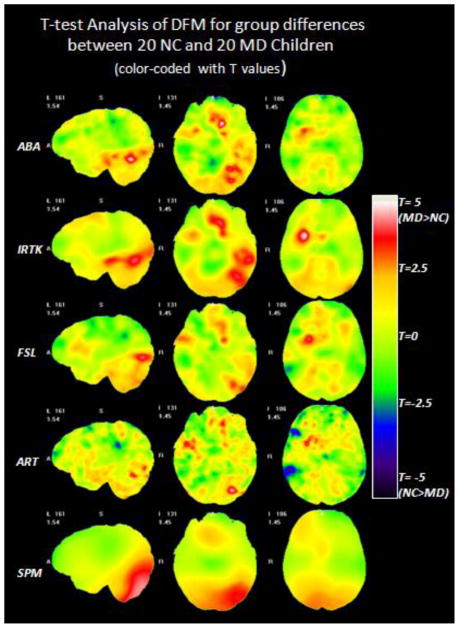
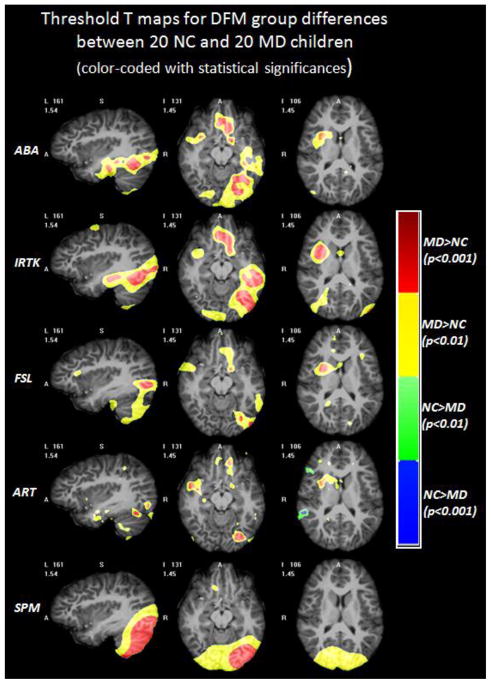
Fig. 4 shows the color-coded T maps of the voxel-wise T-test analysis performed on the DFM feature between the NC and the MD group obtained with five non-rigid registration algorithms. Warm colors mean that MD subjects have larger anatomical variations than the NC subjects. Cold colors mean the opposite. Qualitative comparison shows that ABA, IRTK and FSL show similar patterns, while ART and SPM produce the least smooth and the smoothest T maps, respectively. Thresholding the T maps with uncorrected p values of 0.01 and 0.001 leads to Fig. 5, showing the color-coded regions with different ranges of statistical significance in a similar fashion as in Fig. 3. The results shown in Fig. 4 and Fig. 5 indicate that the MD children have more anatomical variations than the NC children around the left temporal and occipital lobe, the orbital-frontal area and the right insular cortex. Such differences are consistently found across different registration algorithms although patterns vary somewhat. After FWE correction for multiple comparisons, all the clusters that survived for the different registration algorithms were combined to find the common regions of interests. If at least two registration algorithms found overlapping regions (membership threshold of 2), these were considered to be a common ROI in which anatomical variation differences between the NC and the MD group may exist.
Fig. 4.
The color-coded T maps of the voxel-wise T-test analysis on the DFM features between the NC and the MD group based on five non-rigid registration algorithms. Each row displays the selected slices in the T maps obtained based on one algorithm, from top to bottom: ABA, IRTK, FSL, ART and SPM.
Fig. 5.
The regions with different ranges of p values for DBM results of DFM based on each registration algorithm superimposed on one volume deformed to the DBM atlas. Warm colors mean that the MD population has larger DFM values than the NC population, and cold colors mean the opposite.
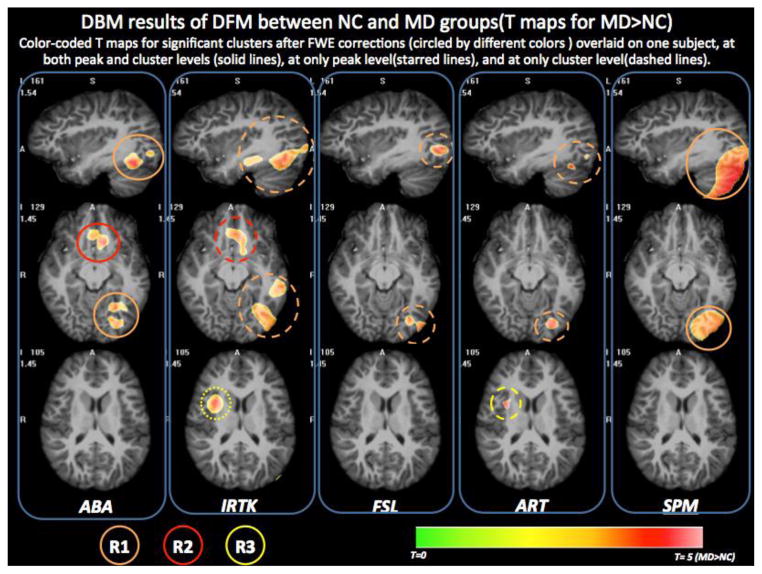
Fig. 6 displays the statistically significant clusters after the FWE corrections for each of the five non-rigid registration methods, superimposed on one volume nonlinearly deformed to the DBM atlas. In this figure, pixels with uncorrected p values smaller than 0.001 (red clusters in Fig. 5) that are part of a statistically significant cluster at either cluster/peak or both levels are shown in color based on their T values. Each column shows the DBM results for one algorithm on the same selected views as in Fig. 5. Warm colors mean that larger DFM values were observed in the MD subjects than in the NC subjects. Cold colors mean the opposite. The line type used for the circles reflects the statistical significance after FWE corrections for the clusters within the ROI. If a cluster in a region is significant at both peak and cluster levels, a solid circle is drawn around the region. Starred lines or dashed lines are drawn around a cluster which is statistically significant at either peak level or cluster level. Three regions of interests (ROIs) are circled with different colors: R1-Orange; R2-Red, and R3-Yellow. All five non-rigid registration algorithms found R1 located around the left occipitotemporal sulcus, the left fusiform gyrus around Brodman Area (BA) 37 and the cerebellum. ABA and IRTK also found R2 around the left olfactory sulcus and the gyrus rectus (BA 47). IRTK and ART found R3 in the right insular cortex. Tab. 1 lists all the clusters found in each ROI by different registration algorithms and their maximum T values, the FWE corrected p values at peak and cluster levels, and the cluster sizes. The blue/green background color means that this region is statistically significant after FWE correction with corrected p threshold at 0.05/0.5 (a looser criterion) either at peak-level or cluster-level for that algorithm.
Fig. 6.
Three common ROIs in the DBM results of DFM difference between NC and MD groups. All clusters are statistical significant after FWE correction and superimposed on one volume deformed to the DBM atlas. Three ROIs were identified and circled with different colors. The line type indicates different statistical significance levels.
Tab. 1.
Summaries of DBM results based on DFM over three common ROIs based on different registration algorithms.
| Regions Names | Methods | T_max | P_peak | P_cluster | Size(mm3) |
|---|---|---|---|---|---|
| R1: Left occipitotemporal cortex, left fusiform gyrus (BA37), and cerebellum. | ABA | 5.46 | 0.02 | 0.008 | 6878 |
| IRTK | 4.39 | 0.097 | 0.007 | 17643 | |
| FSL | 4.86 | 0.062 | 0.019 | 7355 | |
| ART | 4.85 | 0.248 | 0.038 | 1896 | |
| SPM | 4.56 | 0.015 | 0.006 | 67909 | |
| R2: Left orbital gyrus, olfactory sulcus, gyrus rectus. (BA47) | ABA | 5.39 | 0.024 | 0.015 | 5749 |
| IRTK | 4.40 | 0.096 | 0.041 | 9270 | |
| FSL | 4.22 | 0.270 | 0.461 | 1031 | |
| ART | 5.05 | 0.160 | 0.177 | 1125 | |
| R3: Right insular cortex | ABA | 4.47 | 0.222 | 0.328 | 1419 |
| IRTK | 5.17 | 0.014 | 0.055 | 8037 | |
| FSL | 4.41 | 0.180 | 0.271 | 1939 | |
| ART | 4.95 | 0.201 | 0.048 | 1772 |
T_max: The maximum T value over this region; P_peak: Corrected p value at peak level; P_cluster: Corrected p value at cluster level. The blue/green background color means that this region is statistically significant after FWE correction with corrected p threshold at 0.05/0.5 either at peak-level or cluster-level for that algorithm.
R2 and R3 each were found to be statistically significant by only two algorithms (different pairs for each region). Fig. 5 also shows that the other algorithms found regions of difference in the same general area. For example, FSL, ART and SPM all found yellow or red clusters around R2 that meet the loose uncorrected p threshold (p<0.01). Also, ABA and FSL both have a relatively large red cluster (uncorrected p<0.001) around the right insular cortex (R3). However these were not found to be significant after FWE correction. There is also a unique cluster around the left superior frontal gyrus found only by IRTK that is statistically significant at peak-level after FWE correction (corrected p of 0.025 < 0.05). Because this cluster is only found by one algorithm, it is not kept as a common ROI used to perform ROI-based analysis. It is thus not shown in Fig. 6.
3.4 Correlation Between the DFM Feature and the WRAT-M Score
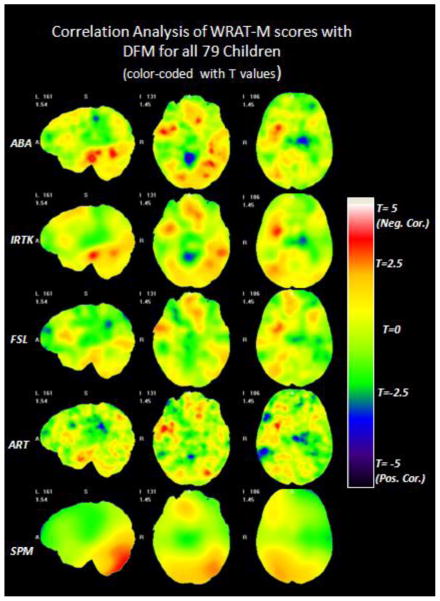
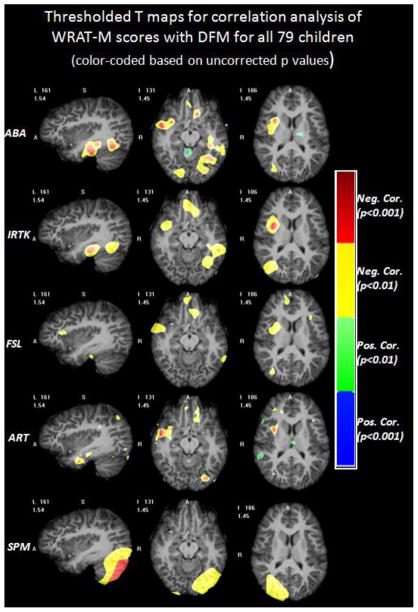
Correlation analysis between the children’s WRAT-M scores and the anatomical features for the entire dataset of 79 children was conducted throughout the entire brain with the DBM technique. The results were calculated for the five non-rigid registration algorithms introduced previously. Only the DFM feature has been considered in the correlation study, because no group volumetric differences were found between the NC and the MD group. Fig. 7 shows the color-coded T maps for the voxel-wise correlation coefficient between WRAT-M scores and the DFM feature for all 79 children. This map was produced with an ANCOVA model, adjusted for age and gender. Each row displays the three selected views of the T maps obtained with one algorithm. From top to bottom, the rows show the results obtained with ABA, IRTK, FSL, ART, and SPM. Warm colors mean negative correlation between the WART-M score and the DFM value, while cold colors mean positive correlation. As was done in Fig. 3 and Fig. 5, a loose threshold at uncorrected p of 0.01 (T = ±2.38, df = 74) and a regular threshold at uncorrected p of 0.001 (T = ±3.20, df = 74) are used to threshold the T maps. Images thresholded with these values are coded with different colors, as shown in Fig. 8. As can be observed, the yellow and red clusters in Fig. 8 appear to be in a position that is similar to the position of the yellow and red clusters shown in Fig. 5, but with smaller cluster sizes and lower significances of uncorrected p values. None of the clusters are statistical significant after the FWE correction.
Fig. 7.
The color-coded T maps of the voxel-wise ANCOVA analysis between the DFM feature and WRAT-M scores for all the 79 children based on five non-rigid registration algorithms. Each row displays three selected views of the T maps obtained based on one algorithm, from top to bottom: ABA, IRTK, FSL, ART and SPM.
Fig. 8.
The regions with different ranges of p values for DBM results of DFM correlated with WRAT-M scores based on each registration algorithm superimposed on one volume deformed to the DBM atlas. Warm colors mean that the MD population has larger DFM values than the NC population, and cold colors mean the opposite.
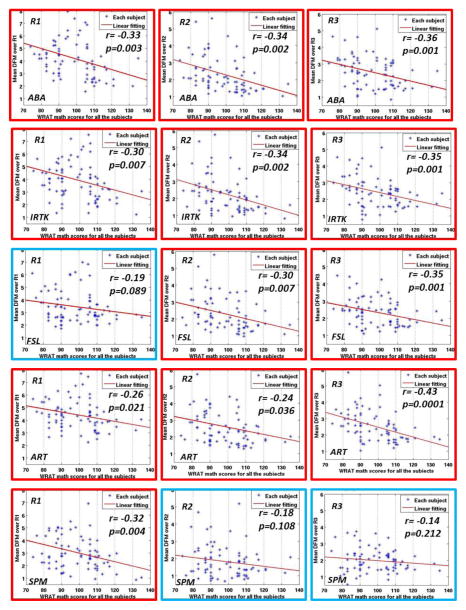
Fig. 9 presents the plots showing the relation between the mean DFM over each ROI (Y axis) and the math scores for each registration algorithm (X axis). Each subpanel shows the computed regression line. The legends on each subpanel include the ROI (R1, R2 or R3) to which the plot relates (top left), the registration algorithm that has been used (bottom left), the correlation coefficient r between the mean DFM and the WRAT-M scores (right side), and the p value. If the correlation is statistically significant (p<0.05), the sub-panel is marked with a red border; otherwise (p>0.05) it is drawn in blue. Because this analysis is based on one single value/region, i.e., the mean value of the feature over the region, there is no need for multiple comparison correction.
Fig. 9.
Scattered plots for correlation analysis between the mean DFM over each ROI and the WRAT-M scores for all the 79 children, using five different registration algorithms. Red frames mean that the correlation coefficients are statistically significant (p<0.05), blue frames mean the opposite.
As can be observed, ABA, IRTK and ART show statistically significant correlations between the mean of the DFM over each ROI and the WRAT-M scores. This agrees well with the color-coded clusters around R1, R2 and R3 for these algorithms in Fig. 5 and Fig. 8. This means that the lower the child’s math score, the larger the DFM mean values tend to be over each ROI, i.e. the more the voxels in this ROI have to be displaced to match the atlas image with the subject’s image. FSL yielded statistically significant correlations over R2 and R3, but not over R1. Fig. 8 also shows that FSL found the correlation T maps over R2 and R3 to meet the loose uncorrected threshold of 0.01, but not over R1. SPM finds statistically significant correlations only between mean DFM and WRAT-M scores over R1, as can be seen from Fig. 8. These results suggest that there may be a correlation between brain anatomy and math performance over these regions even though these differences are not strong enough to produce significant findings in voxel-wise analyses when FWE correction for multiple comparisons are used.
4. DISCUSSION
Deformation-based morphometry analyses have been used to investigate brain anatomical features for third-grade children with different mathematical abilities. Five non-rigid registration algorithms (ABA, IRTK, FSL, ART and SPM) have been used to detect morphological differences between age and gender matched children in NC and MD groups and to study the effect registration algorithms have on DBM results. Agreement among at least two algorithms has also been used to define ROIs that were used to correlate anatomical features and mathematical ability over the entire set of 79 images. We did not find statistically significant volumetric differences measured with the JAC between the NC and the MD groups. This leads to the conclusion that either no differences exist or such differences are too subtle to be detected. However, DBM analysis performed on the DFM features showed significant anatomical variations between the two groups around three regions identified consistently by at least two registration algorithms after FWE correction (p of 0.05). The three regions are the left occipital-temporal cortex, left orbital-frontal cortex, and right insular cortex. DBM analysis on the entire 79 children did not find statistically significant correlation between the DFM and math scores after FWE correction. But ROI-based correlations of mean DFM values and WRAT-M scores are statistically significant. Parameter values that need to be specified for each registration algorithm may also have an effect on the results. This has not been investigated in this study for which values suggested by the algorithm developers were used.
The findings reported in this study reinforce some of the conclusions we drew in our previous work [12] i.e., that registration algorithms indeed have an impact on DBM-based results. We would thus recommend using more than one algorithm when conducting DBM studies. Consensus among algorithms despite weak statistical significance obtained with each of them may be an indication that the criteria for inclusion are too strict and that findings are real.
Our findings also expand on previous functional studies of developmental changes in occipital-temporal cortex with age [24] by demonstrating that a relationship between calculation skill and morphological variability in these cortices may exist as early as third grade. The DFM in the left occipitotemporal cortex and the left fusiform gyrus are found to be statistically different between the NC and the MD group, as well as negatively correlated with mathematical skills. Functional specialization of the left occipitotemporal cortex has been demonstrated for various classes of visual stimuli [25,26]. Diminished processing of written numerical symbols could explain findings of significantly slower response times during calculation tasks in individuals with MD compared to their same age peers [1, 2]. The left fusiform gyrus is also an area critical to word/number recognition so differences in architecture in this region could be linked to differences in math performance.
In addition, two volumes located in the orbitofrontal cortex and the right insular cortex showed similar behavior. These brain regions are associated with attention, decision-making, and executive function. Functional imaging has implicated that insular is an important area involving emotional processing [27], speech-motor function [28]. In particular the right anterior insula has been identified as a key region of interest in specific phobias [29, 30]. A disruption in any one of these cognitive processes could conceivably cause a break down in the normal course of procedures and interrupt the processes of solving calculation problems. In view of the evidence that young children compared to adults have increased activation in prefrontal cortex while performing a simple calculation task [24], the increased morphological variability in poor calculation performers may be a contributing factor to their use of less mature strategies during problem solving and retrieval errors [1, 2]. A significant difference between the findings in the current study and previous studies [31–33] is that we did not find morphological differences in the parietal cortex related to mathematical skill. The differences may be due to the behavioral task that we used the method of analysis, or participant characteristics such as age and severity of mathematical disability. Although the findings from this study appear to be in accordance with neuropsychological models and previous results, more rigorous validation, particularly correlating with other neuroimaging modalities such as functional MRI, are still warranted to confirm them. In particular, more specific descriptions of the variations in deformation fields in terms of underlying sulcal architecture, gyral patterns or tissue volumes should be established.
Acknowledgments
This study was supported by the U.S. Department of Commerce grant BS123456, NICHD grants R0135681-06 and P30HD 15052-24.
Footnotes
Publisher's Disclaimer: This is a PDF file of an unedited manuscript that has been accepted for publication. As a service to our customers we are providing this early version of the manuscript. The manuscript will undergo copyediting, typesetting, and review of the resulting proof before it is published in its final citable form. Please note that during the production process errors may be discovered which could affect the content, and all legal disclaimers that apply to the journal pertain.
References
- 1.Geary DC. A componential analysis of an early learning deficit in mathematics. J Exp Child Psychol. 1990 Jun;49:363–83. doi: 10.1016/0022-0965(90)90065-g. [DOI] [PubMed] [Google Scholar]
- 2.Jordan NC, Montani TO. Cognitive arithmetic and problem solving: a comparison of children with specific and general mathematics difficulties. J Learn Disabil. 1997 Nov-Dec;30:624–34. 684. doi: 10.1177/002221949703000606. [DOI] [PubMed] [Google Scholar]
- 3.Dehaene S, Molko N, Cohen L, Wilson AJ. Arithmetic and the brain. Curr Opin Neurobiol. 2004 Apr;14:218–24. doi: 10.1016/j.conb.2004.03.008. [DOI] [PubMed] [Google Scholar]
- 4.Dehaene S, Spelke E, Pinel P, Stanescu R, Tsivkin S. Sources of mathematical thinking: behavioral and brain-imaging evidence. Science. 1999 May 7;284:970–4. doi: 10.1126/science.284.5416.970. [DOI] [PubMed] [Google Scholar]
- 5.Kucian K, Loenneker T, Dietrich T, Dosch M, Martin E, von Aster M. Impaired neural networks for approximate calculation in dyscalculic children: a functional MRI study. Behav Brain Funct. 2006;2:31. doi: 10.1186/1744-9081-2-31. [DOI] [PMC free article] [PubMed] [Google Scholar]
- 6.Simon O, Mangin JF, Cohen L, Le Bihan D, Dehaene S. Topographical layout of hand, eye, calculation, and language-related areas in the human parietal lobe. Neuron. 2002 Jan 31;33:475–87. doi: 10.1016/s0896-6273(02)00575-5. [DOI] [PubMed] [Google Scholar]
- 7.Isaacs EB, Edmonds CJ, Lucas A, Gadian DG. Calculation difficulties in children of very low birthweight: a neural correlate. Brain. 2001 Sep;124:1701–7. doi: 10.1093/brain/124.9.1701. [DOI] [PubMed] [Google Scholar]
- 8.Rotzer S, Kucian K, Martin E, von Aster M, Klaver P, Loenneker T. Optimized voxel-based morphometry in children with developmental dyscalculia. Neuroimage. 2008 Jan 1;39:417–22. doi: 10.1016/j.neuroimage.2007.08.045. [DOI] [PubMed] [Google Scholar]
- 9.Molko N, Cachia A, Riviere D, Mangin JF, Bruandet M, Le Bihan D, Cohen L, Dehaene S. Functional and structural alterations of the intraparietal sulcus in a developmental dyscalculia of genetic origin. Neuron. 2003 Nov 13;40:847–58. doi: 10.1016/s0896-6273(03)00670-6. [DOI] [PubMed] [Google Scholar]
- 10.Ashburner J, Hutton C, Frackowiak R, Johnsrude I, Price C, Friston K. Identifying global anatomical differences: deformation-based morphometry. Hum Brain Mapp. 1998;6:348–57. doi: 10.1002/(SICI)1097-0193(1998)6:5/6<348::AID-HBM4>3.0.CO;2-P. [DOI] [PMC free article] [PubMed] [Google Scholar]
- 11.Gaser C, Volz HP, Kiebel S, Riehemann S, Sauer H. Detecting structural changes in whole brain based on nonlinear deformations-application to schizophrenia research. Neuroimage. 1999 Aug;10:107–13. doi: 10.1006/nimg.1999.0458. [DOI] [PubMed] [Google Scholar]
- 12.Han Z, Thornton-Wells TA, Dykens EM, Gore JC, Dawant BM. Effect of nonrigid registration algorithms on deformation-based morphometry: a comparative study with control and Williams syndrome subjects. Magnetic Resonance Imaging. 2012 Jul;30:774–788. doi: 10.1016/j.mri.2012.02.005. [DOI] [PMC free article] [PubMed] [Google Scholar]
- 13.Rohde GK, Aldroubi A, Dawant BM. The adaptive bases algorithm for intensity-based nonrigid image registration. IEEE Trans Med Imaging. 2003 Nov;22:1470–9. doi: 10.1109/TMI.2003.819299. [DOI] [PubMed] [Google Scholar]
- 14.Rueckert D, Sonoda LI, Hayes C, Hill DL, Leach MO, Hawkes DJ. Nonrigid registration using free-form deformations: application to breast MR images. IEEE Trans Med Imaging. 1999 Aug;18:712–21. doi: 10.1109/42.796284. [DOI] [PubMed] [Google Scholar]
- 15.Anderson J, Smith S, Jenkinson M. FNIRT - FMRIB’ non-linear image registration tool. Human Brain Mapping. 2008 vol. Poster #496. [Google Scholar]
- 16.Ardekani BA, Guckemus S, Bachman A, Hoptman MJ, Wojtaszek M, Nierenberg J. Quantitative comparison of algorithms for inter-subject registration of 3D volumetric brain MRI scans. J Neurosci Methods. 2005 Mar 15;142:67–76. doi: 10.1016/j.jneumeth.2004.07.014. [DOI] [PubMed] [Google Scholar]
- 17.Ashburner J, Friston KJ. Nonlinear spatial normalization using basis functions. Hum Brain Mapp. 1999;7:254–66. doi: 10.1002/(SICI)1097-0193(1999)7:4<254::AID-HBM4>3.0.CO;2-G. [DOI] [PMC free article] [PubMed] [Google Scholar]
- 18.Wilkinson GS. Wide Range Achievement Test. 3. Wide Range Inc; Wilmington, DE: 1993. [Google Scholar]
- 19.Geary DC, Hamson CO, Hoard MK. Numerical and arithmetical cognition: a longitudinal study of process and concept deficits in children with learning disability. J Exp Child Psychol. 2000 Nov;77:236–63. doi: 10.1006/jecp.2000.2561. [DOI] [PubMed] [Google Scholar]
- 20.Wechsler D. Wechsler Abbreviated Scale of Intelligence. Harcourt Assessment; San Antonio, TX: 1999. [Google Scholar]
- 21.Sled JG, Zijdenbos AP, Evans AC. A nonparametric method for automatic correction of intensity nonuniformity in MRI data. IEEE Trans Med Imaging. 1998 Feb;17:87–97. doi: 10.1109/42.668698. [DOI] [PubMed] [Google Scholar]
- 22.Guimond A, Meunier J, Thirion JP. Average brain models: a convergence study. Comput Vis Image Underst. 2000;77:192–210. [Google Scholar]
- 23.Worsley KJ, Taylor JE, Tomaiuolo F, Lerch J. Unified univariate and multivariate random field theory. Neuroimage. 2004;23(Suppl 1):S189–95. doi: 10.1016/j.neuroimage.2004.07.026. [DOI] [PubMed] [Google Scholar]
- 24.Rivera SM, Reiss AL, Eckert MA, Menon V. Developmental changes in mental arithmetic: evidence for increased functional specialization in the left inferior parietal cortex. Cereb Cortex. 2005 Nov;15:1779–90. doi: 10.1093/cercor/bhi055. [DOI] [PubMed] [Google Scholar]
- 25.Cohen L, Dehaene S. Specialization within the ventral stream: the case for the visual word form area. Neuroimage. 2004 May;22:466–76. doi: 10.1016/j.neuroimage.2003.12.049. [DOI] [PubMed] [Google Scholar]
- 26.Hart J, Jr, Kraut MA, Kremen S, Soher B, Gordon B. Neural substrates of orthographic lexical access as demonstrated by functional brain imaging. Neuropsychiatry Neuropsychol Behav Neurol. 2000 Jan;13:1–7. [PubMed] [Google Scholar]
- 27.Damasio AR, Grabowski TJ, Bechara A, Damasio H, Ponto LL, Parvizi J, Hichwa RD. Subcortical and cortical brain activity during the feeling of self-generated emotions. Nat Neurosci. 2000 Oct;3:1049–56. doi: 10.1038/79871. [DOI] [PubMed] [Google Scholar]
- 28.Fox PT, Huang A, Parsons LM, Xiong JH, Zamarippa F, Rainey L, Lancaster JL. Location-probability profiles for the mouth region of human primary motor-sensory cortex: model and validation. Neuroimage. 2001 Jan;13:196–209. doi: 10.1006/nimg.2000.0659. [DOI] [PubMed] [Google Scholar]
- 29.Wright CI, Martis B, McMullin K, Shin LM, Rauch SL. Amygdala and insular responses to emotionally valenced human faces in small animal specific phobia. Biol Psychiatry. 2003 Nov 15;54:1067–76. doi: 10.1016/s0006-3223(03)00548-1. [DOI] [PubMed] [Google Scholar]
- 30.Paulus MP, Stein MB. An insular view of anxiety. Biol Psychiatry. 2006 Aug 15;60:383–7. doi: 10.1016/j.biopsych.2006.03.042. [DOI] [PubMed] [Google Scholar]
- 31.Isaacs EB, Edmonds CJ, Lucas A, Gadian DG. Calculation difficulties in children of very low birthweight: a neural correlate. Brain. 2001 Sep;124:1701–7. doi: 10.1093/brain/124.9.1701. [DOI] [PubMed] [Google Scholar]
- 32.Rotzer S, Kucian K, Martin E, von Aster M, Klaver P, Loenneker T. Optimized voxel-based morphometry in children with developmental dyscalculia. Neuroimage. 2008 Jan 1;39:417–22. doi: 10.1016/j.neuroimage.2007.08.045. [DOI] [PubMed] [Google Scholar]
- 33.Molko N, Cachia A, Riviere D, Mangin JF, Bruandet M, Le Bihan D, Cohen L, Dehaene S. Functional and structural alterations of the intraparietal sulcus in a developmental dyscalculia of genetic origin. Neuron. 2003 Nov 13;40:847–58. doi: 10.1016/s0896-6273(03)00670-6. [DOI] [PubMed] [Google Scholar]


