

Abstract
There is strong evidence of an association between fine particulate matter less than 2.5 μm (PM2.5) in aerodynamic diameter and adverse health outcomes. This study analyzes the global excess mortality attributable to the aviation sector in the present (2006) and in the future (three 2050 scenarios) using the integrated exposure response model that was also used in the 2010 Global Burden of Disease assessment. The PM2.5 concentrations for the present and future scenarios were calculated using aviation emission inventories developed by the Volpe National Transportation Systems Center and a global chemistry-climate model. We found that while excess mortality due to the aviation sector emissions is greater in 2050 compared to 2006, improved fuel policies (technology and operations improvements yielding smaller increases in fuel burn compared to 2006, and conversion to fully sustainable fuels) in 2050 could lead to 72% fewer deaths for adults 25 years and older than a 2050 scenario with no fuel improvements. Among the four health outcomes examined, ischemic heart disease was the greatest cause of death. Our results suggest that implementation of improved fuel policies can have substantial human health benefits.
Introduction
There is a strong link between air pollution and adverse climate and health effects globally. Among the various air pollutants, fine particulate matter (PM) less than 2.5 μm (PM2.5) in aerodynamic diameter has been shown to have the largest health burden.1−4 PM2.5 is a complex mixture of several primary and secondary particle species. Primary species include organic carbon, black carbon, and trace elements; secondary species include sulfates, nitrates, and secondary organics that are derived from reactions of the primary species in the atmosphere. Each species contributes uniquely to climate change. Organic carbon, sulfate, and nitrate have atmospheric cooling effects whereas black carbon has warming effects.
According to van Donkelaar et al., the global population-weighted average of PM2.5 between 2001 and 2006 was 20 μg/m3.5 However, in countries such as China5−7 and India,8 annual PM2.5 levels in some regions can range from 55 to 100 μg/m3 and 90–105 μg/m3, respectively, but can far exceed these values during the winter. High PM2.5 levels in these countries are of particular concern because of their high population density. Adverse health impacts due to PM2.5 exposure can lead to both acute and chronic effects; however, the greatest burden is from chronic cardiovascular and respiratory diseases, including lung cancer.1,2,9 The recent 2010 Global Burden of Disease study estimated that there are over 3.2 million deaths annually due to outdoor air pollution exposure.10
Several recent studies have assessed mortality impacts of PM2.5 from specific emission sectors and regions. In the U.S., 130 000 deaths were attributed to all-source PM2.5 exposure in 2005.11 PM2.5 emissions from shipping have been associated with roughly 60 000 annual cardiopulmonary and lung cancer deaths worldwide, with the majority of the burden occurring along the coasts of Europe, East Asia, and South Asia.12 In the year 2000, PM from fossil fuel, coal, and biofuel combustions from households and industrial power plants were estimated to be responsible for about 470 000 premature deaths in China, and an additional 30 000 annual deaths globally due transport of PM to other countries.13 Future projections of global PM2.5 emissions from vehicles suggest that about 190 000 global deaths could be avoided in 2030 with more stringent vehicle emissions.14 In China in 2030, tight emissions control could reduce premature deaths to 240 000; however, high emissions could lead to 720 000 premature deaths.13 Traditionally, the health impacts of the aviation sector have focused on the landing and takeoff (LTO) emissions in the local vicinity of airports.15 However, new research suggests that the cruise altitude emissions have larger global impacts on human health.16−19 Barrett et al. showed that PM2.5 (mostly sulfate and nitrate) from cruise altitude emissions results in 8000 premature mortalities every year, representing 80% of the total impact of aviation (from LTO and cruise emissions), and 1% of PM2.5-related premature mortalities from all sources.16 In contrast, Jacobson et al. found that excess mortality due to the global aviation sector is about 310 (−400 to 4300) deaths per year, due to PM2.5.18
In this study, we assess global mortality due to the aviation sector because it is a rapidly growing sector with recent increases in air travel and it relies on fossil fuels.20,21 We employ the exposure-response methods used in the recently published 2010 GBD assessment to quantify the global mortality impacts on adults 25 years and older of PM2.5 resulting from concentrations in 2006 as well as alternative scenarios of emission controls for the aviation sector through 2050. In a further set of sensitivity analyses, we (1) recompute global mortality for adults over 25 using the former 2004 GBD model to compare mortality estimates between the two models, (2) examine the impact of using different population data sets on mortality estimates, and (3) compute global mortality impacts for all ages using both 2004 and 2010 GBD models to assess whether the results would be similar to those for adults 25 years and older.
Methods
Surface PM2.5 from the Aviation Sector
The new generation 3-dimensional NASA Goddard Institute for Space Studies (GISS) ModelE2 global coupled oxidant-aerosol-climate model22 has been applied to isolate the impacts of aviation emissions on the atmospheric chemical composition in the present day 2006 and future 2050s under three scenarios for future aviation emissions that have been developed by the Volpe National Transportation Systems Center using the FAA Aviation Environmental Design Tool.23 The global chemistry-climate model’s horizontal resolution is 2° latitude by 2.5° longitude with 40 vertical hybrid sigma pressure layers from the surface to 0.1 hPa. The tropospheric and stratospheric gas-phase chemistry and aerosol modules are fully integrated so that these components interact with each other and with the physics of the climate model. The aerosol and chemistry model schemes and their coupling have been well documented and extensively validated against observations.24
The three FAA Volpe high-resolution future 2050 projections of aviation emissions are based on a broad range of industry plausible scenarios: (1) a reference (ref) scenario describes unconstrained growth with a factor of 4.8 increase in fuel burn over year 2006, (2) a technological and operational improvements (Tech & Op) scenario is based on the International Civil Aviation Organization’s aspirational fuel efficiency goal of 2% per annum to 2050 with a factor of 2.7 increase in fuel burn over year 2006 and includes additional NOx emission improvements, and (3) an alternative fuels (Alt Fuel) scenario focused on air quality improvements that builds on Tech & Op with the additional assumption of the complete penetration of fully formulated sustainable alternative fuels such that fuel composition in 2050 is sulfur-free with a maximum aromatic content of 8%. The global gridded Volpe aviation emissions of NOx, CO, SO2, black carbon, organic carbon, and nonmethane volatile organic carbon (NMVOCs) were implemented at hourly resolution into the NASA GISS ModelE2 framework (Supporting Information, SI, Table S1). We selected the midrange IPCC Fifth Assessment Report (AR5) RCP4.5 as the background scenario (physical climate state and nonaviation anthropogenic emissions) for all of the Volpe aviation scenarios. RCP4.5 is a CO2 stabilization pathway without overshoot to 4.5Wm-2 (∼650 ppm of CO2 eq) after 2100. All RCPs assume aggressive air pollution abatement measures and correspondingly large decreases in aerosol and O3 precursors globally25 (SI Table S2). Time-slice simulations were performed for the present day and future worlds by prescribing 5-year average monthly varying sea surface temperatures and sea ice boundary conditions extracted from previously completed, fully coupled, transient simulations of the RCP4.5 scenario using the exact same climate model.22 In this way, the simulations include the effects of feedbacks from future physical climate change on the atmospheric chemical composition and surface air quality. Further details of the emissions and background conditions have been described elsewhere.20
Integrations of 12 model years were completed; the first 2 years of the simulations are discarded as spin-up and the remaining 10 years are averaged for analyses. The aviation emission perturbation on chemical composition is isolated by analyzing the differences between simulations with and without the aviation emissions. PM2.5 surface concentration is obtained from the linear summation of several aerosols in the lowest model layer, including sulfate, nitrate, ammonium, primary and secondary organic carbon, and black carbon for the aviation impact, and additionally including the fine mode fraction of dust and sea salt in the total amount.
Health Impacts Calculation
We calculated PM2.5-related mortality due to aviation sector emissions in 2006 and in 2050 for the 3 scenarios. To position marginal changes in aviation-related PM2.5 on the appropriate part of the nonlinear concentration–response function, we computed marginal mortality due to aviation-related PM2.5 changes in the context of total PM2.5 concentrations from all anthropogenic emission sectors20 in 2006 and 2050. For this, we subtracted the total PM2.5 concentrations from all emission sectors excluding the aviation sector from the total PM2.5 concentrations from all emission sectors. PM2.5-related mortality for four chronic diseases from the 2010 GBD Assessment was calculated for adults aged 25 and older: ischemic heart disease (IHD); stroke; trachea, bronchus, and lung cancers (LC); and chronic obstructive pulmonary disease (COPD).
In our core analysis, we used the new integrated exposure-response (IER) model developed by Burnett et al. for the 2010 GBD study, to link changes in pollution concentration to changes in relative risk (RR) for the four outcomes of interest.26 The IER model has the form of:
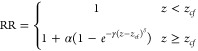 |
where z is the PM2.5 concentration (μg/m3), and zcf is the counterfactual concentration, below which no adverse effect is observed. Here, we assumed zcf = 7.5 μg/m3.
This model form has three key properties:
-
1.
RR must equal 1 when PM2.5 values are below some counterfactual/threshold exposure concentration.
-
2.
RR increases monotonically as PM2.5 exposure concentration increases, and flattens out when z is very large (e.g., concentration equivalent to those experienced by heavy smokers).
-
3.
This model form can take a variety of shapes, thus can be used in depicting the relationships between a wide range of exposures and outcomes.
We obtained the central (50%), lower bound (2.5%), and upper bound (97.5%) RR estimates at integer concentrations ranging from 1–1000 μg/m3 exposure level for the four health outcomes (Dr. Richard Burnett, personal communication). Details of the model and simulation process are described in Burnett et al., 2014.26 For each outcome, we fitted the RR estimates and PM2.5 concentration with the IER model to get the upper bound, central, and lower bound estimates of the three parameters (α,γ,δ)(Table 1). The attributable fraction (AF), which characterizes the fraction of the disease burden attributable to the risk factor, is defined as follows:
AF was multiplied by the baseline mortality rate (y0) and size of the exposed population (pop) to yield an estimate of the excess mortality (Δmort) attributable to PM2.5 pollution:
Plugging in the RR, we have the following:
 |
We calculated excess mortality that is attributable to the aviation sector by subtracting the excess mortality attributable to the nonaviation sector from excess mortality attributable to the total emissions.
Table 1. Output of IER Model Fitting for the Four Disease Outcomes.
| α | γ | δ | R2 | ||
|---|---|---|---|---|---|
| ischemic heart disease (IHD) | lower bounda | 1.122 34 | 0.048 14 | 0.408 38 | 0.999 38 |
| centrala | 0.956 04 | 0.079 54 | 0.479 65 | 0.908 55 | |
| upper bounda | 1.244 13 | 0.033 81 | 0.861 29 | 0.929 38 | |
| stroke | lower bounda | 0.935 55 | 0.02345 | 0.550 06 | 0.9996 |
| centrala | 1.087 98 | 0.0376 | 0.861 27 | 0.9062 | |
| upper bounda | 1.417 88 | 0.020 66 | 1.157 89 | 0.931 09 | |
| chronic obstructive pulmonary disease (COPD) | lower bounda | 5.7029 | 0.000 591 534 | 0.867 79 | 0.999 98 |
| centrala | 15.400 51 | 0.0011 | 0.683 37 | 0.990 84 | |
| upper bounda | 78.896 41 | 0.000 437 496 | 0.627 46 | 0.995 12 | |
| lung cancer (LC) | lower bounda | 44.023 23 | 0.000 039 270 5 | 1.007 22 | 1 |
| centrala | 210.684 47 | 0.000 088 828 5 | 0.737 | 0.996 93 | |
| upper boundb | 223.069 11 | 0.000 180 971 | 0.66033 | 0.9979 |
Performed iterations until fit converged–tolerance criterion satisfied.
Iterations Performed >2000. Chi-sqr is reduced, not converged.
Baseline Mortality Rate and GBD Population at the Regional Scale
Cause-specific baseline mortality rates for the baseline calculations were obtained from the GBD 2010 data.27 All countries within the same region were applied one baseline mortality rate. These data were also used to calculate the following values for the 21 regions:
-
1.
Total Population = absolute number of deaths for all ages/death rate per 100 000 population for all ages
-
2.
Population over 25 years = absolute number of deaths over 25/death rate per 100 000 population over 25
-
3.
The fraction of population over 25 years = Population over 25 years/Total Population
Gridded CIESIN (Center for International Earth Science Information Network) Population Data
Population data28 at a much finer scale (2.5′ × 2.5′ or roughly 4 × 4 km2) from the Gridded population of the World Version 3 were used to determine the exposed population for each PM2.5 cell. We summed this CIESIN population data by region and calculated ratios of GBD population/CIESIN population by region, and applied this ratio to each PM2.5 cell to adjust the CIESIN population to GBD population (hereon called adjusted population). This adjustment matches the CIESIN population with the GBD population on a regional scale. The fraction of population 25 years and older was also applied to each cell to get the population for this group. We assumed constant population in the years 2010 and 2050.
We conducted three sensitivity analyses to explore the impacts of (1) different exposure response function models, (2) different population data sources, and (3) age groups on the mortality estimates. The alternative function used in the first sensitivity analysis is from the GBD 2004 model and has the common log–linear relationship between RR and concentrations defined by epidemiology studies:3
β is concentration–response factor and Δx is the change in PM2.5 concentration. RRs (per 10 μg/m3 increase in PM2.5) from the American Cancer Society Study are 1.26 (95% CI: 1.16–1.38) for IHD, 1.12 (95% CI: 1.01–1.24) for stroke, 1.05 (95% CI: 0.95–1.17) for COPD, and 1.14 (95% CI: 1.06–1.23) for lung cancer. Thus, β equals to 0.0231 (95% CI: 0.0148–0.0322) for IHD, 0.0113 (95% CI: 0.000995–0.0215) for stroke, 0.00488 (95% CI: −0.00513–0.0157) for COPD, and 0.0131(95% CI: 0.00583–0.0207) for lung cancer. Similarly, we have
The baseline mortality rate and population data were held constant as in the core analysis, but employed a low concentration threshold of 7.5 μg/m3, as was used for the IER model in the 2010 GBD assessment,29 and a high concentration threshold of 50 μg/m3 in the mortality calculations.
In the second sensitivity analysis, we compare the impact of mortality estimates using the adjusted population to the CIESIN gridded population, and in the final analysis, we compare total mortality estimates for all ages and adults over 25 years old.
Results
PM2.5 surface concentration levels were calculated for all anthropogenic emissions and isolated for the aviation sector in 2006, under three future aviation emission scenarios in 2050. The global average PM2.5 surface concentrations for each scenario are shown in Table 2. In 2006, the global average PM2.5 concentration from all sources is 11.49 μg/m3. Global average PM2.5 concentration from the aviation sector in 2006 was 0.003 μg/m3 because emissions from the aviation sector only comprises a very small fraction of all anthropogenic emissions.30 Aviation PM2.5 global average concentration increases to 0.018 μg/m3 at 2050 under the ref scenario; however, the Tech & Op and Alt Fuel scenarios yield lower global average concentrations of 0.008 μg/m3 and 0.006 μg/m3, respectively, closer to the 2006 baseline level. In contrast to the aviation sector results, surface PM2.5 from all anthropogenic sources actually decreases in 2050 relative to 2006 due to implementation of control policies in nonaviation sectors, and due to feedbacks from physical climate change on secondary aerosol production rates and aerosol lifetimes.
Table 2. Average Global PM2.5 Concentrations in μg/m3a.
| 2006 | 2050 |
|||
|---|---|---|---|---|
| Average Global Pm2.5 Concentrations | Baseline | Ref | Tech & Op | Alt Fuel |
| All Emission Sectors | 11.486 | 11.037 | 11.026 | 11.028 |
| aviation sector | 0.002 | 0.016 | 0.007 | 0.005 |
Shows average PM2.5 concentrations for all emission sectors combined and just the aviation sector under each of the four scenarios.
SI Figures S1–4 show the global distribution of PM2.5 surface concentrations attributable to the aviation sector. In 2006, the highest PM2.5 concentrations are seen in the western regions of Europe and western regions of China. Under the 2050 ref scenario, high concentrations are seen across the northern hemisphere. PM2.5 concentrations decrease under the Tech & Op scenario, with some of the highest levels seen in U.S., western regions of Europe and China, Japan, Greenland, and the Middle East region. The decrease is even greater under the Alt Fuel scenario.
PM2.5-related health impacts attributable to aviation sector emissions were calculated by subtracting PM2.5-related mortality due to all emission sectors excluding the aviation sector (data not shown) from PM2.5-related mortality due to all emission sectors. In the core analysis, we focused on population over the age of 25 and used the adjusted population. The central, lower, and upper bound estimates for the four health outcomes were calculated under each scenario. The results are shown in Table 2. Mortality estimates for all ages, and using the unadjusted CIESIN population can be found in the SI.
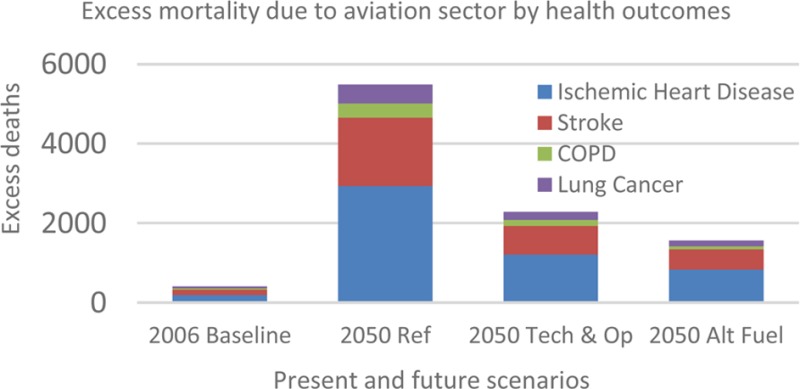
Table 3 shows global aviation-sector mortality estimates for persons 25 years and older in 2006 and in 2050 under the three future emissions assumptions (described above in Methods) using the adjusted population. In 2006, PM2.5 emissions from the aviation sector resulted in an estimated 405 excess deaths globally for the four chronic disease outcomes, with a lower bound of 182 and upper bound of 648 deaths. IHD carried the greatest burden of 192 deaths, roughly 47.4% of all four deaths included in our analysis. This was followed by stroke with 136 deaths (33.7%), LC with 41 deaths (10.1%), and COPD with 36 deaths (8.9%). In 2050 under the ref scenario, total excess deaths increased to 5490 deaths with a lower and upper bound of 2710 and 6841, respectively; this is an increase by 12.6 times from 2006. The greatest burden was seen in IHD with an increase to 2935 deaths (53.5%), an increase by 14.3 times, and the lowest from COPD with an increase to 346 deaths, an increase by 8.6 times. Under the Tech & Op scenario, we estimated smaller increases in excess mortality for all outcomes, with a total excess mortality of 2286 deaths. Excess mortality was even lower under the Alt Fuel scenario (1562 deaths), although still roughly 3 times higher than 2006 values. In 2006, excess mortality due to IHD is 47.4%, and in 2050 across the three scenarios, this percentage increases to an average of 53.1%. Similarly, for stroke, COPD, and LC, the percentages change from 33.7% to an average of 32.0%, 8.9% to 5.9%, and 10.1% to 8.9%, respectively.
Table 3. Excess Mortality Due to Emissions from Aviation Sector (ages ≥25 Years, GBD Adjusted Population)a.
| 2006 | 2050 |
||||
|---|---|---|---|---|---|
| over 25 excess mortality | baseline | ref (factor of increase from baseline) | Tech & Op (factor of increase from baseline) | Alt Fuel (factor of increase from baseline) | |
| ischemic heart disease (IHD) | upper bound | 328 | 3406 (9.4) | 1445 (3.4) | 991 (2.0) |
| central | 192 | 2935 (14.2) | 1208 (5.3) | 829 (3.3) | |
| lower bound | 123 | 1929 (14.6) | 782 (5.4) | 522 (3.2) | |
| stroke | upper bound | 194 | 1998 (9.3) | 832 (3.3) | 588 (2.0) |
| central | 136 | 1725 (11.7) | 721 (4.3) | 517 (2.8) | |
| lower bound | 39 | 589 (14.1) | 245 (5.3) | 173 (3.4) | |
| chronic obstructive pulmonary disease (COPD) | upper bound | 58 | 590 (9.2) | 260 (3.5) | 137 (1.4) |
| central | 36 | 346 (8.6) | 155 (3.3) | 73 (1.0) | |
| lower bound | 13 | 112 (7.6) | 53 (3.1) | 16 (0.2) | |
| lung cancer (LC) | upper bound | 67 | 846 (11.6) | 352 (4.3) | 255 (2.8) |
| central | 41 | 484 (10.8) | 202 (3.9) | 143 (2.5) | |
| lower bound | 7 | 80 (10.4) | 34 (3.9) | 21 (2.0) | |
| total | upper bound | 648 | 6841 (9.6) | 2889 (3.5) | 1970 (2.0) |
| central | 405 | 5490 (12.6) | 2287 (4.6) | 1562 (2.9) | |
| lower bound | 182 | 2710 (13.9) | 1114 (5.1) | 732 (3.0) | |
Shows excess mortality due to PM2.5 from the aviation sector for four outcomes under each of the four scenarios. The lower and upper bounds were calculated using the lower and upper bounds of each of the three parameters in the health impact calculations. Present day population was used for both 2006 and 2050 calculations.
The Alt Fuel scenario yielded the least excess deaths among the 2050 scenarios. The Tech & Op scenario resulted in 58.3% less deaths and the Alt Fuel scenario resulted in 71.5% less deaths compared to the 2050 ref scenario.
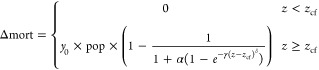
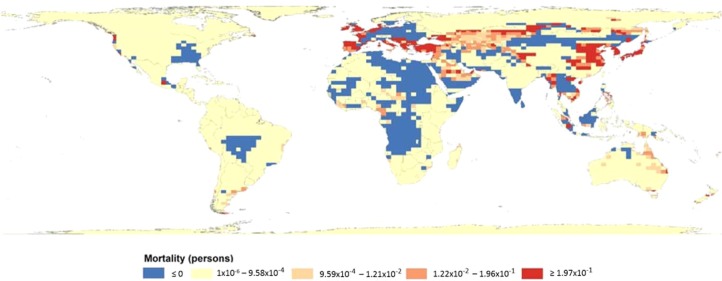
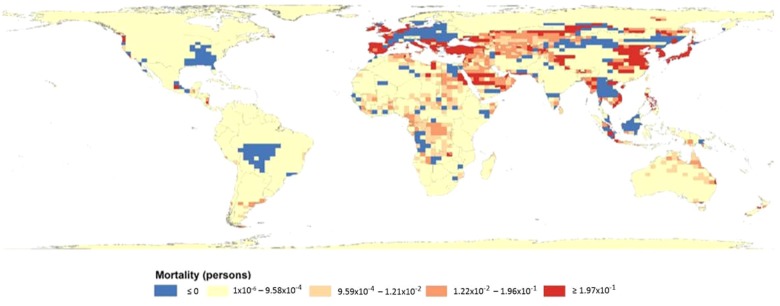
To visualize the global mortality burden, we mapped total PM2.5-related mortality due to the four cardio-respiratory outcomes attributable to the aviation sector in 2006 (Figure 1). Mortality is greatest in Europe, Southeast Asia, Japan, and northern regions of China. Effects are seen in parts of U.S., Russia, Middle East, Africa, and Australia as well. Figure 2–4 maps the difference in total PM2.5-related mortality attributable to the aviation sector between 2006 and each of the three scenarios in 2050. In Figure 2, the difference in PM2.5-related mortality attributable to the aviation sector between the 2050 ref scenario and 2006 baseline shows that the greater increase in mortality can be seen in eastern parts of China, Japan, western Russia, and the Middle Eastern regions. Mortality decreases in Southeast Asia, Eastern Europe, western Brazil, and parts of the U.S. where mortality burden was high in 2006. In Figures 3 and 4, there is a global decrease in PM2.5-related mortality attributable to the aviation sector, and the figures suggest that under each improved fuel scenario, some regions benefit more from the improved fuels than others. Figure 3, which maps mortality difference between the 2050 Tech & Op scenario and 2006 baseline, shows a similar mortality burden distribution to Figure 2; however, mortality decreases in parts of western Asia and Africa. Figure 4 shows a drastic decrease in mortality in Africa, Middle East, and northern regions of China under the 2050 Alt fuel scenario. These areas seem to benefit the most by converting to fully sustainable alternative fuels.
Figure 1.
Total mortality attributabe to aviation sector (2006 Baseline). PM2.5-related mortality for four chronic cardio-respiratory outcomes attributable to the aviation sector.
Figure 2.

Difference in total mortality attributable to aviation sector (2050 ref −2006 Baseline). Shows difference in PM2.5-related mortality for four chronic cardio-respiratory outcomes attributable to the aviation sector obtained by subtracting 2006 Baseline values from 2050 ref values.
Figure 4.
Difference in total mortality attributable to aviation sector (2050 Alt Fuel −2006 Baseline). Shows difference in PM2.5-related mortality for four chronic cardio-respiratory outcomes attributable to the aviation sector obtained by subtracting 2006 Baseline values from 2050 Alt Fuel values.
Figure 3.
Difference in total mortality attributable to aviation sector (2050 Tech & Op–2006 Baseline). Shows difference in PM2.5-related mortality for four chronic cardio-respiratory outcomes attributable to the aviation sector obtained by subtracting 2006 Baseline values from 2050 Tech & Op values.
Detailed results for the sensitivity analysis can be found in the SI. Briefly, the first sensitivity analysis that compares the model from the 2004 GBD assessment to the IER model yielded higher PM2.5-related mortality estimates in 2006 using the older model, but higher estimates for 2050 using the IER model. In the second analysis, estimates using the GBD regional population data yielded slightly higher values than the CIESIN population data. Comparing the two age groups in the third analysis, we saw similar results in the mortality estimates between all adults and adults 25 years or older.
Discussion
This study is the first to estimate global mortality due to PM2.5 emitted from the aviation sector using the updated IER model employed for the 2010 GBD assessment. The greatest mortality was due to IHD under all scenarios, followed by stroke, LC, and COPD. Excess mortality in 2050 was greatest under the ref scenario, and the estimates decreased with improving emissions scenarios. The Alt Fuel scenario yielded the lowest mortality estimates. Our mortality results lie in between those of Barrett et al. and Jacobson et al. that studied mortality due to cruise and LTO emissions. Our values are consistent with the lower end of the range of those of Jacobson et al.18
Our results suggest that, while current aviation emissions contribute little to the global burden of PM2.5-related mortality, future increases in aviation emissions could significantly increase health impacts. The 2050 ref scenario assumes a fuel burn increase by a factor of 4.8 over baseline levels. This leads to a 12.6 times increase in mortality in 2050 due to the four chronic cardio-respiratory outcomes included in the analyses of this study. However, with improvements in technology and operations where fuel emissions are increased by only a factor of 2.7 in addition to NOx emission improvements, mortality can be reduced to a 4.7 times increase in 2050. An additional conversion to fully sustainable alternative fuels could further limit cardiovascular mortality to a 2.9 times increase in 2050 from baseline in 2006. These results demonstrate that aviation emission improvement policies have important health benefits.
We chose to focus on mortality results of adults age 25 and older with the assumption that the four cardiorespiratory outcomes we included in our analyses most commonly occur among adults over age 25. Our results suggest that the population group used in the assessment does not impact the results much (see SI for mortality results for all ages).
Previous studies11−14 have used different health impact assessment methods (e.g., Anenberg et al).31 The advantage of using this IER model over the previous health impact assessment method is that it models health risks across a broad range of PM2.5 concentrations, based on the integration of results from studies on ambient air pollution, household air pollution, and cigarette smoking. This new model is thus more directly applicable across the broad range of concentrations observed around the world, and further allows flexibility for the investigators to adjust the dose–response curve to the air pollutant and health outcomes under study. Because of this flexibility, the model can also take into account new RR values as they are published, and the health impact due to air pollution can be re-evaluated using the same model. On the basis of our first sensitivity analysis, the PM2.5-related mortality estimates attributable to the aviation sector differ between the two models and in different directions depending on the year (see SI). The higher estimates for the 2050 scenarios using the IER model is probably due to the fact that risk continues to increase above 50 μg/m3 in the IER model whereas risk plateaus above that point in the older GBD model.
The 2010 GBD assessment reported that all cause-mortality attributable to PM2.5 is 3,223,540 (95% Uncertainty Interval: 2 828 854–3 619 148). The equivalent value for all cause-mortality attributable to PM2.5 that we obtained were roughly 60% lower at the central estimate (see SI Table S8). This difference is largely due to the differing PM2.5 estimation methods, since we used the same baseline mortality rates, dose–response function, and adjusted for the difference in the population from different sources. The GBD assessment used the average of the TM5 global atmospheric model, which is a nested 3-dimensional global atmospheric chemistry transport model, and a satellite-derived PM2.5 approach that used Aerosol Optical Depth to measure ground level PM2.5 concentration on a 0.1° × 0.1° grid, whereas the current study used PM2.5 surface concentrations simulated by a process-based global chemistry-climate model at 2° × 2.5° horizontal resolution.
Our analysis used pollution data from 2006, and population and baseline mortality rates from 2010. Although global population increased from 2006 to 2010, the population change and direction of change varies by country. The impact on excess mortality will also depend on how the population change overlaps with some of the heavily polluted regions of the world. However, we do not think that this discrepancy greatly impacted the results.
A comparison of the two population sources in our third sensitivity analysis showed that PM2.5-related mortality estimates attributable to the aviation sector were slightly smaller using the CIESIN population data compared to the GBD regional population data. The baseline mortality rates were also obtained from the GBD data, and therefore, the population data most likely “fit” the baseline mortality data better, whereas there was a 2% loss of the population to bodies of water using the CIESIN data, thus, the lost population could have been missed in the mortality estimates, resulting in lower values using the CIESIN data.
The 2010 GBD assessment included acute lower respiratory infections (ALRI) for population under 5 years of age as part of cardiovascular and respiratory diseases. However, we did not include this in our assessment because we focused our analysis on adult chronic diseases.
In Figure 1, it is worth mentioning that a large part of China has total mortality values of less than 0. We grouped together all mortality estimates equal to or less than 0 for visual purposes. A mortality estimate of 0 could have resulted for several reasons. If the total PM2.5 concentration from all emission sectors is less than 7.5 μg/m3, then the mortality is 0, as this is below the counterfactual concentration. Alternatively, if the total PM2.5 concentration is greater than 7.5 μg/m3 but the PM2.5 concentration from the aviation sector is negative (SI Figure S1), the mortality was also 0. In comparison, the dark brown region in parts of western China has high mortality (Figure 1). This is because total PM2.5 (data not mapped) and aviation sector attributable PM2.5 concentrations (SI Figure S1) are both high.
In Figures 2–4, some areas that were predicted to have high mortality do not overlap with those that were predicted to have high PM2.5 concentrations. The reason for this is that these maps are capturing the difference in mortality that is a result of the change in scenarios. Therefore, if PM2.5 concentration is high in both scenarios being compared, then the map would show that the mortality is low. The greatest potential benefits due to improved fuel changes are in regions with the warmest colors such as eastern China, eastern Europe, the Middle East, and parts of Africa and Australia.
There were a few limitations to this study. We did not account for any changes in the total population nor the baseline mortality in 2050. With projections of an increasingly aging global population, excess mortality estimates could be much greater in the future due to an increase in the elderly and susceptible group. However, we held population constant in order to focus on the mortality changes solely due to the changes in PM2.5 concentrations resulting from future scenarios. Population growth in the future would result in increased mortality burdens; in this sense our analysis is conservative.
Although we have data on concentration levels of individual species of PM2.5, we did not analyze the effects of the individual species. Pinpointing which species has the greatest impact on human health, given the toxicity and the concentration of each from aviation emissions, could be helpful in targeting future policy to reduce emissions of the most harmful species; however, this is beyond the scope of our analysis.
While the IER function uses a low concentration threshold of 7.5 μg/m3, evidence of a low-concentration threshold is questionable.1,11,31 Cohen et al. explores low concentration thresholds of 3 μg/m3, 7.5 μg/m3, and 15 μg/m3, and observed that mortality estimates increased with a lower low concentration threshold by 24–29%, depending on the health outcome.29 The increase in mortality was greater in regions where there was less PM2.5 pollution. However, the thresholds incorporated in the IER function is based on the idea that exposure response relationship is not linear. The low threshold used in our analyses is half of the limit set by the Environmental Protection Agency under the National Ambient Air Quality Standards for annual ambient PM2.5 levels of 15 μg/m3.29 Future research should explore the sensitivity and impact of different threshold levels under 15 μg/m3.Our subgrid resolution of 2° × 2.5 could potentially be further downscaled for finer resolution. We used this resolution to match our coarsest data, which was the PM2.5 data. Coarse data could lead to exposure misclassification, and using finer scale pollution data, or downscaling methods, in future studies may provide higher mortality.32
One approach is PM2.5 concentration redistribution over a subgrid resolution according the density of PM2.5 emission source and population density. Shindell et al. has done this using a particular population threshold to distinguish urban and rural areas; however, this threshold should be further explored.14 It would also be worth isolating the impacts of cruise and LTO emissions on health effects.
Acknowledgments
This work was supported by Center Grant #P30 ES09089 from the National Institute of Environmental Health Sciences and Grant #NNX09AN77G from the National Oceanic and Atmospheric Administration.
Supporting Information Available
Includes results from the three sensitivity analyses that examined the effect of using a different exposure response model, different population sources, and age groups along with associated tables. Also included are global PM2.5 concentration distribution maps. This material is available free of charge via the Internet at http://pubs.acs.org.
The emissions inventories used for this work were provided by US DOT Volpe Center and are based on data provided by the US Federal Aviation Administration and EUROCONTROL in support of the objectives of the International Civil Aviation Organization Committee on Aviation Environmental Protection. Any opinions, findings and conclusions or recommendations expressed in this material are those of the authors and do not necessarily reflect the views of the US DOT Volpe Center, the US FAA, EUROCONTROL, or ICAO.
The authors declare no competing financial interest.
Funding Statement
National Institutes of Health, United States
Supplementary Material
References
- Pope C. A. I.; Burnett R. T.; Thun M. J.; Calle E. E.; Krewski D.; Ito K.; Thurston G. D. Lung cancer, cardiopulmonary mortality, and long-term exposure to fine particulate air pollution. JAMA 2002, 287, 1132–1141. [DOI] [PMC free article] [PubMed] [Google Scholar]
- Dominici F.; Peng R. D.; Bell M. L.; Pham L.; McDermott A.; Zeger S. L.; Samat J. M. Fine particulate air pollution and hospital admission for cardiovascular and respiratory diseases. JAMA 2006, 295, 1127–1134. [DOI] [PMC free article] [PubMed] [Google Scholar]
- Krewski D.; Jerret M.; Burnett R. T.; Ma R.; Hughes E.; Shi Y.; Turner M. C.; Pope C. A. T. G.; Calle E. E.; Thun M. J.. Extended Follow-Up and Spatial Analysis of the American Cancer Society Study Linking Particulate Air Pollution and Mortality, 2009. [PubMed]
- Anenberg S. C. An estimate of the global burden of anthropogenic ozone and fine particulate matter on premature human mortality using atmospheric modeling. Environ. Health Perspect. 2010, 118, 1189–1195. [DOI] [PMC free article] [PubMed] [Google Scholar]
- van Donkelaar A.; Martin R. V.; Brauer M.; Kahn R.; Levy R.; Verduzco C.; Villeneuve P. J. Global estimates of ambient fine particulate matter concentrations from satellite-based aerosol optical depth: Development and application. Environ. Health Perspect. 2010, 118, 847–855. [DOI] [PMC free article] [PubMed] [Google Scholar]
- Zheng M.; Salmon L. G.; Schauer J. J.; Zeng L.; Kiang C.; Zhang Y.; Cass G. R. Seasonal trends in PM2. 5 source contributions in Beijing, China. Atmos. Environ. 2005, 39, 3967–3976. [Google Scholar]
- Kan H.; London S. J.; Chen G.; Zhang Y.; Song G.; Zhao N.; Jiang L.; Chen B. Differentiating the effects of fine and coarse particles on daily mortality in Shanghai, China. Environ. Int. 2007, 33, 376–384. [DOI] [PMC free article] [PubMed] [Google Scholar]
- Kulshrestha A.; Satsangi P. G.; Masih J.; Taneja A. Metal concentration of PM2.5 and PM10 particles and seasonal variations in urban and rural environment of Agra, India. Sci. Total Environ. 2009, 407, 6196–6204. [DOI] [PubMed] [Google Scholar]
- Pope C. A. I.; Burnett R. T.; Thurston G. D.; Thun M. J.; Calle E. E.; Krewski D.; Godleski J. J. Cardiovascular mortality and long-term exposure to particulate air pollution: epidemiological evidence of general pathophysiological pathways of disease. Circulation 2004, 109, 71–77. [DOI] [PubMed] [Google Scholar]
- Lim S. S. A comparative risk assessment of burden of disease and injury attributable to 67 risk factors and risk factor clusters in 21 regions, 1990–2010: A systematic analysis for the Global Burden of Disease Study 2010. Lancet (Br. ed.) 2012, 380, 2224–2260. [DOI] [PMC free article] [PubMed] [Google Scholar]
- Fann N. Estimating the national public health burden associated with exposure to ambient PM2.5 and ozone U.S. public health burden of PM2.5 and ozone. Risk Anal. 2012, 32, 81–95. [DOI] [PubMed] [Google Scholar]
- Corbett J. J.; Winebrake J. J.; Green E. H.; Kasibhatla P.; Eyring V.; Lauer A. Mortality from ship emissions: A global assessment. Environ. Sci. Technol. 2007, 41, 8512–8518. [DOI] [PubMed] [Google Scholar]
- Saikawa E.; Naik V.; Horowitz L. W.; Liu J.; Mauzerall D. L. Present and potential future contributions of sulfate, black and organic carbon aerosols from China to global air quality, premature mortality and radiative forcing. Atmos. Environ. 2009, 43, 2814–2822. [Google Scholar]
- Shindell D.; Faluvegi G.; Walsh M.; Anenberg S. C.; Van Dingenen R.; Muller N. Z.; Austin J.; Koch D.; Milly G. Climate, health, agricultural and economic impacts of tighter vehicle-emission standards. Nat. Clim. Change 2011, 1, 59–66. [Google Scholar]
- Levy J. I.; Woody M.; Baek B. H.; Shankar U.; Arunachalam S. Current and future particulate-matter-related mortality risks in the United States from aviation emissions during landing and takeoff. Risk Anal. 2012, 32, 237–249. [DOI] [PubMed] [Google Scholar]
- Barrett S. R.; Britter R. E.; Waitz I. A. Global mortality attributable to aircraft cruise emissions. Environ. Sci. Technol. 2010, 44, 7736–7742. [DOI] [PubMed] [Google Scholar]
- Jacobson M.; Wilkerson J.; Naiman A.; Lele S. K. The effects of aircraft on climate and pollution. Part I: Numerical methods for treating the subgrid evolution of discrete size-and composition-resolved contrails from all commercial flights worldwide. J. Comput. Phys. 2011, 230, 5115–5132. [Google Scholar]
- Jacobson M. Z.; Wilkerson J. T.; Naiman A. D.; Lele S. K. The effects of aircraft on climate and pollution. Part II: 20-year impacts of exhaust from all commercial aircraft worldwide treated individually at the subgrid scale. Faraday Discuss. 2013, 165, 369–382. [DOI] [PubMed] [Google Scholar]
- Koo J.; Wang Q.; Henze D. K.; Waitz I. A.; Barrett S. R. Spatial sensitivities of human health risk to intercontinental and high-altitude pollution. Atmos. Environ. 2013, 71, 140–147. [Google Scholar]
- Unger N.; Zhao Y.; Dang H. Mid-21st century chemical forcing of climate by the civil aviation sector. Geophys. Res. Lett. 2013, 40, 641–645. [Google Scholar]
- Lee D. S.; Fahey D. W.; Forster P. M.; Newton P. J.; Wit R. C.; Lim L. L.; Owen B.; Sausen R. Aviation and global climate change in the 21st century. Atmos. Environ. 2009, 43, 3520–3537. [DOI] [PMC free article] [PubMed] [Google Scholar]
- Schmidt G. A.; Kelley M.; Nazarenko L.; Ruedy R.; Russell G. L.; Aleinov I.; Bauer M.; Bauer S. E.; Bhat M. K.; Bleck R. Configuration and assessment of the GISS ModelE2 contributions to the CMIP5 archive. J. Adv. Model. Earth Syst. 2014, 61141–184. [Google Scholar]
- Wilkerson J.; Jacobson M. Z.; Malwitz A.; Balasubramanian S.; Wayson R.; Fleming G.; Naiman A.; Lele S. Analysis of emission data from global commercial aviation: 2004 and 2006. Atmos. Chem. Phys. 2010, 10, 6391–6408. [Google Scholar]
- Shindell D.; Pechony O.; Voulgarakis A.; Faluvegi G.; Nazarenko L.; Lamarque J.-F.; Bowman K.; Milly G.; Kovari B.; Ruedy R.. Interactive ozone and methane chemistry in GISS-E2 historical and future climate simulations. Atmos. Chem. Phys. 2013, 13. [Google Scholar]
- Van Vuuren D. P.; Edmonds J.; Kainuma M.; Riahi K.; Thomson A.; Hibbard K.; Hurtt G. C.; Kram T.; Krey V.; Lamarque J.-F. The representative concentration pathways: An overview. Clim. Change 2011, 109, 5–31. [Google Scholar]
- Burnett R. T.; Pope C.; Ezzati M.; Olives C.; Lim S. S.; Mehta S.; Shin H. H.; Singh G.; Hubbell B.; Brauer M. An integrated risk function for estimating the global burden of disease attributable to ambient fine particulate matter exposure. Environ. Health Perspect 2014, 122, 397–403. [DOI] [PMC free article] [PubMed] [Google Scholar]
- Global Burden of Disease Study 2010: Global Burden of Disease Study 2010 (GBD 2010) Results by Cause 1990–2010; Institute for Health Metrics and Evaluation (IHME), Ed., 2012.
- Center for International Earth Science Information Network—CIESIN—Columbia University; United Nations Food + Agriculture Programme—FAO; Centro Internacional de Agricultura Tropica—CIAT: Gridded Population of the World, Version 3 (GPWv3): Population Count Grid, Future Estimates; NASA Socioeconomic Data and Applications Center (SEDAC): Palisades, NY, 2005.
- Cohen A. J.; Anderson H. R.; Ostro B.; Dev Pandey K.; Krzyzanowski M.; Künzli N.; Gutschmidt K.; Pope C. A. III; Romieu I.; Samet J. M.; Smith K. R.: Urban Air Pollution. In Comparative Quantification of Health Risks; Ezzati M. L. A. D., Rodgers A., Murray C. J. L., Eds.; World Health Organization: Geneva, Switzerland, 2004; Vol. 1; pp 1353–1433. [Google Scholar]
- Unger N.; Bond T. C.; Wang J. S.; Koch D. M.; Menon S.; Shindell D. T.; Bauer S. Attribution of climate forcing to economic sectors. Proc. Natl. Acad. Sci. U. S. A. 2010, 107, 3382–3387. [DOI] [PMC free article] [PubMed] [Google Scholar]
- Anenberg S. C.; West J. J.; Fiore A. M.; Jaffe D. A.; Prather M. J.; Bergmann D.; Cuvelier K.; Dentener F. J.; Duncan B. N.; Gauss M. Intercontinental impacts of ozone pollution on human mortality. Environ. Sci. Technol. 2009, 43, 6482–6487. [DOI] [PubMed] [Google Scholar]
- Punger E. M.; West J. J. The effect of grid resolution on estimates of the burden of ozone and fine particulate matter on premature mortality in the USA. Air Qual. Atmos. Health 2013, 6, 563–573. [DOI] [PMC free article] [PubMed] [Google Scholar]
Associated Data
This section collects any data citations, data availability statements, or supplementary materials included in this article.