Abstract
Localized surface plasmon resonance (LSPR) represents a sensitive and versatile method for detection of biomolecules in a label-free fashion, but identification of bound analytes can be challenging with LSPR alone, especially for samples in a complex medium. We report the fabrication of an optically active, plasmonic film of gold nanoparticles by using a self-assembly and calcination process, which offers orthogonal measurements enabling multifaceted characterization on the same surface with LSPR and surface-assisted laser desorption/ionization mass spectrometry. This proof-of-concept study involves plasmonic characterization of the fabricated nanofilm, real-time monitoring of vesicle–surface interactions toward formation of fluid lipid bilayer, and mass spectrometric analysis of peptides and cytochrome c digest. This multifunction-enabling surface material can yield complementary analytical information, providing new tools for comprehensive analysis of biomolecular samples.
The development of highly integrated, multifunctional biosensing platforms is of great importance to the fields of environmental monitoring, toxicity screenings, proteomics, and drug discovery.1 In particular, localized surface plasmon resonance (LSPR) has gained considerable attention as an effective signal transducer due to its sensitivity and versatility.2 LSPR is an optical phenomenon associated with nanomaterials and is typically monitored by changes in the extinction spectra, as LSPR results in strong light absorbing and scattering properties. These properties are influenced by the shape, size, and composition of the nanostructure, making LSPR materials highly tunable.3,4 Compared to the vast literature of solution-based detection, solid-state LSPR sensing comprises only a small portion, yet the fabrication processes remain an active research topic. These processes include top down techniques such as e-beam lithography,5 focused ion beam lithography,6 nanosphere lithography,7 and colloidal lithography,8,9 in addition to bottom up methods, largely dominated by layer-by-layer (LbL) deposition from colloidal solutions.10,11 The LbL method is attractive toward fabricating LSPR substrates, as it allows for nanometer scale control of the substrate without the need of expensive cleanroom equipment, making reproducible substrates accessible to a large audience.12 Despite its sensitivity and versatility, LSPR as a label-free method for the characterization of biomolecular interactions faces the challenge of distinguishing nonspecific binding in its measurements.
Thus, adding another dimension of measurement to these nanomaterials would significantly improve interaction studies, especially with methods that yield chemical and structural information. Mass spectrometry, capable of sophisticated tasks such as sequencing DNA and proteins,13 has been linked to LSPR substrates, as metallic nanostructures such as gold nanoparticles (AuNPs) may directly absorb UV laser light and function in place of an organic matrix during laser desorption/ionization mass spectrometry (LDI-MS).14 Therefore, considerable effort has been placed on preparing nanostructure assemblies that function as surface-assisted laser desorption/ionization (SALDI) platforms.15−17 SALDI is advantageous as it reduces sample preparation for MS and is more amenable to small molecule and drug screening analyses, where matrix-related ions may convolute experimental spectra. However, formation of gold structures that promote desorption/ionization generally compromises the optical properties of the nanoparticles intrinsic in their dispersed states and little success has been made in performing LSPR biosensing and in situ SALDI-MS on the same substrate.
In this work, we report the use of the LbL method combined with our previously established calcination process18,19 (Figure 1) to generate a glass-coated and optically active monolayer film of gold nanoparticles for the detection and identification of biomolecules, as well as characterization of biophysical processes. Developing cross-platform sensing materials poses many challenges in that different techniques require varying optimized conditions in their respective materials. Figure 1 shows the scheme we used for fabricating an ultrathin film for dual-mode LSPR and SALDI-MS analysis. Three parameters were principally optimized during the fabrication process: (a) number of layers of AuNPs, (b) conditions leading to dense packing, and (c) realization of an ultrathin silicate coating. We chose a monolayer configuration of AuNPs for the nanofilm due to the fact that single layer films show fewer nanoscale inconsistencies across the surface.10,19 These nanoparticles needed to be densely packed in order to generate small nanogaps and crevices where heat would concentrate during the LDI-MS process.20 In order to create a densely packed structure, we used a long-chain polyelectrolyte to aggregate multiple nanoparticles via a bridging flocculation effect.21 Finally, the entire film was coated with an ultrathin layer of silicate glass which not only adds functionality18 but also thermally insulates the gold, which is ideal for heat confinement and promoting desorption/ionization in SALDI-MS.19 The substrate was calcinated at 450 °C, in which high temperature combusts the sacrificial polymer layers used to electrostatically immobilize the nanoparticles and creates a dense network of silicate. While the thickness of this silicate film may be tuned by altering the number of PAH/silicate layers, we chose to add only one layer of silicate for a final thickness of ca. 2 nm,18 as this would still allow for plasmonic sensing to occur beyond the thin layer of silicate glass.3,22
Figure 1.
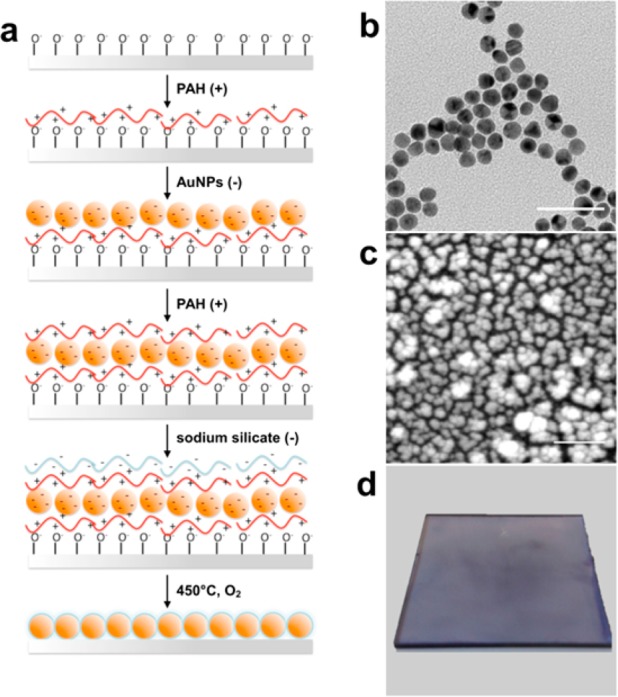
Fabrication scheme for the optically active AuNP monolayer film. (a) The workflow of LbL and calcination steps on a PAH-coated glass slide. (b) TEM image of 13 nm AuNPs from solution, inset scale bar represents 50 nm. (c) SEM image of immoblized and calcinated AuNPs, scale bar represents 200 nm. (d) A photograph of the nanofilm substrate.
SEM characterization confirms a monolayer structure with AuNPs aggregating in different states, consisting mostly of dimer and trimer morphologies, with some larger aggregates. AFM further reveals an average thickness of 26.1 ± 5.7 nm, consistent with the monolayer arrangement of aggregates and proving that a precisely controlled self-assembled nanoparticle substrate can be obtained using our approach (Figures S1 and S2 in the Supporting Information). SEM images also confirm the film robustness offered by the nanosilicate coating, as calcination of the AuNP film without the protective layer resulted in destructive thermal annealing of nanoparticles and loss of plasmonic activity (Figure S1 in the Supporting Information). The calcinated AuNP film displays well-defined absorption spectra and good LSPR sensitivity for spherical nanoparticles, with a bulk sensitivity of 84 ± 10 nm/RIU obtained with different solvents (Figure 2a), which is equivalent to that of other reported solid-bound AuNP structures.23 The differential extinction spectrum approach was employed for data analysis so that refractive index sensitivities may be evaluated at any given wavelength, rather than limited at the extinction peaks.24 For calcinated monolayer AuNPs, we observed that wavelengths higher than the initial peak display higher sensitivities, with the sensitivity of 0.106 NEU/RIU at 570 nm increasing to 0.497 NEU/RIU at 600 nm (Figure 2b).
Figure 2.
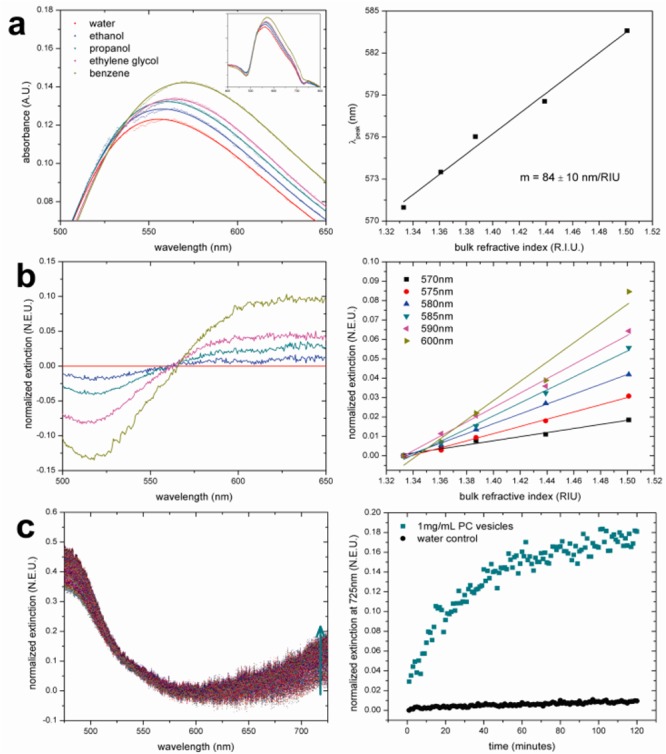
Characterization of LSPR performance with calcinated AuNP films. (a) Absorption spectra near the peak in solutions with varying refractive index and evaluation of RI sensitivity at peak wavelength. (b) Differential spectra and valuation of RI sensitivity at multiple wavelengths. (c) Differential spectra of the film in PC vesicle suspension over time and change in normalized extinction at 725 nm indicating lipid bilayer formation.
The addition of a nanosilicate coating via LbL/calcination appends new functionality not typically seen in other LSPR substrates. Different from metal substrates that generally suppress bilayer formation,25,26 lipid bilayers are readily formed on silicate glass, which provides a hydrophilic surface that allows phospholipid vesicles to rupture, fuse, and self-assemble.18 To demonstrate this feature and assess LSPR surface sensitivity, interactions of phosphatidylcholine vesicles and formation of a lipid bilayer on the surface from a bulk vesicle suspension were investigated (Figure 2c). The differential extinction spectra in Figure 2c show that this surface interaction shifts the AuNP absorbance to the greater extent at higher wavelengths, while there is no change across the entire spectrum when immersed only in water. When the normalized extinction spectrum at 725 nm is plotted against time, a kinetic curve can be obtained that shows that the bilayer formation process reaches a plateau in about an hour, which is slower than previous studies on calcinated flat gold substrates.18,27 This has been attributed to the rough surface of the nanoparticles themselves. Fluorescence recovery after photobleaching (FRAP) was performed to confirm this, as well as to provide verification that the bilayer was continuous and mobile. Using previously established methods,28 a diffusion coefficient of 2.95 μm2/s was obtained, along with a mobile fraction value of 0.86. Fluorescence images show that supported bilayer membrane covers the entire nanofilm surface, with scattered areas of higher fluorescence intensity indicative of defect spots (Figure S3 in the Supporting Information). While the mobile fraction value was lower than 1, the diffusion coefficient agrees with those of lipid bilayers on other glassy surfaces, which range from 1 to 4 μm2/s.29 These data suggest that the slow formation may be the result of a poor fusion process of lipid vesicles on the rough nanoparticle substrate, yielding a complex bilayer structure. The mobility of lipids in defect spots is restricted, leading to slightly lower mobile fraction value. However, the observed high lateral mobility after extensive incubation is comparable to those of other uniform glass surfaces, rendering the calcinated nanofilm suitable for studies where a natural lipid membrane environment is necessary for function.
It is interesting to note that this solid state AuNP film showed very different transmission properties compared to those of other AuNP films,30 as well as monodisperse AuNPs of the same size in solution. While this is largely due to the local aggregation of nanoparticles, we sought to understand how neighboring structures plasmonically coupled and contributed to observed experimental results. Finite-difference time-domain (FDTD) simulations were carried out with a number of packing morphologies based on SEM and a 2 nm silica coating. Results indicated that the optical properties of this film were largely reflective of arrayed dimer and trimer morphologies (Figure 3). For instance, the primary peak of the simulated dimer array matches closely with the left shoulder peak of the experimental substrate (at λ = 530), in addition to the primary peak of both the trimer array and experimental substrate (both at λ = 560–570 nm). It appears that the calcination step promotes reproducible structures (dimer and trimer morphologies) that manifest in consistent experimental results (i.e., similar extinction bands and RI sensitivities). In addition, the strong coupling of neighboring nanostructures unique in the solid state leads to plasmonic properties responsible for LSPR sensitivity, which may also be useful for other types of surface enhancement.
Figure 3.
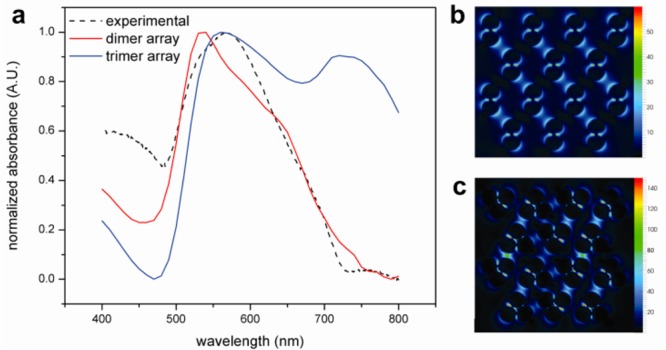
Numerical simulations and comparison to experimental results. (a) Experimental spectrum of calcinated AuNP compared to those of simulated arrays. (b) Electric field intensity map for simulated dimer array at λ = 540 nm. (c) Electric field intensity map for simulated trimer array at λ = 560 nm.
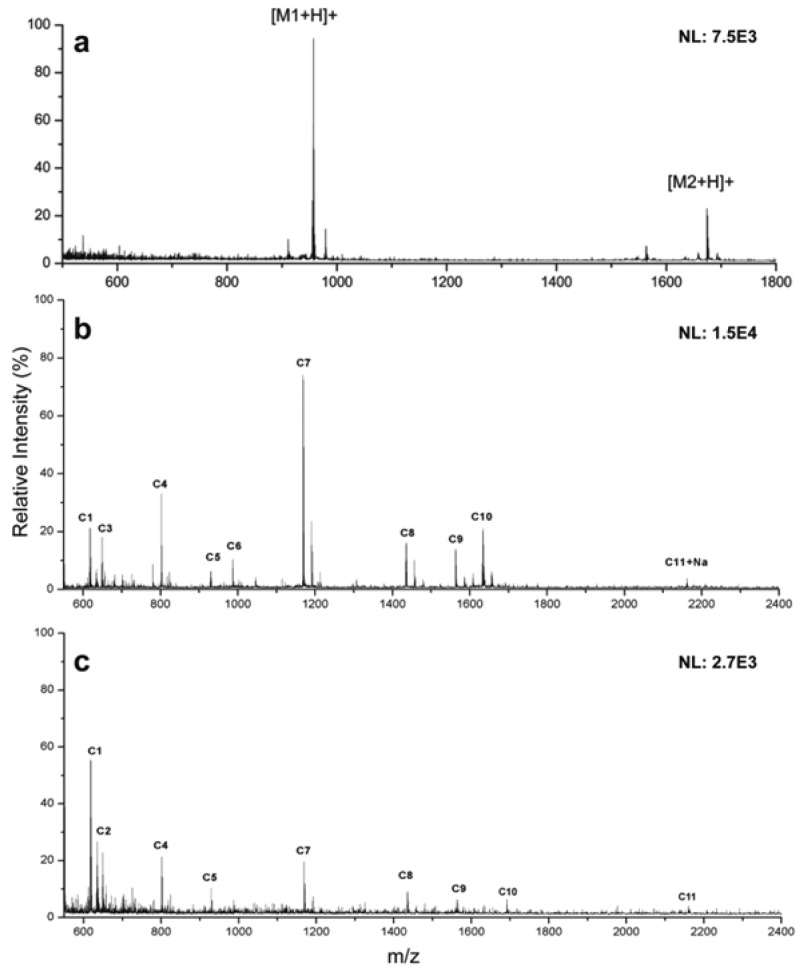
Gold nanoparticles have shown excellent performance in place of traditional MALDI-MS matrices due to their broad absorption, which ranges from UV to the visible regions.14 To demonstrate matrix-free SALDI-MS analysis with the calcinated AuNP film, ionization of two peptides, [Sar1, Thr8]-angiotensin II and neurotensin, was investigated (Figure 4a). When 2 pmol of each peptide was ionized on the AuNP film, comparable results were obtained to MALDI that uses CHCA as a matrix (Figure S4a in the Supporting Information). Citric acid was added to all samples as it does not absorb UV light but is capable of donating protons to promote the formation of [M + H]+ cations. The [M + H]+ peaks can be readily distinguished in both spectra, and background noise is very low. There are also no gold clusters evident in the spectra, which has been an issue for some similar work using AuNPs as SALDI-MS substrates.14−16 This can be attributed to the calcinated silicate layer, which offers protection of the AuNPs and anchors them to the surface during the LDI process. Furthermore, the calcinated silicate film has a low thermal conductivity and assists in confining heat to localized areas, promoting desorption from the surface and increasing LDI performance.19
Figure 4.
Laser desorption/ionization performance of the calcinated AuNP film and comparison to MALDI. (a) SALDI spectrum of [Sar1, Thr8]-angiotensin II (M1=956.1) and neurotensin (M2 = 1672). (b) SALDI spectrum of a cytochrome c digest. (c) MALDI spectrum of the same cytochrome c digest with CHCA used as matrix.
Further MS characterization was carried out with a tryptic digest of cytochrome c, which yields more information about the nanofilm performance for proteomic studies (Figure 4b). Comparable results for 80 pmol of cytochrome c digest are obtained between SALDI and MALDI, though the SALDI results detected one less peptide (Table S1 in the Supporting Information). However, the CHCA matrix yielded abundant background noise in comparison to the AuNP film (Figure 4c), and S/N ratios for many peaks were lower using CHCA, possibly due to LDI suppression of target analytes by matrix ions. This is clearly shown in the higher relative intensities of C6, C7, and C10 peaks at 965, 1169, and 1634 m/z, respectively, in the calcinated AuNP spectrum. Intact cytochrome c was also detectable on the calcinated AuNP film (Figure S5 in the Supporting Information), showing that the calcinated nanofilm of AuNPs enables mass spectrometric measurement of a reasonably large mass range of substrates, from peptides to small proteins, and is thus applicable to broad analysis beyond only small molecules.
Using the AuNP film fabricated by LbL self-assembly and calcination, we have demonstrated a multifunctional surface that is compatible with several important analytical methods. The intended properties of a monolayer of AuNPs, dense packing structure, and calcinated silicate coating were each realized, and they have contributed to the dual-mode sensing functionality of LSPR and SALDI-MS. Furthermore, the LbL process allows for these properties to be easily tailored in a consistent and reproducible fashion. These results clearly demonstrate the potential of a unique nanofilm substrate on which multiple, in situ measurements are possible and thus an array of complementary information, quantitative and structural, is obtainable. Given that LSPR is a label-free technique, the combined function of multiple detections may lead to highly efficient bioassays that rely on orthogonal methods using the same sample on the same chip, vastly decreasing time and cost in the characterization of biological systems and environmental samples.
Acknowledgments
The authors thank Dr. David Carter from UCR Institute for Integrative Genome Biology for his assistance with the CLSM. We acknowledge support from the National Science Foundation (CHE-1059050 and CHE-1413449). S.S.H. was supported by an NRSA T32 training grant (T32 ES018827).
Supporting Information Available
Experimental methods, supplementary figures. This material is available free of charge via the Internet at http://pubs.acs.org.
Author Contributions
† C.-Y.C. and S.S.H. contributed equally as first authors.
The authors declare no competing financial interest.
Funding Statement
National Institutes of Health, United States
Supplementary Material
References
- Turner A. P. F. Science 2000, 290, 1315–1317. [DOI] [PubMed] [Google Scholar]
- Willets K. A.; Van Duyne R. P. Annu. Rev. Phys. Chem. 2007, 58, 267–297. [DOI] [PubMed] [Google Scholar]
- Anker J. N.; Hall W. P.; Lyandres O.; Shah N. C.; Zhao J.; Van Duyne R. P. Nat. Mater. 2008, 7, 442–453. [DOI] [PubMed] [Google Scholar]
- Sepulveda B.; Angelome P. C.; Lechuga L. M.; Liz-Marzan L. M. Nano Today 2009, 4, 244–251. [Google Scholar]
- Gunnarsson L.; Rindzevicius T.; Prikulis J.; Kasemo B.; Kall M.; Zou S. L.; Schatz G. C. J. Phys. Chem. B 2005, 109, 1079–1087. [DOI] [PubMed] [Google Scholar]
- Ebbesen T. W.; Lezec H. J.; Ghaemi H. F.; Thio T.; Wolff P. A. Nature 1998, 391, 667–669. [Google Scholar]
- Hulteen J. C.; Vanduyne R. P. J. Vac. Sci. Technol., A 1995, 13, 1553–1558. [Google Scholar]
- Fredriksson H.; Alaverdyan Y.; Dmitriev A.; Langhammer C.; Sutherland D. S.; Zaech M.; Kasemo B. Adv. Mater. 2007, 19, 4297–4302. [Google Scholar]
- Dahlin A. B.; Jonsson M. P.; Hook F. Adv. Mater. 2008, 20, 1436–1442. [Google Scholar]
- Brust M.; Bethell D.; Kiely C. J.; Schiffrin D. J. Langmuir 1998, 14, 5425–5429. [Google Scholar]
- Mayya K. S.; Schoeler B.; Caruso F. Adv. Funct. Mater. 2003, 13, 183–188. [Google Scholar]
- Decher G. Science 1997, 277, 1232–1237. [Google Scholar]
- Stigter E. C. A.; de Jong G. J.; van Bennekom W. P. TrAC, Trends Anal. Chem. 2013, 45, 107–120. [Google Scholar]
- McLean J. A.; Stumpo K. A.; Russell D. H. J. Am. Chem. Soc. 2005, 127, 5304–5305. [DOI] [PubMed] [Google Scholar]
- Kawasaki H.; Sugitani T.; Watanabe T.; Yonezawa T.; Moriwaki H.; Arakawa R. Anal. Chem. 2008, 80, 7524–7533. [DOI] [PubMed] [Google Scholar]
- Nayak R.; Knapp D. R. Anal. Chem. 2010, 82, 7772–7778. [DOI] [PMC free article] [PubMed] [Google Scholar]
- Pilolli R.; Ditaranto N.; Di Franco C.; Palmisano F.; Cioffi N. Anal. Bioanal. Chem. 2012, 404, 1703–1711. [DOI] [PubMed] [Google Scholar]
- Phillips K. S.; Han J. H.; Martinez M.; Wang Z. Z.; Carter D.; Cheng Q. Anal. Chem. 2006, 78, 596–603. [DOI] [PubMed] [Google Scholar]
- Duan J.; Linman M. J.; Cheng Q. Anal. Chem. 2010, 82, 5088–5094. [DOI] [PMC free article] [PubMed] [Google Scholar]
- Chen Y.; Vertes A. Anal. Chem. 2006, 78, 5835–5844. [DOI] [PubMed] [Google Scholar]
- Schneider G.; Decher G. Langmuir 2008, 24, 1778–1789. [DOI] [PubMed] [Google Scholar]
- Stiles P. L.; Dieringer J. A.; Shah N. C.; Van Duyne R. P. Annu. Rev. Anal. Chem. 2008, 1, 601–626. [DOI] [PubMed] [Google Scholar]
- Inuta M.; Arakawa R.; Kawasaki H. Analyst 2011, 136, 1167–1176. [DOI] [PubMed] [Google Scholar]
- Raschke G.; Kowarik S.; Franzl T.; Sönnichsen C.; Klar T. A.; Feldmann J.; Nichtl A.; Kürzinger K. Nano Lett. 2003, 3, 935–938. [Google Scholar]
- Groves J. T.; Ulman N.; Boxer S. G. Science 1997, 275, 651–653. [DOI] [PubMed] [Google Scholar]
- Groves J. T.; Ulman N.; Cremer P. S.; Boxer S. G. Langmuir 1998, 14, 3347–3350. [Google Scholar]
- Han J. H.; Taylor J. D.; Phillips K. S.; Wang X.; Feng P.; Cheng Q. Langmuir 2008, 24, 8127–8133. [DOI] [PubMed] [Google Scholar]
- Phillips K. S.; Cheng Q. Anal. Chem. 2005, 77, 327–334. [DOI] [PubMed] [Google Scholar]
- Stelzle M.; Miehlich R.; Sackmann E. Biophys. J. 1992, 63, 1346–1354. [DOI] [PMC free article] [PubMed] [Google Scholar]
- Arakawa R.; Kawasaki H. Anal. Sci. 2010, 26, 1229–1240. [DOI] [PubMed] [Google Scholar]
Associated Data
This section collects any data citations, data availability statements, or supplementary materials included in this article.


