Abstract
We have developed a self-reporting isothermal system for visual bacterial pathogen detection with single base resolution. The new DNA diagnostic is based on combination of peptide nucleic acid (PNA) technology, rolling circle amplification (RCA) and DNAzymes. PNAs are used as exceedingly selective chemical tools that bind genomic DNA at a predetermined sequence under nondenaturing conditions. After assembly of the PNA-DNA construct a padlock probe is circularized on the free strand. The probe incorporates a G-quadruplex structure flanked by nicking enzyme recognition sites. The assembled circle serves as a template for a novel hybrid RCA strategy that allows for exponential amplification and production of short single-stranded DNA pieces. These DNA fragments fold into G-quadruplex structures and when complexed with hemin become functional DNAzymes. The catalytic activity of each DNAzyme unit leads to colorimetric detection and provides the second amplification step. The combination of PNA, RCA, and DNAzymes allows for sequence-specific and highly sensitive detection of bacteria with a colorimetric output observed with the naked eye. Herein, we apply this method for the discrimination of Escherichia coli, Salmonella typhimurium, and Clostridium difficile genomes.
Sensitive and sequence-specific DNA detection has become increasingly important in biological studies, clinical diagnostics, and biodefense applications. Although low-cost and field-ready PCR devices are being developed, the use of fluorescent dyes and a thermo-cycling apparatus remains cost prohibitive in resource-poor settings. Therefore, isothermal amplification techniques and fluorescent-free detection methods are urgently required.1 Here, we report a pathogen diagnostic method that can be used to visually discriminate bacterial genomic DNA under isothermal conditions.
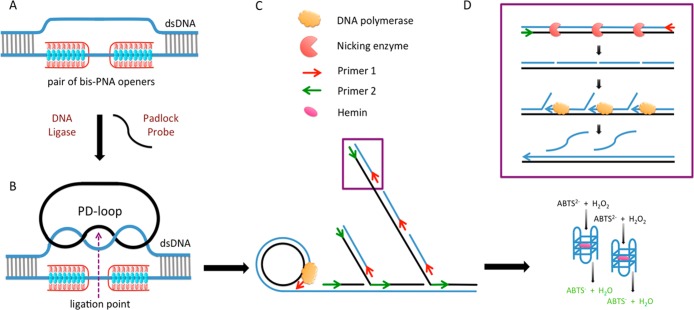
The first step in our method is the sequence-specific recognition of the target sites within the bacterial genome using peptide nucleic acids. PNAs belong to a group of nucleic acid mimics that consist of nucleobases attached to a polyamide backbone.2−4 Cationic pyrimidine bis-PNAs can be used to sequence-specifically bind to one strand of the DNA duplex, leaving the other strand free for probe hybridization.5 Two ends of a linear padlock probe are then ligated on the displaced strand forming a PD-loop (see Figure 1).4,6,7 The ligation reaction is extremely sequence specific and can discriminate single mutations if they are located close to the ligation point. The PD-loop formation is limited to the preselected 20–30-bp-long target site within dsDNA and is normally unique in the entire genome.8−11 A significant advantage of PNA-based padlock probe design is that the rest of the DNA retains its duplex structure and is inaccessible for probe binding, which greatly reduces background noise. The assembled circular probe serves as a template for rolling circle amplification.12
Figure 1.
Scheme of the bacterial DNA detection method. (A) A pair of bis-PNA openers binds to one strand of bacterial pathogen DNA, leaving the other strand free for padlock probe hybridization. (B) PD-loop formation is limited to the preselected 20–30 bp target site. (C) Hyperbranched RCA allows for exponential signal amplification. (D) The product is double-stranded, so a nicking enzyme is used to create a gap in one of the strands and the nicked pieces are subsequently displaced by primer extension. This process causes an accumulation of ss-DNA pieces that fold into G-quadruplex structures.
Our group has previously applied the combination of PNAs, linear RCA, and fluorescence in situ hybridization (FISH) for bacterial identification in clinical and environmental samples.9 RCA was performed in the presence of fluorescently labeled decorators and the fluorescent product was detected by microscopy techniques. In a follow-up study, this method was successfully used to detect Staphylococcus aureus and to discriminate between methicillin sensitive (MSSA) and methicillin resistant (MRSA) strains.11 In both cases, a fluorescently labeled probe and microscope were necessary to visualize the detection. In the present Article, we employ the DNAzyme assay to make possible a visual detection output. DNAzymes are nucleic acid structures that have the unique ability to mimic the functions of enzymes and catalyze certain chemical reactions.13−16 There are several advantages to using DNAzymes over traditional protein enzymes; they are inexpensive, easy to prepare and modify, and have high chemical and thermal stability.17
Previously, linear RCA has been employed to create a sequence of tethered G-quadruplexes to detect 1pM of a single-stranded analyte.18 The Willner group applied this method to identify the M13 phage single-stranded DNA sequence.19 To the best of our knowledge, this approach has never been employed for the detection of double-stranded bacterial DNA. Here, we report the first successful workflow starting with actual genomic DNA to visually detect bacterial pathogens under isothermal conditions.
Similar to the prior studies we designed our RCA product to contain G-rich tracts that fold into G-quadruplex domains. In order to increase analytic sensitivity, we substituted linear RCA with hyperbranched RCA (HRCA). Similar to PCR, double-primed HRCA allows for exponential amplification of the target template. The reaction begins in the same way as linear RCA, where a strand-displacing polymerase elongates one primer to create a long, single-stranded product that contains tandem repeats complementary to the circular probe. In HRCA, a reverse primer is added to bind the complementary sequence. As the reverse primers are elongated they generate displaced DNA strands, which in turn initiate more priming events by the forward primer (Figure1C). As a result, exponential amplification is achieved. Performed at 65 °C, HRCA produces about 106 more copies of a specific circular template in a 90 min time frame compared to linear RCA.20 The products of HRCA are double-stranded repeats of the circular template with varying lengths. However, a G-quadruplex can only fold from single-stranded DNA, so an additional step is required to ensure that DNAzymes can form.
To exponentially generate single-stranded products, we developed a novel hybrid HRCA technique by introducing a nicking enzyme into the traditional system. The circular template is designed with three recognition sites for a nicking enzyme, which cuts the complementary strand with the G-rich tracts. Two G-tracts are encoded per circular template, so the nicks in the complementary strand result in two DNAzymes and one nonreactive DNA piece. During HRCA, multiple nicking events create new starting points for replication. In contrast to traditional HRCA that stops once all products become double-stranded, in our design the amplification continuously restarts because the nicking enzyme creates additional sites for strand displacement reactions. We called the new signal amplification strategy exponential-linear RCA (ELRCA) because exponential amplification and accumulation of short linear DNA fragments is achieved. In our case, the nicking and displacement reactions create short single-stranded G-rich sequences that fold into G-quadruplex structures (Figure 1D). Upon addition of hemin, these G-quadruplexes become functional DNAzymes that can facilitate the oxidation of 2,2′-azino-bis(3-ethyl-benzthiazoline)-6-sulfonic acid (ABTS) by H2O2.21−23
Nicking endonuclease-assisted RCA (NRCA) has attracted intense interest lately because of its great detection capacity.24−27 Originally applied to molecular beacon systems, NRCA is an efficient way to improve sensitivity in DNA detection. In typical NRCA design, the nicking site is inserted in the circular template and yields many copies of products by multiple nicking-displacement reactions. Also, the group of Komiyama developed a primer generation-rolling circle amplification (PG-RCA) technique. In these schemes, a nicking enzyme is used with linear RCA (LRCA), so only primer extension and nicking reactions, without branched strand displacement, are integrated.28
Our ELRCA design has the advantage of exponential amplification and the production of thousands of repeated sequences under isothermal conditions with high efficiency and specificity. Here, we describe this technology in detail and demonstrate its use for the detection and discrimination of Escherichia coli, Clostridium difficile, and Salmonella.
Experimental Section
Bacterial Culture and Genomic DNA Preparation
In this study, the following strains were used: Clostridium difficile strain 630 (BAA-1382, ATCC), Bacillus subtilis (AG174, ATCC), Salmonella typhimurium LT2 (700720, ATCC), Escherichia coli (O157:H7) (700927, ATCC), and E. coli K-12. They were cultured overnight at 37 °C in LB medium. Genomic DNA was isolated using Sigma GenElute Bacterial Genomic DNA Kit (NA2110) according to manufacturer’s protocol. The DNA was precipitated with 100% ethanol and 3 M NaOAc, washed 5 times with 70% ethanol to remove excess salt, and resuspended in 10 mM sodium phosphate buffer (pH 6.9).
PD-Loop Site Selection
The PD-loop sites were selected using bacterial genome sequences available from the Genomes Database. Signature sites with different linker sequences between PNA binding sites were selected (Table 1). Specifically, we searched for sites RkNnRl (where R is a purine base and N is any base) choosing k and l between 7 and 8 and n between 2 and 10. PNA oligomers used in the project were purchased from PANAGENE or were from the laboratory collection. These PNAs recognize 6- to 10-bp-long sites on DNA. All PD-loop sites were checked with BLAST (http://www.ncbi.nlm.nih.gov/blast/) to select those sites that are unique to the target pathogen.
Table 1. Bacterial Target Sequences.
| target bacteria | gene and target site[ | PNA openers | padlock probe[b] | primers |
|---|---|---|---|---|
| E. coli | RNA polymerase factor sigma-54 AAAGAAGATGTGCTGAAAGAAG | PNA 1 H-Lys2-CTTCTTT-(eg1)3-TTTJTTJ-Lys-NH2 | 5′/5Phos/GCTGAAAGAAGCAGCCAGCAGCAATGCCCAACCCGCCCTACCCGCAATGCCCAACCCGCCCACCCGCAATGGAAAGAAGATGT3′ | forward 1: 5′-CAT TGC TGC TGG CTG CTT C-3′ |
| B. subtillis mismatch site AAAGAAGATGTACTAAAAGAAG | reverse 1: 5′-TGG AAA GAA GAT GTG CTG AAA GAA G-3′ | |||
| E. coli 0157:H7 | FImbrial protein AGAGAGAAATGCTGAAGGGGA | PNA 2 H-Lys2-CTTCCCCT-(eg1)3-TJJJJTTJ- | 5′/5Phos/CTGAAGGGGA shyCAGCCAGCAGCAATGAACCCAACCCGCCCTACCCAACGAAGAGCAATGAGCACCCAACCCGCCCTACCCGCAATGAG AGA GAA ATG-3′ | forward 2: 5′-GGT TCA TTG CTG CTG GCT G-3′ reverse 2: 5′-AAC GAA GAG CAA TGA GCA CC-3′ |
| PNA 3 Lys-NH2 H-Lys2-CTCTCTTT-(eg1)3-JTJTJTTT-Lys-NH2 | ||||
| S. typhimurium | FKBP-type 22KD peptidyl-prolyl cis–trans isomerase GGAAGAAAACCGCGAAAAAGA | PNA 4 H-Lys2-CCTTCTTT-(eg1)3-TTTJTTJJ-Lys-NH2 | 5′/5Phos/GCGAAAAAGACAGCCAGCAGCAATGAACCCAACCCGCCCTACCCAACGAAGAGCAATGAGCACCCAACCCGCCCTACCCGCAATGGGAAGAAAACC3′ | |
| PNA 5 H-Lys2-TCTTTTTC-(eg1)3-JTTTTTJT-Lys-NH2 | ||||
| C. difficile | flagellar export protein AAGGGAAATTGCAAAGGGAAA | PNA 6 H-Lys2-TTTCCCTT-(eg1)3-TTJJJTTT-Lys-NH2 | 5′/5Phos/CAAAGGGAAACAGCCAGCAGCAATGAACCCAACCCGCCCTACCCAACGAAGAGCAATGAGCACCCAACCCGCCCTACCCGCAATGAAGGGAAATTG3′ | |
| S. sonnei | putative bacteriophage protein AAAAGAAAAGCGTGCAAAAGAAA | PNA 7 H-Lys2 - TTTTCTTT-(eg1)3-TTTJTTTT-Lys-NH2 | 5′/5Phos/TGCAAAAGAAACAGCCAGCAGCAATGAACCCAACCCGCCCTACCCAACGAAGAGCAATGAGCACCCAACCCGCCCTACCCGCAATGAAAA GAAAAGCG-3′ |
PNA Invasion and Padlock Probe Ligation
The bis-PNAs used in this study are listed in Table 1. PNA invasion was performed in 10 mM sodium phosphate buffer (pH 6.9) with 2 μM of each PNA and a total volume of 25 μL. The mixture was incubated at 45 °C for 4 h. Each ODN is designed so that its RCA product can fold into a G-quadruplex structure. For ODN ligation, the following reagents were added after PNA invasion: 0.5× T4 DNA Ligase buffer (obtained from New England Biolabs), 2.5 μM of ODN, 1 mM ATP, and 10 units T4 DNA Ligase (obtained from New England Biolabs). The ligation was performed for 2 h at 30 °C. The mixture was then heated to 65 °C to deactivate the ligase.
DNAzyme Aptamer Optimization
We tested four DNAzyme structures PW17, PW17stem, PS5M (all intramolecular G-quadruplexes), and Agro100 (intermolecular G-quadruplex). PW17 and PW17stem gave us the highest detection signal (Supporting Information Figure S1), so we used PW17 in all subsequent experiments.
Linear RCA (LRCA)
Linear RCA was performed in a 20 μL solution that contained the target circular template, 1× Phi29 DNA polymerase buffer, 1 mM dNTP mix, 0.2 mg/mL purified BSA, 1 μM primer, and 5 units of Phi29 DNA polymerase. The reaction mixture was incubated at 37 °C for eight different time points: 0, 10, 30, 90, 180, 240, 300, and 360 min.
Exponential Linear Rolling Circle Amplification (ELRCA)
The ELRCA reaction was prepared by combining the target circular DNA with 8 units of Bst2.0 DNA Polymerase (obtained from New England Biolabs), 1× Isothermal Amplification Buffer (obtained from New England Biolabs), 1 mM dNTPs, 1 μM of each primer. Amplification was initiated by heating this mixture to 65 °C. After 5 min of RCA, 10 units of Nb.BsrDI were added to the reaction. This mixture was incubated at 65 °C for 4 h.
Colorimetric Detection
To form DNAzyme units 20 μL of the amplification product was combined with an equal volume of 1 μM hemin in the following buffer: 0.1 M Tris-HCl, 20 mM MgCl2, and 0.05% Triton X-100. The mixture was incubated at room temperature for 1 h and transferred to a microplate. ABTS was dissolved in 0.05 M phosphate-citrate buffer at 1 mg/mL, pH 5.0, and 160 μL of this mixture was added to the amplicon and hemin. The DNAzyme units facilitate the oxidation of ABTS, the product of which is green. This causes a color change of the reaction solution and the detection output was quantified by absorbance measurements at 412 nm using SpectraMax M5 spectrophotometer.
Time Dependence Assay
A synthetic target template was used to ligate the ODN probe and evaluate ELRCA time dependence. The ELRCA reaction was performed with 100pM of the circular template, 8 units of Bst2.0 DNA Polymerase (obtained from New England Biolabs), 1× Isothermal Amplification Buffer (obtained from New England Biolabs), 1 mM dNTPs, and 1 μM of each primer.
Limit of Detection Assay
A synthetic target template was used to ligate the ODN probe and evaluate the limit of detection. The circular template was serially diluted to concentrations ranging from 100pM down to 1fM. Exponential linear RCA was performed as previously described for 4 h. The nonligated ODN probe was used as a negative control. After incubation with hemin and addition of ABTS the absorbance of the reaction solution was measured every 30 s for a total of 30 min.
Results and Discussion
Selection of Nicking Endonuclease
Several nicking endonuclease were evaluated for this detection method (see Supporting Information Figure S2 and Table S1). The nicking enzyme Nb.BsrDI was selected because it displayed the highest signal-to-noise ratio. We designed our padlock probe to contain three Nb.BsrDI recognition sites in order to create two DNAzymes per circle. Nb.BsrDI creates single-stranded nicks on the double-stranded product between DNAzyme units that are simultaneously displaced by DNA polymerase. The nicking step separates the G-quadruplex domains and facilitates proper DNAzyme folding.
LRCA versus ELRCA Reaction Kinetics
Since the amplification efficiency is the most important characteristic, we compared ELRCA reaction kinetics with those of linear RCA over a 6 h time course. Figure 2A shows the development of colorimetric signal over time for both amplification methods. Certainly, the result of this analysis may not reflect actual amplification efficiency, since only properly folded DNAzymes yield the color-changing output (quantified by absorbance). Nevertheless, we observed an exponential increase of absorbance with respect to ELRCA time course. As expected, linear RCA demonstrates a linear increase in absorbance over time.
Figure 2.
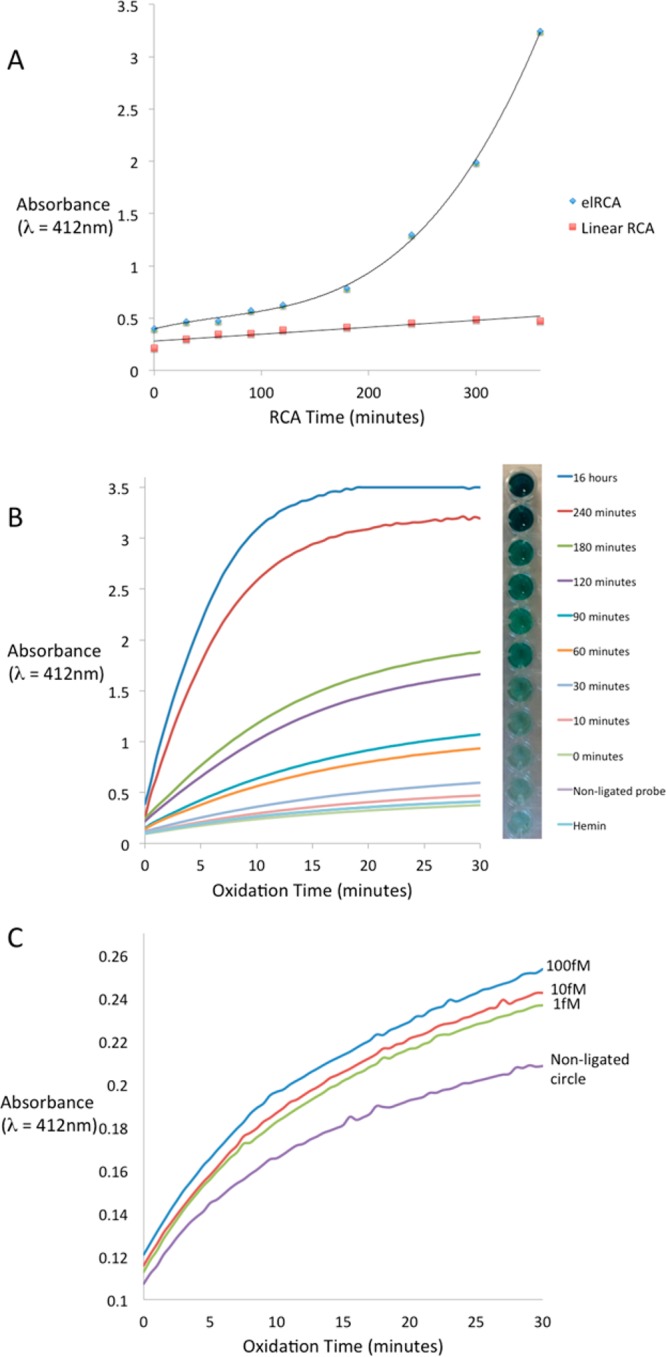
(A) Comparison of detection kinetics using exponential-linear RCA versus linear RCA with 10pM target concentration. (B) Hyperbranched RCA time dependence. Several hRCA durations were compared in order to select the optimum duration for our detection protocol. The two negative controls, nonligated RCA probe (NL) and hemin alone, represent the background noise in our detection. Although the detection output (measured in absorbance at 412 nm) increased with RCA duration, we found that there was a limited increase in detection signal after 4 h of RCA. (C) hRCA LOD. The LOD was determined by measuring the detection output with different starting concentrations of target DNA (100, 10, and 1 fM). Nonligated RCA probe (NL) was used to measure the background noise.
ELRCA Optimization
We tested several ELRCA time spans ranging from 10 min to 16 h and found that the detection signal increases significantly up to 4 h of ELRCA (Figure 2B). The difference in detection signal between 4 and 16 h of ELRCA was not significant, which suggests that the buildup of product does eventually cause signal saturation. That could be explained by multiple reasons, one of which is improper DNA product folding. With time, the single-stranded DNA amplification products get longer and formation of random structures becomes more likely. It is also possible that the breakdown of H2O2, as well as ABTS during the oxidation reaction may contribute to slowing down the reaction after 4 h of RCA. Finally, all amplification reactions have a tendency to reach a plateau phase because of substrate depletion, production inhibition or loss of enzyme activity. In our case, a consequence of such an extensive amplification is the production of high amounts of ssDNA and pyrophosphate. These two factors are known to inhibit polymerases. As a result, we concluded that the optimal amplification time is between 30 and 240 min.
Since there are two enzymes involved in this system we evaluated several time-delays for the addition of Nb.BsrDI after the start of amplification (ranging from 0 min to 3 h). We found that adding the nicking enzyme 5 min after initiation of RCA gave us a significantly higher detection signal compared with the other settings (see Supporting Information Figure S3). Under these optimized conditions we performed serial dilution experiments to determine the limit of detection (LOD) of our assay. We were able to differentiate as little as 1fM target DNA concentration from our negative control (nonligated circle) (Figure 2C). With a sample volume of 200 μL this corresponds to the detection of about 105 pathogen molecules, which is within the expected number of organisms/mL (103 to 109) in stool samples of patients with enteric infections.29−32 For in-field conditions, a phone or digital camera can be used for unbiased detection. This analytical sensitivity provides a reasonable basis to begin optimization for clinical diagnostics.
Sequence Selectivity
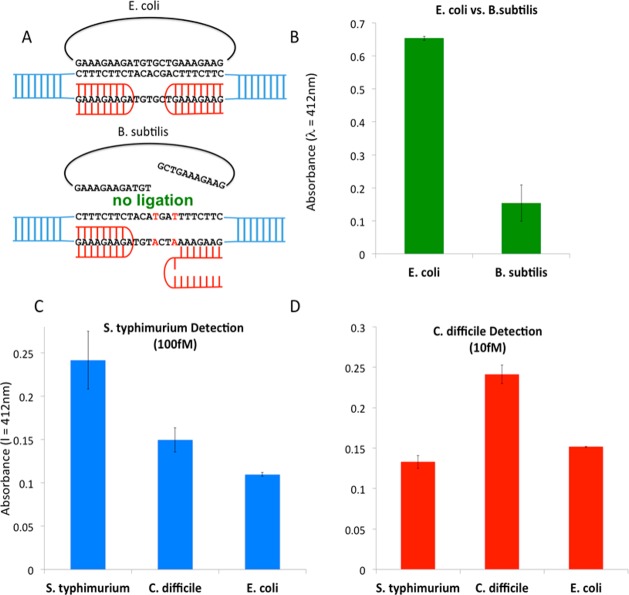
We validated our method by applying it to the detection of clinically relevant pathogens. Our previous studies provided strong evidence that the PD-loop design has a single-base selectivity.11,33,34 We first tested the sequence-specificity of this method on the target site within the RNA polymerase gene that differs between Escherichia coli and Bacillus subtillis genomes by only 2 nucleotides. We performed the entire assay on E. coli and B. subtilis genomic DNA using this target site. Figure 3A shows the structure of the PNA–DNA complex that allows ligation of the padlock. Because of the stringent strand-matching requirement for the ligation of the padlock probe, the mismatch in B. subtilis prohibits the PD-loop formation and RCA amplification. To determine the background noise from genomic DNA we performed the entire detection on E. coli DNA without adding PNAs. Without PNA invasion, bacterial DNA remains in its duplex form and all subsequent steps are prevented.
Figure 3.
Detection of bacterial genomic DNA. The optimized method was used to detect genomic DNA of E. coli, S. typhimurium, and C. difficile. (A, B) E. coli DNA is discriminated from B. subtilis DNA based on 2 mismatches in the target sequence. (C, D) S. typhimurium-specific (C) and C. difficile-specific (D) probes were applied to three bacteria: S. typhimurium, C. difficile, and E. coli. Data represent mean ±1 standard deviation from at least three experiments (*p < 0.005).
We successfully discriminated E. coli from B. subtillis, confirming the high sequence-specificity of our assay (Figure 3B). Next, we performed the discrimination of various bacteria using reference strains of enteric pathogens. We chose pathogen-specific target sites located in the following genes: FKBP isomerase for Salmonella typhimurium and flagellar export protein for Clostridium difficile (Table 1). When detecting S. typhimurium we found that we were able to detect as little as 100fM target DNA concentration (Figure 3C), while detection of C. difficile was achieved down to 10fM concentrations (Figure 3D). The difference in LOD for different target species is likely due to the quality of the purified DNA.
While DNA recovery from stool samples is known to be less that 100% efficient many groups have shown that various commercially available DNA purification kits work well for obtaining DNA from stool samples for PCR-based detection.35,36 Therefore, we are confident that the DNA extraction efficiency of commercial kits is sufficient for our assay.
Sensitivity and Specificity
Finally, to determine the sensitivity and specificity of this assay we conducted experimenter-blinded tests using 35 deidentified, codified samples contained E. coli 0157:H7 and S. typhimurium LT2 (15 of each), as well as 5 samples with human genomic DNA that were negative for bacteria. Each sample was tested with probes specific for E. coli (E), S. typhimurium (S), and Shigella flexneri (H). The fraction of bacteria that were correctly/incorrectly identified as well as three representative results are shown in Table 2.
Table 2. Method Validation on Pathogen DNA Samples.
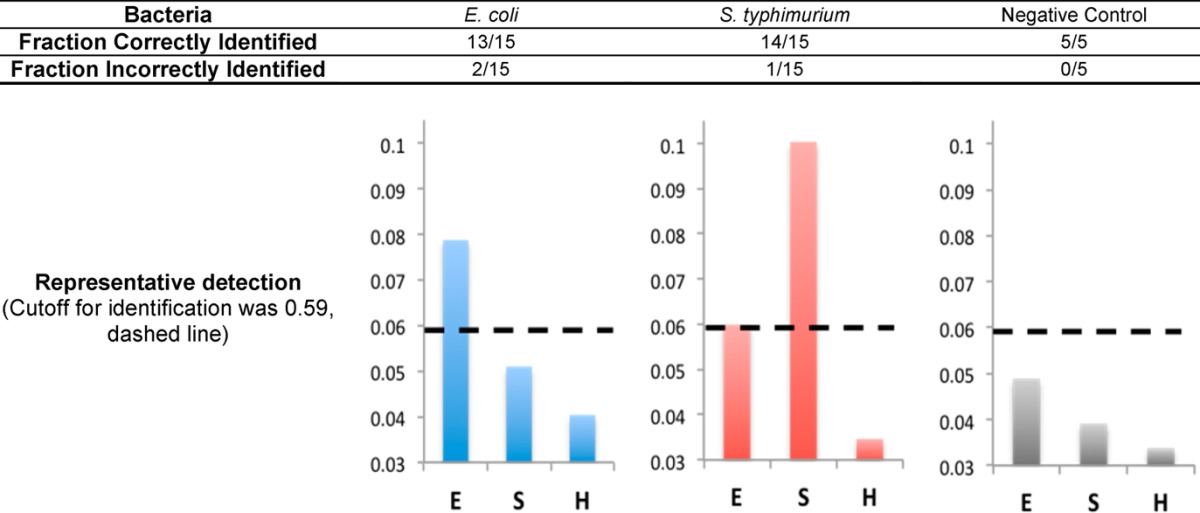
To determine the cutoff for positive pathogen identification the background intensity was measured from human genomic DNA in the presence of nonligated circle. From these measurements, a cutoff for positive identification was defined as the average of the negative control plus three negative control standard deviations (dashed line at 0.59 in Table 2). We were able to correctly identify 13/15 samples with E. coli 0157:H7 and 14/15 samples with S. typhimurium. Two of the E. coli samples were incorrectly identified as S. typhimurium, and one S. typhimurium sample was identified as E. coli. From these experiments, we were able to calculate the sensitivity and specificity of our detection method, 87%/93% for pathogenic E. coli and 93%/90% for Salmonella, which are comparable to the currently used PCR-luminex assay.31
Conclusion
The detection of ultralow concentrations of nucleic acids such as microRNAs, pathogenic DNAs, and mutations in cancer requires high levels of amplification. Isothermal nucleic acid amplification technologies offer significant advantages over PCR because they do not require thermal cycling or sophisticated laboratory equipment. Here, we describe the diagnostic method that can discriminate bacterial pathogens with single-base sequence specificity. PNA openers are inherently less prone to inhibition compounds in clinical samples, so we expect that our approach will not require a complicated DNA purification protocol and can be directly applied to cell lysate. The entire detection is performed under isothermal conditions and provides a colorimetric output, which minimizes the need for instrumentation. The exponential nature of ELRCA shows high amplification efficiency without sacrificing the specificity. The limit of detection is suitable for point-of-care diagnostics of enteric infections, so the approach can be applied for the development of a user-friendly diagnostic of bacterial pathogens in resource-limited areas. In conclusion we would like to emphasize that we have developed a new generation of RCA with single-stranded final product, which means that it is readily available for sensitive and real-time fluorescent detection.
Acknowledgments
This work was supported by the National Institutes of Health [1R21AI100180-01 to I.S.]. We thank Professors Natalia Broude and Maxim Frank-Kamenetskii for critical reading and valuable comments on the manuscript.
Supporting Information Available
Supplementary data and figures. This material is available free of charge via the Internet at http://pubs.acs.org.
The authors declare no competing financial interest.
Funding Statement
National Institutes of Health, United States
Supplementary Material
References
- Rodrigues Ribeiro Teles F. S.; Pires de Tavora Tavira L. A.; Pina da Fonseca L. J. Crit. Rev. Clin. Lab. Sci. 2010, 47, 139–169. [DOI] [PubMed] [Google Scholar]
- Nielsen P. E.; Egholm M.; Berg R. H.; Buchardt O. Science 1991, 254, 1497–1500. [DOI] [PubMed] [Google Scholar]
- Uhlmann E.; Peyman A.; Breipohl G.; Will D. W. Angew. Chem. Int. Edit 1998, 37, 2797–2823. [DOI] [PubMed] [Google Scholar]
- Demidov V. V.; Frank-Kamenetskii M. D. Trends Biochem. Sci. 2004, 29, 62–71. [DOI] [PubMed] [Google Scholar]
- Kuhn H.; Demidov V. V.; Frank-Kamenetskii M. D. Angew. Chem., Int. Ed. 1999, 38, 1446–1449. [DOI] [PubMed] [Google Scholar]
- Bukanov N. O.; Demidov V. V.; Nielsen P. E.; Frank-Kamenetskii M. D. Proc. Natl. Acad. Sci. U.S.A. 1998, 95, 5516–5520. [DOI] [PMC free article] [PubMed] [Google Scholar]
- Demidov V. V., Bukanov N. O., Frank-Kamenetskii M. D. In Peptide Nucleic Acids: Protocols and Applications; Nielsen P. E., Ed.; Horizen Scientific: Wymondham, Norfolk, U.K., 1999; p 266. [Google Scholar]
- Kuhn H.; Demidov V. V.; Frank-Kamenetskii M. D. J. Biomol. Struct. Dyn. 2000, 17, 221–225. [DOI] [PubMed] [Google Scholar]
- Smolina I.; Lee C.; Frank-Kamenetskii M. Appl. Environ. Microbiol. 2007, 73, 2324–2328. [DOI] [PMC free article] [PubMed] [Google Scholar]
- Smolina I. V.; Kuhn H.; Lee C.; Frank-Kamenetskii M. D. Bioorg. Med. Chem. 2008, 16, 84–93. [DOI] [PubMed] [Google Scholar]
- Smolina I.; Miller N. S.; Frank-Kamenetskii M. D. Artif. DNA: PNA XNA 2010, 1, 76–82. [DOI] [PMC free article] [PubMed] [Google Scholar]
- Smolina I. V.; Frank-Kamenetskii M. D. Methods Mol. Biol. 2014, 1050, 121–130. [DOI] [PubMed] [Google Scholar]
- Burmeister J.; vonKiedrowski G.; Ellington A. D. Angew. Chem., Int. Ed. Engl. 1997, 36, 1321–1324. [Google Scholar]
- Carmi N.; Balkhi S. R.; Breaker R. R. Proc. Natl. Acad. Sci. U.S.A. 1998, 95, 2233–2237. [DOI] [PMC free article] [PubMed] [Google Scholar]
- Li Y.; Sen D. Nat. Struct. Biol. 1996, 3, 743–747. [DOI] [PubMed] [Google Scholar]
- Sheppard T. L.; Ordoukhanian P.; Joyce G. F. Proc. Natl. Acad. Sci. U.S.A. 2000, 97, 7802–7807. [DOI] [PMC free article] [PubMed] [Google Scholar]
- Breaker R. R. Science 2000, 290, 2095–2096. [DOI] [PubMed] [Google Scholar]
- Tian Y.; He Y.; Mao C. ChemBioChem 2006, 7, 1862–1864. [DOI] [PubMed] [Google Scholar]
- Cheglakov Z.; Weizmann Y.; Basnar B.; Willner I. Org. Biomol Chem. 2007, 5, 223–225. [DOI] [PubMed] [Google Scholar]
- Lizardi P. M.; Huang X.; Zhu Z.; Bray-Ward P.; Thomas D. C.; Ward D. C. Nat. Genet. 1998, 19, 225–232. [DOI] [PubMed] [Google Scholar]
- Ali M. M.; Aguirre S. D.; Lazim H.; Li Y. Angew. Chem., Int. Ed. Engl. 2011, 50, 3751–3754. [DOI] [PubMed] [Google Scholar]
- Koster D. M.; Haselbach D.; Lehrach H.; Seitz H. Mol. BioSyst. 2011, 7, 2882–2889. [DOI] [PubMed] [Google Scholar]
- Bi S.; Li L.; Zhang S. Anal. Chem. 2010, 82, 9447–9454. [DOI] [PubMed] [Google Scholar]
- Wang Q.; Yang C.; Xiang Y.; Yuan R.; Chai Y. Biosens. Bioelectron. 2014, 55, 266–271. [DOI] [PubMed] [Google Scholar]
- Zhuang J.; Lai W.; Chen G.; Tang D. Chem. Commun. 2014, 50, 2935–2938. [DOI] [PubMed] [Google Scholar]
- Dong H.; Wang C.; Xiong Y.; Lu H.; Ju H.; Zhang X. Biosens. Bioelectron. 2013, 41, 348–353. [DOI] [PubMed] [Google Scholar]
- Wen Y.; Xu Y.; Mao X.; Wei Y.; Song H.; Chen N.; Huang Q.; Fan C.; Li D. Anal. Chem. 2012, 84, 7664–7669. [DOI] [PubMed] [Google Scholar]
- Murakami T.; Sumaoka J.; Komiyama M. Nucleic Acids Res. 2009, 37, e19. [DOI] [PMC free article] [PubMed] [Google Scholar]
- Granato P. A.; Chen L.; Holiday I.; Rawling R. A.; Novak-Weekley S. M.; Quinlan T.; Musser K. A. J. Clin. Microbiol. 2010, 48, 4022–4027. [DOI] [PMC free article] [PubMed] [Google Scholar]
- Nelson E. J.; Harris J. B.; Morris J. G. Jr.; Calderwood S. B.; Camilli A. Nat. Rev. Microbiol. 2009, 7, 693–702. [DOI] [PMC free article] [PubMed] [Google Scholar]
- Liu J.; Gratz J.; Maro A.; Kumburu H.; Kibiki G.; Taniuchi M.; Howlader A. M.; Sobuz S. U.; Haque R.; Talukder K. A.; Qureshi S.; Zaidi A.; Haverstick D. M.; Houpt E. R. J. Clin. Microbiol. 2012, 50, 98–103. [DOI] [PMC free article] [PubMed] [Google Scholar]
- Chui L.; Lee M. C.; Malejczyk K.; Lim L.; Fok D.; Kwong P. J. Clin. Microbiol. 2011, 49, 4307–4310. [DOI] [PMC free article] [PubMed] [Google Scholar]
- Yaroslavsky A. I.; Smolina I. V. Chem. Biol. 2013, 20, 445–453. [DOI] [PMC free article] [PubMed] [Google Scholar]
- Konry T.; Lerner A.; Yarmush M. L.; Smolina I. V. Technology 2013, 01, 88–96. [DOI] [PMC free article] [PubMed] [Google Scholar]
- Persson S.; de Boer R. F.; Kooistra-Smid A. M.; Olsen K. E. Diagn. Microbiol. Infect. Dis. 2011, 69, 240–244. [DOI] [PubMed] [Google Scholar]
- Claassen S.; du Toit E.; Kaba M.; Moodley C.; Zar H. J.; Nicol M. P. J. Microbiol. Methods 2013, 94, 103–110. [DOI] [PMC free article] [PubMed] [Google Scholar]
Associated Data
This section collects any data citations, data availability statements, or supplementary materials included in this article.


