Abstract
New diagnostic methods are required to diagnose renal mass. Thus, we assessed virtual tissue quantification (VTQ) of acoustic radiation force impulse (ARFI) elastography in differentiation of renal solid masses. Forty-two patients with renal masses were assessed by VTQ in terms of measurement of the shear wave velocity (SWV). The masses were divided into three groups. They were clear cell carcinoma (CCC) angiomyolipoma (AML), and pseudotumor. The differences among the three groups in SWV, as well as between masses and its surrounding parenchyma, were investigated. Receiver operating characteristic (ROC) curve was plotted to evaluate the diagnostic performance. We found that the SWV among the three groups were significant different (F = 6.976, P = 0.003) and the SWV of pseudotumor (3.14 ± 0.75 m/s) was significantly higher than CCC (2.46 ± 0.45 m/s) and AML (2.49 ± 0.63 m/s) (P = 0.007 and 0.001 respectively). There were no significant difference between CCC and AML in SWV (P = 0.719). For each group, there was no significant difference between the mass and its surrounding parenchyma (P = 0.693, 0.892, and 0.714, respectively). Between pseudotumor and CCC, the optimal cut-off value of SWV for differential diagnoses was 3.07 m/s; and the area under the ROC curve (AUC) was 0.78 (95% CI: 0.560 to 0.924) (P = 0.004), the sensitivity and specificity were 100% and 58.3%, respectively. Between pseudotumor and AML, the optimal cut-off value of SWV for differential diagnoses was 3.03 m/s, thus AUC curve was 0.786 (95% CI: 0.591 to 0.918) (P = 0.002), the sensitivity and specificity were 100% and 58.3%, respectively. No significant difference was found between AML and CCC (P = 0.587) and the AUC was 0.562. To conclude, our results support that ARFI has potential value in differentiation between CCC and pseudotumor, or between AML and pseudotumor, however, it fails to make a distinction between CCC and AML.
Keywords: Acoustic radiation force impulse elastography, renal solid mass, ultrasound
Introduction
Renal solid masses are being discovered at increasing rates due to the wide accessibility of modern high resolution imaging procedures [1], however, some of them are still difficult to be differentiated by imaging alone, so that at least 43% patients underwent unnecessary radical nephrectomy for being diagnosed as malignance incorrectly [2]. Therefore, renal tumor biopsy was recommended to differentiate renal tumor [3]. Though complications such as hemorrhage were rare, whereas can not be avoided completely [4].
A new technology called acoustic radiation force impulse (ARFI) imaging is able to provide shear wave velocity (SWV) values to quantify the tumors’ elasticity. ARFI uses a short-duration acoustic radiation force with a fixed transmission frequency from probe to transiently deform tissues in the region of interest (ROI), resulting in shear-wave propagation away from it. The dynamic displacement response of tissues in ROI is tracked by US and expressed as SWV. The quantitative implementation of ARFI, known as virtual touch tissue quantification (VTQ), is used to measure SWV, so that the tissue’s mechanical properties can be estimated [5]. Generally, the stiffer tissues are, the greater is the SWV [6].
As a noninvasive, newly developed, inexpensive, safe and convenient technique, ARFI showed a sensitivity 71.87% and specificity 69.69% in assessment of renal parenchyma fibrosis [7] and showed advantage in differentiating between malignant and benign lesions in thyroid (sensitivity 71.87%, specificity 88.4%) [8] and liver (sensitivity 71.8%, specificity 75.0%) [9]. Therefore, it may have potential value in differentiating or characterizing renal masses. In order to prove this hypothesis, a prospective study was conducted.
Materials and methods
Patients
A total of 88 patients (38 women and 50 men; age range, 22-88 years; mean age 50.2 ± 38.2 years) from January 2013 to November 2013 underwent both US and VTQ examination from a total of 6346 consecutive adult patients in the single center of a university hospital. The 88 patients were recruited for the following inclusion criteria: (1) Patients were detected to have solid masses on conventional US. (2) Patients agreed to be underwent VTQ. Among them, 46 patients were excluded for the following reasons: (1) Maximum diameter of mass was smaller than sample ROI (10 mm×6 mm) (n = 4); (2) Mass was cystic or almost cystic (< 25% solid) (n = 2); (3) Mass was deeper than 8 cm ( n = 4); (4) Patients failed to cooperate with the VTQ measurement (n = 6); (5) Patients were diagnosed as end-stage renal disease (n = 1), which could influence the values of SWV; (6) Mass had not confirmed by pathologist or clinician (n = 29). Finally, a total of 42 patients were enrolled in this study. 33 patients of them had a single mass in each and the remaining 9 had multiple ones. For patients with multiple masses, the most suspicious one was selected to perform VTQ. When no nodules were suspicious, the largest one was selected. The details of the patient selection flowchart were shown in Figure 1.
Figure 1.
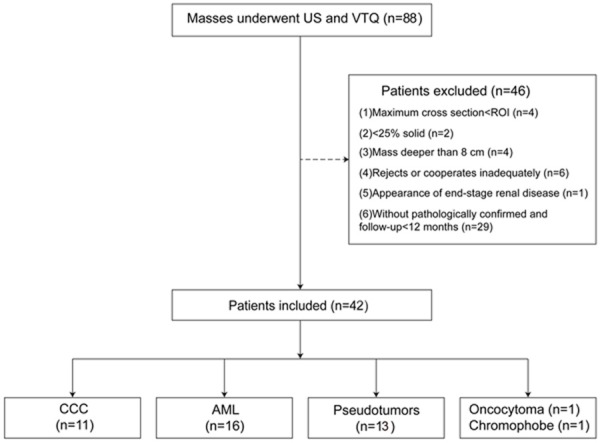
The flowchart of the patients’ selection. (US, ultrasound; VTQ, virtual tissue quantification; ROI, region of interest; CCC, clear cell carcinoma; AML, angiomyolipoma; n, number of patients).
The clinical investigation was conducted according to the principles expressed in the Declaration of Helsinki. This study was approved by the Ethical Committee of the Tenth People’s Hospital of Tongji University. Written informed consents and consents for publication of patient medical images were obtained from all patients.
VTQ elastography
All patients were examined using an Acuson S2000 ultrasound system (Siemens, Mountain View, CA, USA) equipping with the VTQ function. The convex probes (4 C1, frequency range: 1-4 MHz) and mechanical index of 1.7 were applied.
Patients were scanned in the prone position by a radiologist with a with 7 years’ experience in abdominal US and 2 years’ experience in renal ARFI. The transducer was applied with sufficient couplant to contact the skin completely. Moreover, the image settings such as gain, focus, zoom, and depth were constantly adjusted to obtain optimal images. Conventional transverse and longitudinal US images were obtained for each targeted mass. The maximum diameter and depth (from the ventral margin to skin) of mass were recorded for later analysis.
Subsequently, VTQ was performed to evaluate the elastic properties of masses on the long axis dimension by the same radiologist. The ROI cursor should be placed on the solid portion without any extra-mass tissues involved, usually at the center. When performing VTQ, the probe was placed on the body surface with light pressure. Patients were asked to hold their breath when VTQ was performed. When pressing the button labeled “Update”, the value of SWV was displayed on the screen automatically. The measurement was repeated at the same point for 7 times. The highest and the lowest values were eliminated and the rest 5 measurements were analyzed. To evaluating the elastic properties of surrounding parenchyma, the ROI was moved to the surrounding renal tissue at the same depth and the same procedure was repeated. Non-valid measurement (expressed as X. XX m/s) was occasionally encountered. When it occurred, a repeated measurement would be carried out instead.
Reference standard
In all 42 patients, 19 were diagnosed by pathologist with specimens obtained from biopsy and nephrectomy. Among them, 12 were diagnosed as RCC, with subtypes of CCC (n = 11) and chromophobe cell tumor (n = 1); 7 were diagnosed as benign tumors, with subtypes of AML (n = 6) and renal oncocytoma (n = 1).
The remaining 22 masses were diagnosed on the basis of clinical data. The clinical diagnosis was confirmed when following conditions were satisfied: (1) Typical imaging findings on contrast enhanced CT or MRI. (2) No change in imaging features during a follow-up at least one year. (3) Consensus of two experienced radiologists who were not involved in US examination and were specialized in kidney imaging after reviewing all the clinical data. As a result, the 23 masses were diagnosed as AML (n = 10), hypertrophied column of Bertin (n = 11), and duplex kidney (n = 2), respectively.
According to their diagnosis, the 42 patients were divided into three groups: Group 1, CCC (n = 11); Group 2, AML (n = 16); Group 3, because the “tumors” were all formed by anatomic variations of renal parenchyma, they were defined as pseudotumor (n = 13). Besides that, renal oncocytoma (n = 1) and chromophobe cell tumor (n = 1) would be discussed as single case separately.
Statistical analysis
The statistical analyses were carried out using SPSS20.0 software package (SPSS Inc, Chicago, IL). P < 0.05 was considered to be statistically significant. The differences of SWV among different masses were analyzed with one-way analysis of variance (ANOVA), followed by Least Significant Difference test (LSD) test. Receiver operating characteristics (ROC) curve and areas under curve (AUC) were used to estimate the diagnostic performance. The cut-off value was defined by considering the highest sum of sensitivity and specificity. Additionally, correlations between SWV and variables (age, depth, and maximum diameter) were analyzed with Spearman’s rank correlation coefficient in each group.
Results
The patients’ basic information and SWV of renal mass and its surrounding parenchyma were presented in Table 1.
Table 1.
Influencing factors and SWV measurements
| Group | Diagnosis | Age (yr)/gender | Diameter (mm) | Depth (mm) | Mass SWV (m/s) | Renal parenchyma SWV (m/s) |
|---|---|---|---|---|---|---|
| 1 | Clear cell carcinoma (n = 11) | 61.9 ± 7.0 (48-71)* male 7/female 4 | 45.0 ± 23.8 (13-93) | 5.07 ± 1.02 (4.1-7.6) | 2.46 ± 0.45 (1.74-3.03) | 2.23 ± 0.45 (1.50-3.11) |
| 2 | Angiomyolipoma (n = 16) | 51.5 ± 12.7 (28-67) male 7/female 10 | 23.5 ± 11.2 (13-45) | 4.82 ± 1.24 (3.2-7.2) | 2.49 ± 0.63 (1.78-3.07) | 2.24 ± 0.50 (1.41-3.02) |
| 3 | Pseudotumors (n = 13)# | 42.8 ± 15.6 (22-71) male 6/female 6 | 23.9 ± 12.8 (15-52) | 5.51 ± 1.17 (4.1-7.9) | 3.24 ± 0.75 (3.14-3.94) | 2.47 ± 0.60 (1.51-3.15) |
| / | Oncocytoma (n = 1)/Chromophobe (n = 1) | 61, female | 29 | 70 | 1.60 | 2.97 |
| 55, male | 47 | 66 | 2.20 | 2.66 |
The data in brackets are the ranges of measurement data.
Pseudotumors include hypertrophied column of Bertin (n = 11) and duplex kidney (n = 2).
Values of SWV of each group
Significant differences of SWV among the three Groups (F = 6.976, P = 0.003) were revealed. Multiple comparisons analyzed with the LSD showed that the SWV of pseudotumor (3.14 ± 0.75 m/s, range 1.57-3.94 m/s) was significantly higher than CCC (2.46 ± 0.45 m/s, range 1.74-3.03 m/s) and AML (2.49 ± 0.63 m/s, range 1.78-3.07 m/s). The P value was 0.007 and 0.001, respectively. There was no significant difference between CCC and AML (P = 0.719). For each group, there was no significant difference between mass and its surrounding parenchyma (P = 0.693, 0.892, and 0.714, respectively).
Influencing factors
Table 2 showed the correlation between SWV and other variables (age, depth, and maximum diameter) in each group, respectively. All the three types of masses had no correlation with variables, except for AML and its maximum diameter.
Table 2.
Correlation between SWV and variables (presented as P-value)
| SWV of different pathological diagnosis | Variables | ||
|---|---|---|---|
|
| |||
| Age | Maximum diameter | Depth | |
| Clear cell carcinoma | 0.620 | 0.201 | 0.131 |
| Angiomyolipoma | 0.334 | 0.015 | 0.310 |
| Pseudotumors | 0.095 | 0.966 | 0.147 |
Differential diagnoses
Between CCC and pseudotumors, the optimal cut-off value of SWV for differential diagnosis was 3.07 m/s. The AUC was 0.78 (95% CI: 0.56 to 0.924) (P = 0.004); and the sensitivity and specificity was 100% and 58.3% respectively (Figure 2).
Figure 2.
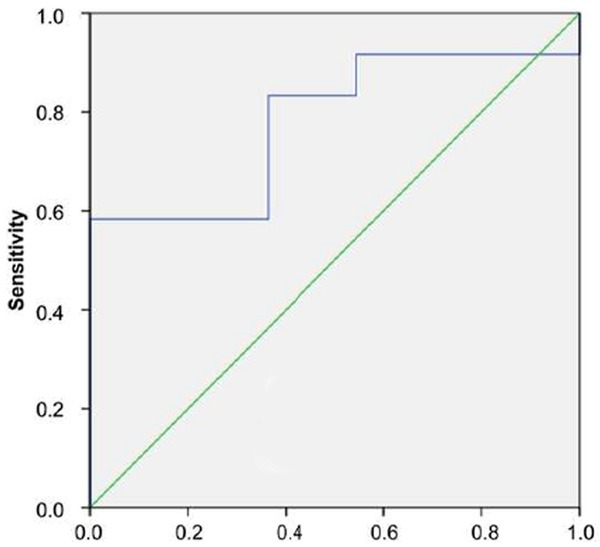
ROC curve of pseudotumors and CCC.
Between AML and pseudotumors, the optimal cut-off value of SWV for differential diagnosis was 3.03 m/s. The AUC was 0.786 (95% CI: 0.591 to 0.918) (P = 0.002); and the sensitivity and specificity was 100% and 58.3% respectively (Figure 3).
Figure 3.
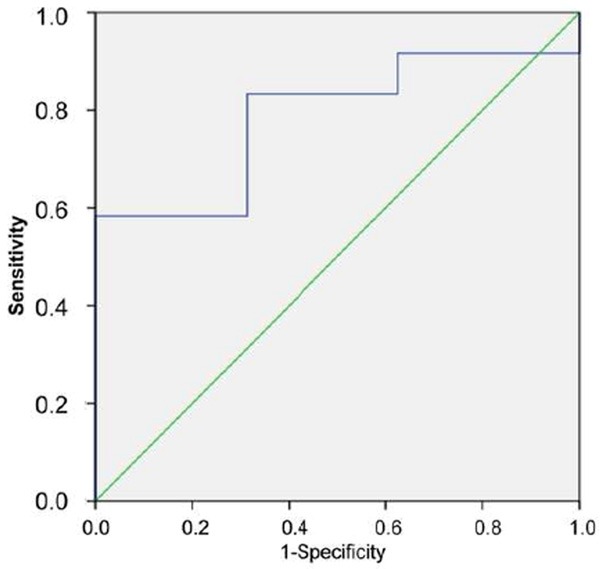
ROC curve of pseudotumors and AML.
However, between AML and CCC, there was no significant difference (P = 0.587) and the AUC was 0.562, indicating the SWV had poor diagnostic performance in differentiating AML and CCC (Figure 4).
Figure 4.
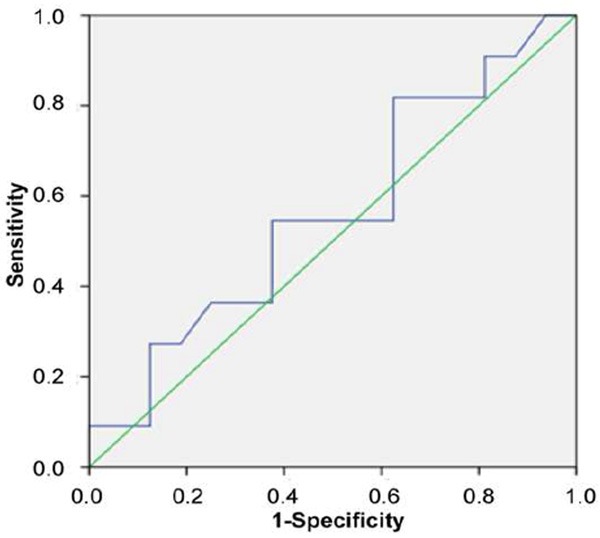
ROC curve of AML and CCC.
Discussion
Nowadays, solid renal tumors are increasingly detected incidentally in individuals without any symptoms [10]. Among them, renal AML is the most common benign mesenchymal tumor [11]. On the other hand, RCC is the most common malignant ones accounting about 80%-90% of renal malignancy [12]. RCC has many subtypes such as clear cell carcinoma (CCC), tubulopapillary carcinoma, chromophobe RCC, and so on [13]. Among them, CCC is the most frequently reported. Pseudotumors are grouped into some kinds of renal anatomic variations that may mimic solid renal lesions, but are still formed by renal parenchyma essentially [14]. Routine methods to differentiate them usually rely on contrast-enhanced imaging modalities [15].
US is a traditional approach for detecting and characterizing above-mentioned three renal masses. Comparing to CT and MRI, US has advantages in efficiency, applicability and costs but its accuracy is lower than the latter two [16]. In recent years, new techniques such as real-time elastography (RTE) and contrast-enhanced ultrasound (CEUS) have been used to improve the diagnosis of renal cell carcinoma (RCC) [17,18]. However, RTE is a semiquantitative method and has significant interobserver variability. The interobserver agreement of RTE combined with ultrasound (κ = 0.25), is lower than ultrasound only (κ = 0.37) [19]. In contrast enhanced ultrasound (CEUS), RCC usually shows chaotic vascularization without typical vascularization patterns, presenting as 48% hyperperfusion, 12% isoperfusion, 36% hypoperfusion and 4% nonperfusion in early phase [20]. Although latest study argued that CEUS was a highly sensitive and specific method for characterization of renal [21], however, patients have to face the risk from contrast agent injection. Biopsy is an invasive method to diagnose renal masses. Overall, it is a safe procedure, but still has complications such as perinephric hemorrhage (accounting for 91% of all complications), gross hematuria (5%-7%), pneumothorax (< 1%), and seeding of the needle track (0.01%). Some cases even require transfusions or arterial embolization (1.5%) [22]. Hence, new diagnostic methods are still required.
ARFI is free of the risks mentioned above and has a better intra and inter-observer reproducibility comparing to static elastography. However, the experience of separating benign and malignant tumors is still limited [23]. By using ARFI, in the present study, for AML, the softer stiffness was reflected in the lower SWV in the present study. Histologically, the AML comprises of differing degrees of fat, smooth muscle and abnormal blood vessels; and each component may predominate or be virtually absent (Figure 5). It has been proven that lesions with more fibrous contents are potentially stiffer than those with more vessels [24]. As a result, AML shows a lower SWV comparing to pseudotumors.
Figure 5.

A 55-year-old man with CCC. A. VTQ was being performed on this CCC (white arrow); B. In the gross specimen of this CCC (white arrow), a cyst cavity with fluid run off was seen (red arrow); C. Microscopically, among cells with clear cytoplasm, many tiny cysts (thin red arrow) were seen.
CCC also had a lower SWV, as shown in our results. Under microscopes, CCC is composed predominantly of cells containing clear cytoplasm, with the growth pattern of solid, tubular, or cystic. It has a characteristic delicate, branching vasculature and commonly has solid and cystic architectural patterns under microscopy [25] (Figure 6). D’Onofrio’s study on cystic lesion has proved that 0 or a low numerical value is always measured in fluid [26]. On the other hand, based on physical property of shear wave, it is mainly attenuated in fluids and is hardly to be measured. These tiny cystic components of CCC may result in a lower value of SWV comparing to pseudotumors.
Figure 6.
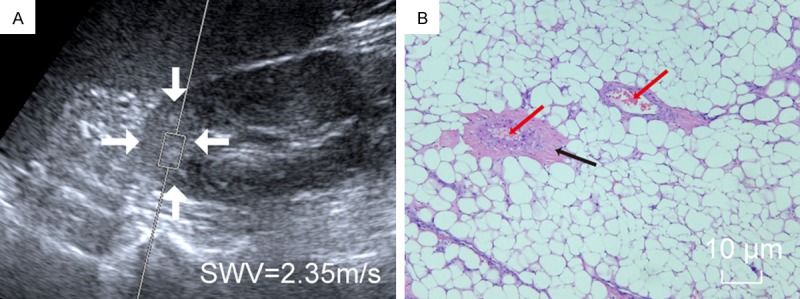
A 45-year-old man with AML. A. VTQ was being performed on this AML (white arrow); B. Microscopically, on the background of abundant fat cells, scattered smooth muscle (black arrow) and abnormal blood vessels (red arrow) were seen.
The most common renal pseudotumor is hypertrophied column of Bertin, resulting from two subkidneys which fail to fuse as usual but overlap together [27]. The overlap part of renal subkidneys may be stiff for its high density, thus a higher SWV was encountered. However, as no direct pathology proof was obtained for hypertrophied column of Bertin in this study, further studies were needed.
The ROC manifested a fair accuracy of VTQ to differentiate between CCC and pseudotumor, and between AML and pseudotumor, respectively. Although contrast-enhanced CT, MRI and CEUS can resolve the diagnostic dilemma efficiently [13,14], all of them need contrast agent injection, which have contraindication and associated risk of hypersensitivity. Therefore, VTQ can be indicated when the contrast-enhanced techniques are not suitable or available. In addition, a relative lower SWV of oncocytoma and chromophobe was observed respectively, thus a softer stiffness is predicted. However, as a single case, more evidence is needed to prove this. Unfortunately, however, CCC and AML can not be differentiated by VTQ at present stage because of their similar physical property, though their microscopic pathological changes are different. And likewise, it seems that there are no differences in SWV between masses and their surrounding renal parenchyma. Thus the application of VTQ on renal masses may focus on differential diagnoses instead of detection of renal masses.
Using VTQ to test stiffness of masses generally may not be affected by patients’ age, masses’ maximum diameter and its depth. However, for AML, it showed that the maximum diameter may be an influencing factor, because the contents of AML are complex, only a part of them were sampled by the ROI, which hardly reflected total stiffness of AML. Moreover, fat content in AML is believed with no correlation with tumor size [28], the effect of other two components should not be ignored. To eliminate tumors’ size effect, multi-spots sampling or a larger ROI may be necessary.
Some shortcomings of ARFI at its present stage should be pointed out. Due to the fixed ROI size (1 cm in length and 0.6 cm in width), ARFI does not apply to masses with maximum diameters smaller than 1 cm. Moreover, the fixed shape (rectangle) and depth limitation (< 8 cm) of ROI also restrict its application. When performing ARFI, patients need to lie in prone position and hold breath for a few seconds. Therefore, for patients with overweight or cardiorespiratory dysfunction, VTQ is rather difficult to be performed. Finally, ARFI unfortunately is not an operator independent technique. Therefore, proper.
There were some limitations of this study should be mentioned. First, the sample size was relative small, and follow-up time was relative short. Second, some other types of masses had not been included in this study, e.g. complex or atypical cystic tumors. Besides, some questions such as learning curve and the reproducibility of VTQ had not been investigated yet. Thus, more studies should be carried on in future with larger patient population.
Based on above findings and extending from this study, it suggests that VTQ can effectively differentiate solid tumors from pseudotumors. However, it can not help differentiate the benign tumors from the malignant ones. There are no differences in SWV between masses and their surrounding renal parenchyma. When performing VTQ, SWV may not be affected by patients’ age, masses’ size and depth. For some large masses, the multi-spots sampling is recommended. Generally speaking, ARFI has potential advantage for differentiating some renal solid masses, but still requires technological improvement.
Acknowledgements
We are grateful to the patients for agreeing to participate in this study. This work was supported in part by Grant 81371570 from National Natural Scientific Foundation of China, Grant 20114003 of Key Project from Shanghai Health Bureau, and Grant 2012045 of Shanghai Talent Development Project from Shanghai Human Resource and Social Security Bureau.
Disclosure of conflict of interest
None.
References
- 1.Jayson M, Sanders H. Increased incidence of serendipitously discovered renal cell carcinoma. Urology. 1998;51:203–205. doi: 10.1016/s0090-4295(97)00506-2. [DOI] [PubMed] [Google Scholar]
- 2.Remzi M, Katzenbeisser D, Waldert M, Klingler HC, Susani M, Memarsadeghi M, Heinz-Peer G, Haitel A, Herwig R, Marberger M. Renal tumour size measured radiologically before surgery is an unreliable variable for predicting histopathological features: benign tumors are not necessarily small. BJU Int. 2007;99:1002–1006. doi: 10.1111/j.1464-410X.2007.06758.x. [DOI] [PubMed] [Google Scholar]
- 3.Remzi M, Marberger M. Renal tumor biopsies for evaluation of small renal tumors: why, in whom, and how? Eur Urol. 2009;55:359–3567. doi: 10.1016/j.eururo.2008.09.053. [DOI] [PubMed] [Google Scholar]
- 4.Volpe A, Kachura JR, Geddie WR, Evans AJ, Gharajeh A, Saravanan A, Jewett MA. Techniques, safety and accuracy of sampling of renal tumors by fine needle aspiration and core biopsy. J Urol. 2007;178:379–386. doi: 10.1016/j.juro.2007.03.131. [DOI] [PubMed] [Google Scholar]
- 5.Palmeri ML, Nightingale KR. Acoustic radiation force-based elasticity imaging methods. Interface Focus. 2011;1:553–564. doi: 10.1098/rsfs.2011.0023. [DOI] [PMC free article] [PubMed] [Google Scholar]
- 6.D’Onofrio M, Gallotti A, Mucelli RP. Tissue quantification with acoustic radiation force impulse imaging: Measurement repeatability and normal values in the healthy liver. AJR Am J Roentgenol. 2010;195:132–136. doi: 10.2214/AJR.09.3923. [DOI] [PubMed] [Google Scholar]
- 7.Guo LH, Xu HX, Fu HJ, Peng A, Zhang YF, Liu LN. Acoustic radiation force impulse imaging for noninvasive evaluation of renal parenchyma elasticity: preliminary findings. PLoS One. 2013;8:e68925. doi: 10.1371/journal.pone.0068925. [DOI] [PMC free article] [PubMed] [Google Scholar]
- 8.Zhang YF, Xu HX, He Y, Liu C, Guo LH, Liu LN, Xu JM. Virtual touch tissue quantification of acoustic radiation force impulse: a new ultrasound elastic imaging in the diagnosis of thyroid nodules. PLoS One. 2012;7:e49094. doi: 10.1371/journal.pone.0049094. [DOI] [PMC free article] [PubMed] [Google Scholar]
- 9.Park H, Park JY, Kim do Y, Ahn SH, Chon CY, Han KH, Kim SU. Characterization of focal liver masses using acoustic radiation force impulse elastography. World J Gastroenterol. 2013;19:219–226. doi: 10.3748/wjg.v19.i2.219. [DOI] [PMC free article] [PubMed] [Google Scholar]
- 10.Novick AC. Management of the incidentally detected solid renal mass. Semin Nephrol. 1994;14:519–522. [PubMed] [Google Scholar]
- 11.Eble JN, Sauter G, Espstein J, Sesterhenn I. World health organization classification of tumours: pathology & genetics, tumours of the urinary system and male genital organs. Lyon: IARC Press; 2004. pp. 9–43. [Google Scholar]
- 12.Jemal A, Bray F, Center MM, Ferlay J, Ward E, Forman D. Global cancer statistics. CA Cancer J Clin. 2011;61:69–90. doi: 10.3322/caac.20107. [DOI] [PubMed] [Google Scholar]
- 13.Karumanchi SA, Merchan J, Sukhatme VP. Renal cancer: molecular mechanisms and newer therapeutic options. Curr Opin Nephrol Hypertens. 2002;11:37–42. doi: 10.1097/00041552-200201000-00006. [DOI] [PubMed] [Google Scholar]
- 14.Hélénon O, Correas JM, Balleyguier C, Ghouadni M, Cornud F. Ultrasound of renal tumors. Eur Radiol. 2001;11:1890–1901. doi: 10.1007/s003300101077. [DOI] [PubMed] [Google Scholar]
- 15.Mazziotti S, Zimbaro F, Pandolfo A, Racchiusa S, Settineri N, Ascenti G. Usefulness of contrast-enhanced ultrasonography in the diagnosis of renal pseudotumors. Abdom Imaging. 2010;35:241–245. doi: 10.1007/s00261-008-9499-y. [DOI] [PubMed] [Google Scholar]
- 16.Yamashita Y, Takahashi M, Watanabe O, Yoshimatsu S, Ueno S, Ishimaru S, Kan M, Takano S, Ninomiya N. Small renal cell carcinoma: pathologic and radiologic correlation. Radiology. 1992;184:493–498. doi: 10.1148/radiology.184.2.1620854. [DOI] [PubMed] [Google Scholar]
- 17.Tan S, Özcan MF, Tezcan F, Balci S, Karaoğlanoğlu M, Huddam B, Arslan H. Real-time elastography for distinguishing angiomyolipoma from renal cell carcinoma: preliminary observations. AJR Am J Roentgenol. 2013;200:W369–375. doi: 10.2214/AJR.12.9139. [DOI] [PubMed] [Google Scholar]
- 18.Xu ZF, Xu HX, Xie XY, Liu GJ, Zheng YL, Liang JY, Lu MD. Renal cell carcinoma: real-time contrast-enhanced ultrasound findings. Abdom Imaging. 2010;35:750–756. doi: 10.1007/s00261-009-9583-y. [DOI] [PubMed] [Google Scholar]
- 19.Yoon JH, Kim MH, Kim EK, Moon HJ, Kwak JY, Kim MJ. Interobserver variability of ultrasound elastography: how it affects the diagnosis of breast lesions. AJR Am J Roentgenol. 2011;196:730–736. doi: 10.2214/AJR.10.4654. [DOI] [PubMed] [Google Scholar]
- 20.Haendl T, Strobel D, Legal W, Frieser M, Hahn EG, Bernatik T. Renal cell cancer does not show a typical perfusion pattern in contrast-enhanced ultrasound. Ultraschall Med. 2009;30:58–63. doi: 10.1055/s-2008-1027189. [DOI] [PubMed] [Google Scholar]
- 21.Barr RG, Peterson C, Hindi A. Evaluation of Indeterminate Renal Masses with Contrast-enhanced US: A Diagnostic Performance Study. Radiology. 2013;271:133–142. doi: 10.1148/radiol.13130161. [DOI] [PubMed] [Google Scholar]
- 22.Silverman SG, Gan YU, Mortele KJ, Tuncali K, Cibas ES. Renal masses in the adult patient: the role of percutaneous biopsy. Radiology. 2006;240:6–22. doi: 10.1148/radiol.2401050061. [DOI] [PubMed] [Google Scholar]
- 23.Grenier N, Gennisson JL, Cornelis F, Le Bras Y, Couzi L. Renal ultrasound elastography. Diagn Interv Imaging. 2013;94:545–550. doi: 10.1016/j.diii.2013.02.003. [DOI] [PubMed] [Google Scholar]
- 24.Zhang P, Zhou P, Tian SM, Qian Y, Deng J, Zhang L. Application of acoustic radiation force impulse imaging for the evaluation of focal liver lesion elasticity. Hepatobiliary Pancreat Dis Int. 2013;12:165–170. doi: 10.1016/s1499-3872(13)60027-2. [DOI] [PubMed] [Google Scholar]
- 25.Störkel S, Eble JN, Adlakha K, Amin M, Blute ML, Bostwick DG, Darson M, Delahunt B, Iczkowski K. Classification of renal cell carcinoma: Workgroup No. 1. Union Internationale Contre le Cancer (UICC) and the American Joint Committee on Cancer (AJCC) Cancer. 1997;80:987–989. doi: 10.1002/(sici)1097-0142(19970901)80:5<987::aid-cncr24>3.0.co;2-r. [DOI] [PubMed] [Google Scholar]
- 26.D’Onofrio M, Gallotti A, Salvia R, Capelli P, Mucelli RP. Acoustic radiation force impulse (ARFI) ultrasound imaging of pancreatic cystic lesions. Eur J Radiol. 2011;80:241–244. doi: 10.1016/j.ejrad.2010.06.015. [DOI] [PubMed] [Google Scholar]
- 27.Yeh HC, Halton KP, Shapiro RS, Rabinowitz JG, Mitty HA. Junctional parenchyma: revised definition of hypertrophic column of Bertin. Radiology. 1992;185:725–732. doi: 10.1148/radiology.185.3.1438753. [DOI] [PubMed] [Google Scholar]
- 28.Mehta V, Venkataraman G, Antic T, Rubinas TC, Le Poole IC, Picken MM. Renal angiomyolipoma, fat-poor variant--a clinicopathologic mimicker of malignancy. Virchows Arch. 2013;463:41–46. doi: 10.1007/s00428-013-1432-2. [DOI] [PubMed] [Google Scholar]


