

Abstract
Many organisms rely on a circadian clock system to adapt to daily and seasonal environmental changes. The mammalian circadian clock consists of a central clock in the suprachiasmatic nucleus that is tightly coupled and synchronizes other clocks in peripheral tissues1, 2. Plants also have a circadian clock, but plant circadian clock function has long been assumed to be uncoupled3. Only a few studies have been able to show a weak, local coupling among cells4, 5, 6, 7. Here, by implementing two novel techniques, we have performed a comprehensive tissue-specific analysis of leaf tissues, and we have discovered that the vasculature and mesophyll clocks asymmetrically regulate each other in Arabidopsis. The circadian clock in the vasculature has characteristics distinct from other tissues, cycles robustly without environmental cues, and affects circadian clock regulation in other tissues. Furthermore, we found that vasculature-enriched genes that are rhythmic are preferentially expressed in the evening, whereas rhythmic mesophyll-enriched genes tend to be expressed in the morning. Our results set the stage for a deeper understanding of how the vasculature circadian clock in plants regulates key physiological responses such as flowering time.
To expedite tissue-specific analysis, we developed a technique to isolate three tissues of leaves with high spatiotemporal resolution. We based our strategy on a previously reported technique for mesophyll and vasculature isolation6. After optimizing the buffer and the isolation technique we were able to isolate all three major leaf tissues — mesophyll, vasculature, and epidermis —within 30 minutes (Fig. 1a and Extended Data Fig. 1a, b). Isolated tissues appeared to be highly purified when observed under the microscope (Fig. 1a).
Figure 1. Direct tissue isolation from cotyledons.

a, Schematic drawings of the tissue-isolation strategy and isolated mesophyll (left), vasculature (middle), and epidermis (right) visualized by dark field microscopy. See Methods online for the detailed protocol. Bar=250 μm. b, Expression analysis of Lhcb2.1, Sultr2;1, and GC1 as mesophyll-, vasculature-, and epidermis markers, in the isolated tissues from 10-day-old seedlings grown under long day conditions. ZT; Zeitgeber time. The figure shows representative qPCR results from the three independent biological repeats. c, d, Purities of the isolated tissues (c) and contribution ratios of each of them to whole leaf mRNA (d) are estimated using the data in Fig. 1b. See Methods online for details. Mean±SEM (n=14).
As different types of tissues have different gene-expression profiles, we applied Vandesompele's method to identify appropriate reference gene sets8. Among our 10 candidates, ASPARTIC PROTEINASE A1 (APA1) and ISOPENTENYL PYROPHOSPHATE:DIMETHYLALLYL PYROPHOSPHATE ISOMERASE 2 (IPP2) showed lower M values, suggesting stable expression in all tissues and time points (Extended Data Fig. 1c). We therefore used the geometric mean of APA1 and IPP2 as an internal control in our quantitative RT-PCR (qPCR) analysis.
The purity of the isolated tissues was confirmed by detecting the expression of the tissue-specific markers LIGHT-HARVESTING CHLOROPHYLL B-BINDING 2.1 (Lhcb2.1)9, SULFATE TRANSPORTER 2;1 (Sultr2;1)10, and GC111 by qPCR over 24 h (Fig. 1b). In addition, the three primary vascular sub-tissues were identified by marker-gene-expression analysis12, suggesting that the isolated vasculature is intact (Extended Data Fig. 1d). The purity of vasculature was more than 90%, and that of mesophyll and epidermis was more than 80%, (Fig. 1c) indicating that the results from isolated tissues predominantly reflect the dynamics of the respective specialized cells therein. About 77% of total leaf mRNA was derived from mesophyll cells, whereas only about 8% and 15% of mRNA was derived from vasculature and epidermis, respectively (Fig. 1d and Extended Data Fig. 1e), suggesting that previous results of circadian clock studies that were primarily using whole leaves or whole plants as the RNA source mostly reflected circadian rhythms in mesophyll cells, and gene expression dynamics in minor tissues such as vasculature or epidermis were largely overlooked.
We next examined the expression of TIMING OF CAB EXPRESSION 1 (TOC1) and CIRCADIAN CLOCK ASSOCIATED 1 (CCA1), and that of stress-induced genes under long day (LD) conditions. In all three isolated tissues, 24 h oscillations of TOC1 and CCA1 expression were detected, and these were consistent with the whole leaf, indicating that the isolation process did not affect the rhythms of clock genes (Extended Data Fig. 1f). Also no significant induction of stress-induced genes expression was observed (Extended Data Fig. 1g).
By applying the direct tissue isolation technique we investigated tissue-specific regulation of the Arabidopsis clock system. Wild-type plants were grown under LD and short day (SD) conditions, and whole leaves (W), mesophyll (M), and vasculature (V) from cotyledons were collected every four hours over two days. We then performed a time-course microarray analysis, and detected cycling genes and their diel phases, using the HAYSTACK13 algorithm with a <3% of false discovery rate (FDR) (Extended Data Fig. 2 and Supplementary Table 1). About 50% of the genes in the microarray were identified as cycling genes in each condition, and 96.3% of the genes in the microarray were identified as cycling genes under at least one condition tested, whereas only 3.7% of the genes in the microarray were oscillating together, suggesting tissue-specific and day-length-specific diel regulation (Extended Data Fig. 3a-c). We also detected 20 genes as new candidates for reference genes that do not cycle across any condition (Supplementary Table 2). The percentage of wave-shape model usage and that of cycling transcripts with specific amplitude were comparable among tissue and conditions (Extended Data Fig. 3d, e).
We first confirmed that known tissue-specific-marker genes were correctly identified as such in our microarray analysis (Extended Data Fig. 4a, b and Supplementary Tables 3 and 4), and validated the geometric mean of APA1 and IPP2 as an appropriate reference for tissue-specific clock analyses (Extended Data Fig. 1c and 4c). In conclusion, we confirmed sufficient sensitivity and specificity in the microarray analysis, and defined two-fold changes that are significant differences.
We next observed global gene-expression profiles in each tissue (Fig. 2a and Extended Data Fig. 5a, b). Highly expressed genes in vasculature at ZT16 (blue-colored genes) showed low expression levels in mesophyll, whereas genes that had lower expression in vasculature (green-colored genes) showed higher expression levels in mesophyll. In whole leaves, the gene-expression profile was pro-mesophyllic, consistent with our previous result that estimated about 80% of RNA in whole leaves came from mesophyll cells (Fig. 1d). Thus, we note that vasculature has inverse gene-expression profiles compared to whole leaf and mesophyll.
Figure 2. Vasculature and mesophyll have different gene expression profiles.
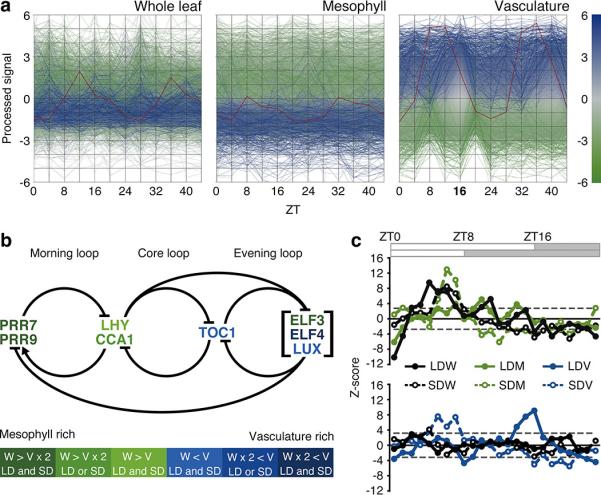
a, Relative gene expression levels in whole leaf, mesophyll and vasculature under LD. Blue and green colored genes indicate higher and lower expression than average in the vasculature at ZT16, respectively. As an example, the red line highlights ELF4 expression profile. b, Color code expression level representation of the clock genes in the circadian clock model. Mesophyll- and vasculature-rich genes are defined based on arithmetic mean expression levels and frequencies. See Methods online for the detailed definition. c, Z-score profiles of mesophyll-rich genes (upper panel) and vasculature-rich genes (lower panel) across the entire day. Dotted horizontal lines indicate threshold, (FDR<3%). See Methods online for details.
The current circadian clock model consists of multiple interlocking loops14, 15. The morning loop consists of morning-expressed PSEUDO-RESPONSE REGULATORs (PRRs), LATE ELONGATED HYPOCOTYL (LHY) and CCA1, and the evening loop consists of evening-expressed EARLY FLOWERINGs (ELFs), LUX ARRHYTHMO (LUX) and TOC1. The core loop links these two loops. By comparing the arithmetic mean expression levels in the vasculature with those in whole leaves, we were able to define vasculature-rich genes and mesophyll-rich genes. We found that the morning loop consists of mesophyll-rich genes, whereas the evening loop consists of vasculature-rich genes (Fig. 2b). ELF4 expression is about 10-fold higher in vasculature, suggesting that the functional ELF3, ELF4, and LUX tripartite Evening Complex16, 17 resides primarily in vasculature, even though ELF3 has rather mesophyll-rich expression. Consistent with this result, Z-score profiles of mesophyll-rich genes (two-fold higher in whole leaf compared to vasculature) showed higher scores in the morning, indicating that mesophyll-rich genes tend to be expressed in the morning (Fig. 2c). Moreover, vasculature-rich genes (two-fold higher in vasculature compared to whole leaf) tend to be expressed in the evening of the corresponding day length (Fig. 2c). Interestingly, significantly enriched GO Slim terms were comprehensively different between mesophyll-rich and vasculature-rich genes, suggesting that the vasculature and mesophyll clocks have different functions (Extended Data Table 1).
To ascertain whether different tissues have different phases, we examined PRR7, TOC1, and ELF4 as representative clock genes. Although the diel phases of these genes in the isolated tissues were not significantly shifted (Extended Data Fig. 5c), this was not the trend when comparing all cycling genes. Even accounting for phase randomization by noise, the ratio of phase-locked genes (±2 h) was reduced in vasculature versus whole leaf (V-W) and mesophyll versus vasculature (M-V), compared to whole leaf versus mesophyll (W-M), indicating that vasculature and mesophyll have relatively distinct global phases (Extended Data Fig. 5d, e). We then examined if the vasculature clock has characteristic regulatory targets. The p-value of each cycling gene was ranked from the largest to the smallest, and the percentage of overlapping genes (POG) was used to assess the percentage of genes that were shared as common targets of the clock in a specific tissue. Higher POGs were observed in W-M, and lower POGs were observed in V-W and M-V (Extended Data Fig. 5f), indicating that the vasculature clock has relatively distinct, characteristic regulatory targets. Consistent with this notion, we identified two novel vasculature-specific elements, that we named long day vasculature element (LVE: ACACGG) and short day vasculature element (SVE: GCGGGA), both of which showed a higher Z-score in vasculature but not in whole leaves and mesophyll (Extended Data Fig. 6). We also found that known elements such as the telo-box, starch box, and protein box18 were rather mesophyll-enriched elements (Extended Data Fig. 6). Recently, tissue-specific cis-regulatory motifs were also revealed in Drosophila19.
To support the results obtained from isolated tissues with a non-invasive observation of promoter activity, we next developed a tissue-specific luciferase assay (TSLA) for real-time monitoring of tissue-specific promoter activity. We combined the split-luciferase complementation assay for detecting protein-protein interactions20 and the AP1 complex, a heterodimer comprising Jun and Fos. The carboxy and amino-terminal fragments of firefly luciferase (cLuc and nLuc) were fused to the C-terminus of A-Fos21, the Fos leucine zipper with amphipathic acidic extension, and the c-Jun bZIP domain, respectively. [A-Fos]-cLUC (Ac) and [c-Jun bZIP domain]-nLUC (Jn) were then driven by tissue-specific and clock promoters, respectively (Fig. 3a). To spatiotemporally regulate the luciferase complementation, we used the TOC1 or CCA1 clock promoter and the SUCROSE-PROTON SYMPORTER 2 (SUC2) vasculature promoter to generate TOC1::Jn, CCA1::Jn and SUC2::Ac, respectively. Cauliflower mosaic virus (CaMV) 35S::Jn and CaMV 35S::Ac were used as controls. These constructs were transformed into Arabidopsis, resulting in the transgenic lines that we called CaMV 35S/SUC2-TSLA, TOC1/SUC2-TSLA, TOC1/CaMV 35S-TSLA, CCA1/SUC2-TSLA, and CCA1/CaMV 35S -TSLA. Compared to TOC1::LUC and TOC1/CaMV 35S-TSLA, vasculature-specific luminescence was observed in 10-day-old TOC1/SUC2-TSLA seedlings under 12 h light 12 h dark (L/D) conditions (Fig. 3b-d). We also examined if the TSLA displayed rhythmic oscillations under free running conditions and confirmed that all lines tested except CaMV 35S/SUC2-TSLA oscillated with around 24 h period (Fig. 3e, f and Extended Data Fig. 7). The circadian phase of CCA1 was locked between CCA1/CaMV 35S-TSLA and CCA1/SUC2-TSLA, whereas for TOC1 TOC1/CaMV 35S-TSLA was shifted earlier compared to TOC1/SUC2-TSLA. These results reconfirmed our conclusion that there are divergent properties of circadian clock regulation in the vasculature.
Figure 3. Tissue-specific luciferase assay (TSLA).

a, Schematic drawings of the TSLA strategy. b-d, Luminescence images of TOC::LUC (b), TOC1/SUC2-TSLA (c) and TOC1/CaMV 35S-TSLA (d) seedlings grown under L/D for 10 days. Right panels shows enlarged cotyledons surrounded by white boxes. Bar=1 cm (left) and 1 mm (right). e, f, Real time monitoring of the luminescence of 10-day-old TOC1/SUC2-TSLA #3 (n=6) and TOC1/CaMV 35S-TSLA #3 (n=12) seedlings (e), and CCA1/SUC2-TSLA #12 (n=14) and CCA1/CaMV 35S-TSLA #2 (n=12) seedlings (f) under L/D and free-running conditions. Mean±SD. cps; counts per second. Signals after subtraction of background noise are shown. Period lengths calculated by FFT-NLLS29 are shown in the Extended Data Fig. 7e.
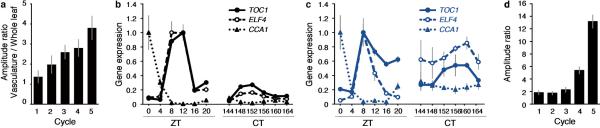
The vasculature thus appears to have distinct gene-expression dynamics, with characteristic circadian phases and regulatory targets. To test if the vasculature clock is robust in plants, we examined TOC1 expression in whole leaves and vasculature under L/D and free running conditions (Fig. 4a). The amplitude of TOC1 oscillation under L/D was comparable between whole leaf and vasculature, being the ratio between amplitude in the vasculature with respect to the amplitude in whole leaf close to 1 (Extended Data Fig. 8a). By contrast, when plants were in free-running conditions, the amplitude of TOC1 in whole leaves damped rapidly already at the third cycle, whereas a more persistent circadian rhythm was still maintained in the vasculature (Fig. 4a). Therefore, every cycle under constant light conditions, the difference between the amplitudes in both tissues increased (Extended Data Fig. 8a). The robust circadian rhythm in the vasculature persisted for over one week. We also confirmed that the expression of other clock genes, such as CCA1 and ELF4, is also robust in the vasculature (Extended Data Fig. 8b, c).
Figure 4. The vasculature clock is robust and dominant to other clocks.

a, TOC1 expression in whole leaf and vasculature under L/D and continuous light free-running conditions. Days 5 to 9 and day 12 are shown. Mean±SEM (days 5-9, n=3, and day 12, n=4). b, Luminescence of TOC1::LUC (n=22) and TOC1::LUC; SUC2::CCA1 #18 (n=24) seedlings grown under L/D and continuous light free-running conditions. Days 5 to 9 are shown. Mean±SD. c, TOC1 expression in whole leaf, mesophyll, and vasculature from 10-day-old wild type, CAB3::CCA1 and SUC2::CCA1 seedlings. Plants were grown under L/D for 5 days and then transferred into free-running conditions and analyzed. Mean±SEM (n=3). d, Flowering time and FT expression analysis under LD. Mean±SD (n=12). Promoters of 3-KETOACYL-COA SYNTHASE 6 (CER6), UNUSUAL FLORAL ORGAN (UFO), and TERPENE SYNTHASE-LIKE SEQUENCE-1,8-CINEOLE (TPS-CIN) were used as epidermis-, shoot apical meristem-, and hypocotyl/root promoters, respectively22. FT expression was detected at ZT16 of LD grown 10-day-old seedlings. Mean±SD (n=3). a, c, d, The gene expression was checked by qPCR. e, Our model proposes that vasculature (phloem companion cells) clock and mesophyll clock asymmetrically affect each other in leaves. Through long and short-distance signaling, the vasculature clock regulates the mesophyll clock and photoperiodic flowering.
To test for asymmetric regulation between tissue-specific clocks, we produced a transgenic line whose vasculature clock was perturbed by overexpression of CCA1-GFP driven by SUC2 promoter (SUC2::CCA1). We crossed the SUC2::CCA1 line with the TOC1::LUC line, and observed a strong influence of the vasculature clock perturbation on the whole leaf TOC1::LUC luminescence (Fig. 4b and Extended Data Fig. 8d), even though the RNA contribution ratio of vasculature is less than 10% (Fig. 1d and Extended Data Fig. 1e). We then monitored TOC1 expression in isolated mesophyll and vasculature under free running conditions. As shown in Fig. 4c, robust TOC1 expression in wild type vasculature was still observed, but it was weaker in whole leaves and mesophyll. When the vasculature clock was perturbed by SUC2::CCA1 under the same conditions, TOC1 expression was perturbed not only in vasculature but also in mesophyll, indicating the dominance of the vasculature for clock regulation in the mesophyll (Fig. 4c). We also used CHLOROPHYLL A/B BINDING PROTEIN 3 (CAB3)::CCA1 for mesophyll clock perturbation22, 23. In contrast to SUC2::CCA1, dysfunction of the mesophyll circadian clock affected circadian rhythms only in mesophyll, and TOC1 expression in the vasculature still oscillated persistently. Thus, at least in this condition, asymmetric dominance of the vasculature clock over the mesophyll clock was revealed.
Finally, we investigated whether the vasculature clock can affect a physiological response. In plants, the circadian clock and photoperiodism are tightly coupled, and many clock mutations affect photoperiodic flowering24. We therefore generated a set of transgenic lines that express CCA1-GFP driven by different tissue-specific promoters that we had already tested in a previous study22, 23, 25 (Extended Data Fig. 9). Among them, only CCA1::CCA1 and SUC2::CCA1 showed a late-flowering phenotype under flowering inductive LD (Fig. 4d). In addition, the expression levels of FLOWERING LOCUS T (FT)26, 27 were quite consistent with the flowering phenotypes (Fig. 4d). Hence, the vasculature clock regulates a whole plant physiological response by regulating the dynamics of FT (Fig. 4e).
By combining two powerful tools for tissue-specific analysis, a rapid, direct tissue isolation method and the TSLA, we have been able to investigate the tissue-specific regulation of the Arabidopsis circadian clock system.
We have demonstrated that the vasculature clock system is distinct and robust; moreover, it is able to control neighboring mesophyll cell gene expression and a physiological response. In that sense, the vasculature and mesophyll clocks in Arabidopsis constitute a layered clock system such as central and peripheral clocks in mammals1, 2, or evening cells and morning cells in Drosophila28 (Fig. 4e).
Our findings can explain specific functions of the clock in vasculature and mesophyll, but additional tissue-specific analysis with high spatiotemporal resolution will be required to elucidate the contributions of as-yet undefined clock genes to the robustness and sensitivity of the hierarchical circadian clock circuitry that we have uncovered.
Online only Methods
Plant material and growth conditions
All wild type and transgenic lines were Arabidopsis thaliana ecotype Columbia-0 (Col-0). Seeds were surface-sterilized and sown on 0.8% agar plates containing Murashige and Skoog medium with 0.5% sucrose. Plants were grown under LD (16 h light and 8 h dark, 56 μmol m−2 s−1), SD (8 h light and 16 h dark, 84 μmol m−2 s−1), and L/D (12 h light and 12 h dark, 84 μmol m−2 s−1) conditions at 22 °C for nine to ten days. Transgenic plants were generated using the floral dipping method. Flowering times were scored by determining the number of total leaves when the first flower opened.
Tissue isolation
For mesophyll isolation, 20 to 30 Arabidopsis cotyledons were put on labeling tape (Shamrock Scientific Specialty Systems, Inc) and the epidermis was peeled off using Scotch tape (3M). After trimming of the labeling tape, the cotyledons were dropped into a 1.5 mL centrifuge tube containing 1 mL of enzyme solution (0.75 % Cellulase Onozuka R-10 (Yakult), 0.25 % Macerozyme R-10 (Yakult), 0.4 M Mannitol, 5 mM MES-KOH (pH 5.6), 8 mM CaCl2). The tube was slowly rotated by inversion for 20 min at room temperature, and then the content was passed through a 30-100 μm nylon mesh to remove debris. The filtrate was centrifuged for 5 min at 100 rpm at 4°C. The supernatant was removed and the tubes were frozen in liquid nitrogen.
For vasculature and epidermis isolation, six 1.5 mL centrifuge tubes were filled with 1 mL of enzyme solution (the same used for mesophyll isolation). Cotyledons were cut and 20~30 were dropped into each tube (120 to 180 cotyledons were needed in total). The tubes were placed in a sonicator (Bioruptor UCD-250 (Cosmo Bio)) and sonicated gently (Level “L”, means lower output). The contents of each tube were spread on a petri dish. Under a stereomicroscope, vasculature and epidermis were sorted and collected using two needles. Tissues were frozen in liquid nitrogen and dropped into 1.5 mL tubes.
Real-time PCR analysis
Total RNA was extracted using an RNeasy Plant Mini Kit (Qiagen) and reverse-transcribed using Transcriptor First Strand cDNA Synthesis Kit (Roche) according to manufacturer's instructions. Real-time gene expression was analyzed with a CFX96 Real-Time PCR Detection System (Bio-Rad). The geometric mean of APA1 and IPP2 was used as a control. Specific sequences for each primer pair were:
APA1-RT-F, 5’- TCCCAAGATCCAGAGAGGTC;
APA1-RT-R, 5’- CTCCAGAAGAGTATGTTCTGAAAG;
IPP2-RT- F, 5’- GTATGAGTTGCTTCTCCAGCAAAG;
IPP2-RT-R, 5’- GAGGATGGCTGCAACAAGTGT;
Lhcb2.1-RT-F, 5’- TTGGTGTATCCGGTGGTGGCC;
Lhcb2.1-RT-R, 5’- GTCCGTACCAGATGCTTTGAGGAGTAGA;
Sultr2;1-RT-F, 5’- GGTGTTGAGCTAGTGATCGTTAACCCG;
Sultr2;1-RT-R, 5’- CCCGTAACACAACTGGTCCTTTGA;
GC1-RT-F, 5’- TCGTCCAAGAATCAATTGTGGGC;
GC1-RT-R, 5’- GTGTTGCCGGAGGTTCCCGG;
TOC1-RT-F, 5’- GCCTCTTCGCACCAACGAGCT;
TOC1-RT-R, 5’- TCAGCAAGTCCTAGCATGCGTCT;
CCA1-RT-F, 5’- GAGGCTTTATGGTAGAGCATGGCA;
CCA1-RT-R, 5’- TCAGCCTCTTTCTCTACCTTGGAGA;
IRX3-RT-F, 5’- GATCGCTGCTAATCTCCGGC;
IRX3-RT-R, 5’- TCAGAGGCTTTGGCTCTTCA;
WOX4-RT-F, 5’- CAAAGCAGCTTCACGACCAC;
WOX4-RT-R, 5’- TCTCCACCATTGGTTCTCTCATA;
AtHB8-RT-F, 5’- ACCAGGGGAATTTGGCTACC;
AtHB8-RT-R, 5’- CCGCAATGGACAATAATCCAGC;
GFP-RT-F, 5’- GAGCTGAAGGGCATCGACTT; and
GFP-RT-R, 5’- TTCTGCTTGTCGGCCATGAT.
The following thermal cycling profile was used,
APA1, 95°C for 10 s, ~40 cycles of 95°C for 8 s, 66.6°C for 15 s and 72°C for 15 s;
IPP2, 95°C for 10 s, ~40 cycles of 95°C for 8 s, 69.4°C for 15 s and 72°C for 15 s;
Lhcb2.1, Sultr2;1, GC1, TOC1, IRX3, WOX4, and AtHB8, 95°C for 60 s, ~40 cycles of 95°C for 10 s, 60°C for 15 s and 72°C for 15 s;
CCA1, 95°C for 60 s, ~40 cycles of 95°C for 10 s, 60°C for 15 s and 72°C for 7 s;
COR15A and ADH1, 95°C for 10 s, ~40 cycles of 95°C for 10 s, 68.4°C for 15 s and 72°C for 15 s;
RD29A, 95°C for 10 s, ~40 cycles of 95°C for 10 s, 70°C for 15 s and 72°C for 15 s; and
GFP, 95°C for 60 s, ~45 cycles of 95°C for 10 s, 62°C for 15 s and 72°C for 15 s.
The primer sequences and reaction conditions for FT were previously described30. Each sample is run in technical triplicate to reduce experimental errors. Error bars were calculated from the result of biological replicates (in most case biological triplicates). Data were analyzed using CFX manager (Bio-Rad).
Estimation of purity and the contribution ratio
For whole leaf, mesophyll, vasculature, and epidermis samples, gene-expression levels W, M, V, and E of n time points (in this case, 18 time points including 6 time series with biological triplicate) are measured. The contribution ratio of each tissue at a given time, CV(i), CE(i), and CM(i), was calculated (Equation 1). To circumvent the effect of outlier, trimmed k time points are used. The Cv(i) and CE(i) were defined as the reciprocal of the concentration ratio. CW(i) was always 1 by definition.
(i ∈ [1, n], k = ceiling(0.1n), X = {M, V, E}):
| (1.1) |
| (1.2) |
| (1.3) |
The contribution ratio of each tissue was calculated by using the trimmed mean (Equation 2).
| (2) |
The purity of each tissue at a given time P(i) was also calculated (Equation 3). These were calculated by subtracting the contamination ratio in each tissue.
(i ∈ [1, n], k = ceiling(0.1n), X = {M, V, E}):
| (3.1) |
| (3.2) |
| (3.3) |
The purity of each tissue was calculated by using the trimmed mean (Equation 4).
| (4) |
Microarray analysis
From Arabidopsis seedlings grown under LD and SD for nine days, whole leaf, mesophyll, and vasculature were isolated every four hours over two days. Total RNA was extracted using an RNeasy Plant Mini Kit (Qiagen) according to manufacturer's instructions. Experimental procedures and quality controls for microarray analysis were performed by the Laboratory of Cellular Biochemistry at the University of Tokyo, Japan. RIN values of whole leaf, mesophyll, and vasculature samples were 7.3±0.2, 7.1±0.3, and 6.4±0.3, respectively. Labeled cRNA was hybridized onto an Affymetrix Genechip® Arabidopsis Gene 1.0 ST Array using recommended procedures for hybridization, washing, and staining. The GeneChips were scanned, and data were normalized by the GCRMA method with R and Bioconductor31. Since the ST array does not include any mismatch (MM) probe sets, which are needed for GCRMA normalization, we applied antigenomic probe sets instead of MM probe sets. Normalized data were then analyzed with the HAYSTACK algorithm to identify the best-fit model, phase-of-expression, and to estimate a p-value and false-discovery rate (FDR) for each gene.
In the global gene expression analysis, GCRMA normalized log2 scale data were preprocessed by mean centering Then the average expression level in the vasculature at ZT0 or ZT16 was set to 0. (Fig. 2a and Extended Data Fig. 5a, b). Global gene expression analysis was carried out with Subio Platform V1.15.4276 (Subio Inc., Amami, Japan).
For the definition of mesophyll- and vasculature-rich genes, arithmetic mean expression levels of whole leaf and vasculature were calculated. Definitions of vasculature-rich genes used in Fig. 2b are as follow: [W × 2 < V, LD and SD], Average expression in vasculature is two-fold higher than in whole leaf both under LD and SD conditions;
[W × 2 < V, LD or SD], Average expression in vasculature is higher than in whole leaf both under LD and SD conditions, and is two-fold higher either under LD or SD conditions; and
[W < V, LD and SD], Average expression in vasculature is higher than in whole leaf both under LD and SD conditions.
Mesophyll-rich genes had opposite definitions.
In Fig. 2c, mesophyll- and vasculature-rich genes were defined as having two-fold higher or lower expressions in whole leaf compared to vasculature.
A Z-score indicates how many standard deviations a value is from the mean (in this case how many genes which have a specific phase bin are enriched or diluted than expected from all non-biased cycling genes).
For the percentage of overlapping genes (POG) analysis, the p-value of each cycling gene was obtained from the HAYSTACK analysis. Cycling genes were ranked by their p-values and the POGs between tissues were calculated for the top 100 to 11,000 genes.
For the motif analysis, the combination of 2 day-length conditions and 3 tissues, with the 24 phases of the day, created 144 independent phase bins, each is containing hundreds of co- regulated genes. The list of genes in each phase bin served as the input for the enumerative promoter- searching tool ELEMENT12 (http://www.mockler.org), which identified overrepresented 3-8mer “words” in 500bp of the upstream promoter regions.
Plasmid construction
For TOC1::LUC, the 3′ UTR of TOC1 was amplified by PCR from a Col-0 genomic DNA using the following primers:
TOC1 3′-UTR-F, 5′-AGTCGACTGGATCCGGTACCAGATACACCAAG; and
TOC1 3′-UTR-R, 5′-GCGGCCGCGAATTCGGGAGCGATTATATATAAT.
The amplified fragment was cloned into the KpnI site of pENTR1A (no ccdb) plasmid using an In-Fusion HD Cloning Kit (TaKaRa). In the same way, the coding sequence of LUC plus, the 2,068bp of TOC1 promoter region and the nosT were cloned step-by-step using the KpnI or XbaI sites of the plasmid. PCR primers were:
LUCplus-F, 5′- AGTCGACTGGATCCGGTACCATGGAAGACGCCAAAAACAT;
LUCplus-R, 5′- TTCTTGGTGTATCTGCTTTACACGGCGATCTTTCCGC;
TOC1-promoter-F, 5′-AGTCGACTGGATCCGGTACCCTTCTCTGAGGAATTTCATC;
TOC1-promoter-R, 5′-TTTGGCGTCTTCCATGATCAGATTAACAACTAAAC;
nosT-F, 5′-GCCGCACTCGAGATATCTAGAATCGTTCAAACATTTGGCAA; and
nosT-R, 5′-TACAAGAAAGCTGGGTCTAGAGATCTAGTAACATAGATGAC.
After sequencing, this construct was recombined with pFAST-G0132.
These constructs were introduced into wild type cells, and transgenic plants were selected by fluorescence of T1 seeds.
For tissue-specific luciferase reporter constructs, 240bp of the bZIP domain of chicken c-Jun and 291bp of A-Fos were amplified by linker-adaptor PCR using the following primers: Jun-F, 5′-AAAGGTACCATGTACCCATACGATGTTCCAGATTACGCTCGGATCAAGGCGGA GAGG;
Jun-R, 5′- AAAGGTACCTCCTCCTCCTCCACTTCCTCCTCCTCCACTAAATGTTTGCAACTGCTGCG;
A-Fos-F, 5′-AAAGGTACCATGGACTACAAGGACGACGATGAC; and
A-Fos-R, 5′- AAAGGTACCTCCTCCTCCTCCACTTCCTCCTCCTCCACTATCAGGGATCTTGCAGG C.
The amplified fragments were cloned into the KpnI site of pPZP211/NP/nosT33 and pPZP211/NP/35S-nosT (pPZP211/c-Jun, pPZP211/A-Fos, pPZP211/35S::c-Jun and pPZP211/35S::A-Fos). The N-terminus LUC plus (1-416 a.a.) and C-terminus LUC plus (397-550 a.a.) were then PCR amplified and cloned into the SacI site of the pPZP211/c-Jun, pPZP211/A-Fos, pPZP211/35S::c-Jun and pPZP211/35S::A-Fos, respectively (pPZP211/Jn, pPZP211/Ac, 35S::Jn and 35S::Ac). PCR primers were:
nLUC-F, 5′-AAAAGAGCTCATGGAAGACGCCAAAAACATAAAG;
nLUC-R, 5′-AAAAGAGCTCTTATCCATCCTTGTCAATCAAGGC;
cLUC-F, 5′-AAAAGAGCTCATTATGTCCGGTTATGTAAACAATCC; and
cLUC-R, 5′-AAAAGAGCTCTTACACGGCGATCTTTCCGC.
The 2,068bp TOC1 promoter region, 1,134bp CCA1 promoter region, and the 3,498bp SUC2 promoter region were amplified by PCR from Col-0 genomic DNA using the following primers:
TOC1-promoter-F, 5′- AAAAAAGCTTCTTCTCTGAGGAATTTCATCAAAC;
TOC1-promoter-R, 5′- AAAAAAGCTTGATCAGATTAACAACTAAACCCAC;
CCA1-promoter-F, 5′- AAAAAAGCTTATCAAAGGAGGAAGAAGAAG;
CCA1-promoter-R, 5′- AAAAAAGCTTCACTAAGCTCCTCTACAC;
SUC2-promoter-F, 5′- AAAAAAGCTTTTTGTCATACATTTATTTGCCACAAG; and
SUC2-promoter-R, 5′- AAAAAAGCTTATTTGACAAACCAAGAAAGTAAGAAAAAA.
The amplified fragments were cloned into the HindIII or SalI site of pPZP211/Jn, and pPZP211/Ac (TOC1::Jn, CCA1::Jn and SUC2::Ac).
These constructs were introduced into wild type, and transgenic plants were selected on plates containing kanamycin. T1 plants harboring Jn or Ac were crossed to establish plants for the TOC1/SUC2-TSLA, TOC1/CaMV 35S-TSLA, CCA1/SUC2-TSLA, CCA1/CaMV 35S-TSLA, and CaMV 35S/SUC2-TSLA.
For tissue-specific promoter (TSP)::CCA1-GFP constructs, the coding sequence of GFP was amplified by PCR using the following primers:
GFP-F, 5′- CCCGAGCTCATGGTGAGCAAGGGCGAGGA; and
GFP-R, 5′- CGACGAGCTCTTACTTGTACAGCTCGTCCA.
The amplified fragment was digested with SacI and cloned into pPZP211/NP/nosT (pPZP211/NP/GFP). The tissue-specific promoters used in a previous study were amplified by PCR using the following primers:
CCA1-promoter-F, 5′- AAAAAAGCTTATCAAAGGAGGAAGAAGAAG;
CCA1-promoter-R, 5′- AAAAAAGCTTCACTAAGCTCCTCTACAC;
CAB3-promoter-F, 5′- AAAACTCGAGGCCAAGTTCTATCTGTTTGTAA;
CAB3-promoter-R, 5′- AAAAGTCGACTGAAACTTTTTGTGTTTTTTTTTTTTTTTG;
SUC2-promoter-F, 5′- AAAAAAGCTTTTTGTCATACATTTATTTGCCACAAG;
SUC2-promoter-R, 5′- AAAAAAGCTTATTTGACAAACCAAGAAAGTAAGAAAAAA;
CER6-promoter-F, 5′- AAAAAAGCTTACTAAAAATTAAGGGAACTTGTC;
CER6-promoter-R, 5′- AAAAAAGCTTCGTCGGAGAGTTTTAATGTATAATTG;
UFO-promoter-F, 5′- AAAAAAGCTTACATATGTACTAGACGCAAATAATG;
UFO-promoter-R, 5′- AAAAAAGCTTTTTAGCTGAAAAATGAAAAGATTTGG;
TPS-CIN-promoter-F, 5′- AAAACTCGAGTTCCAACAAGGGCAGGAAATC; and
TPS-CIN-promoter-R, 5′- AAAAGTCGACTGATTTAGTAGACTATTCTCTTATTCGTGGC.
The amplified fragments were digested with HindIII (CCA1, SUC2, CER6, and UFO promoter) or XhoI/SalI (CAB3 and TPS-CIN promoter), and cloned into pPZP211/NP/GFP (pPZP211/NP/TSP-GFP).
Finally the coding sequence of CCA1 was amplified from the Col-0 cDNA library using the following PCR primers:
CCA1-F, 5′- AAAGGTACCATGGAGACAAATTCGTCTGG; and
CCA1-R, 5′- AAAAAGGTACCTGTGGAAGCTTGAGTTTCCAAC.
The amplified fragment was digested with KpnI and cloned into pPZP211/NP/TSP-GFP. The resulting constructs were introduced into wild type plants by Agrobacterium-mediated transformation. Transgenic plants were selected on agar plates containing 25 μg/mL kanamycin in the media.
Detection of bioluminescence
Two-week-old plants were sprayed with 2.5 mM luciferin (Biosynth) prepared in 0.005% (v/v) Triton X-100 (Sigma-Aldrich), and transferred to light/dark conditions one day before imaging. For photon counting, the emitted luminescence was recorded using a photomultiplier-tube-based bioluminescence monitoring system34. For luminescence imaging, the luminescence was observed using a LAS4000 system (Fujifilm).
Accession numbers
Sequence data from this article can be found in The Arabidopsis Information Resource (TAIR) databases under the following accession numbers: ACT2 (At3g18780), TUB5 (At1g20010), UBQ10 (At4g05320), APX3 (At4g35000), EF1α (At1g07940), IPP2 (At3g02780), ATX3 (At3g61740), RPT1a (At1g53750), TRX3 (At5g42980), APA1 (At1g11910), Lhcb2.1 (At2g05100), Sultr2;1 (At5g10180), GC1 (At1g22690), SUC2 (At1g22710), IRX3 (At5g17420), WOX4 (At1g46480), AtHB8 (At4g32880), COR15A (At2g42540), ADH1 (At1g77120), RD29A (At5g25310), ENODL9 (At3g20570), FT (At1g65480), CAB3 (At1g29910), CA1 (At3g01500), KAN1 (At5g16560), TOC1 (At5g61380), CCA1 (At2g46830), LHY (At1g01060), ELF3 (At2g25930), ELF4 (At2g40080), LUX (At3g46640), PRR7 (At5g02810), PRR9 (At2g46790), CER6 (At1g68530), UFO (At1g30950), and TPS-CIN (At3g25820 / At3g25830).
Extended Data
Extended Data Figure 1. Optimization and validation of gene expression analysis in isolated tissues.

a, b, Relationship between enzyme concentration and opacity of the enzyme solutions (a) or processing time for vasculature and epidermis isolation (b). Higher concentrations of enzyme (>2%) lead to lower handling ability during tissue isolation because of its opacity (gray box). Mean±SD (n=6). c, The expression levels of the 10 reference genes in whole leaves, mesophyll, and vasculature were detected under long day (LD) and short day (SD) conditions, and then the average expression stabilities M were calculated according to Vandesompele's method8. We chose ACTIN2 (ACT2), TUBULIN5 (TUB5), POLYUBIQUITIN10 (UBQ10), ELONGATION FACTOR1α (EF1α), ASCORBATE PEROXIDASE 3 (APX3)35, and ISOPENTENYL PYROPHOSPHATE:DIMETHYLALLYL PYROPHOSPHATE ISOMERASE 2 (IPP2)35 as commonly used reference genes, and we also chose ARABIDOPSIS TRITHORAX 3 (ATX3), REGULATORY PARTICLE TRIPLE-A 1A (RPT1a), THIOREDOXIN 3 (TRX3), and ASPARTIC PROTEINASE A1 (APA1) based on microarray analysis18. d, The expression of tissue-specific marker genes was detected in vasculature from plants grown under LD for 10 days. Sultr2;1 was used as a marker of phloem companion cell. WUSCHEL RELATED HOMEOBOX 4 (WOX4) and HOMEOBOX GENE 8 (AtHB8) were used as markers of procambium/cambium. IRREGULAR XYLEM 3 (IRX3) was used as a marker of xylem. Gene expression levels were calculated relative to Lhcb2.1 expression. e, Total RNA was extracted from 10 cotyledons and 10 vasculatures grown under LD for 10 days. Extracted RNA was quantified and RNA content per single cotyledon and vasculature was estimated. n=23. f, Expression of TOC1 and CCA1 in whole leaves, mesophyll, vasculature, and epidermis. Plants were grown under LD for 10 days, and whole leaves, mesophyll, vasculature, and epidermis were collected and/or isolated every four hours. g, The expression level of the stress-induced genes (COLD-REGULATED 15A (COR15A), ALCOHOL DEHYDROGENASE 1 (ADH1), and RESPONSIVE TO DESSICATION 29A (RD29A)) in isolated mesophyll and vasculature with or without 50 μg/ml of α-Amanitin (an inhibitor of RNA polymerase II). d, f, g, The geometric mean of APA1 and IPP2 was used as a control. Mean±SEM (n=3).
Extended Data Figure 2. Models used to identify cycling transcripts.

Models used in the HAYSTACK analysis were named Spike, Rigid, Cos, Mt, AsyMt1, AsyMt2, hBox, Box1, Box1.5, and Box2. All models are shifted in 1 h increments, and diel peak at ZT0 (black) and ZT2 (gray) are shown as examples. Underlined models were used in a previous study18.
Extended Data Figure 3. Number of cycling genes, percentage of adopted models, and relationship between amplitude and genes called cycling in each condition.

a, b, Number of genes that cycle under LD or SD in each tissue. c, Percentage of genes called cycling in a number of conditions. 4% of genes were not rhythmic in any condition. The remaining 96% of genes were broken down by the number of conditions for which they were called cycling. d, Frequency of model name adopted by the HAYSTACK analysis. Mt, AsyMt1, and AsyMt2 are integrated as Mt; and hBox, Box1, Box1.5, and Box2 are integrated as Box. e, Comparison of the percentage of genes called cycling versus genes not called cycling, by amplitude. Amplitude was estimated by dividing the maximum by the mean expression value across the time course.
Extended Data Figure 4. Validation of the sensitivity and specificity of the microarray analysis.

a, b, Expression profiles of mesophyll- (a) and vasculature-specific marker genes (b) under LD (left) and SD (right). CAB3, CARBONIC ANHYDRASE 1 (CA1)36, and KANADI 1 (KAN1) were applied as mesophyll markers. SUC2, FT, and EARLY NODULIN-LIKE PROTEIN 9 (ENODL9)37 were applied as vasculature markers. c, Diel and inter-tissue variations in the expression of the reference genes APA1 and IPP2.
Extended Data Figure 5. Relative gene expression levels, percentage of phase shift genes and percent of overlapping genes.

a, b, Relative gene expression levels in whole leaf, mesophyll, and vasculature under SD (a) and LD (b). The average expression level in vasculature at ZT16 (a) and ZT0 (b) was set to 0. Blue and green colored genes indicate higher and lower expression than average, respectively. c, Gene expression patterns of the PRR7, TOC1, and ELF4 in whole leaf, mesophyll, and vasculature under LD and SD. d, Percentage of genes showing a given phase shift when comparing two given tissues under LD and SD. Phase shifts plotted as positive are phase delay. e, Phase shift topology graph with phase shift of the target tissue on the y-axis and the reference tissue phase bin on the x-axis. Heatmap indicates percent of genes that are rhythmic between both conditions. f, Percentage of overlapping genes (POG) between any two tissues under LD and SD. The p-value resulting from the HAYSTACK analysis was used for gene ranking.
Extended Data Figure 6. Z-score profiles of cis-regulatory elements in each tissue.

Z-score profiles of the long day vasculature element (LVE), short day vasculature element (SVE), evening element (EE), Gbox, telo-box (TBX), starch box (SBX), and protein box (PBX) under LD and SD are shown. The horizontal dotted line indicates the threshold (FDR<1%).
Extended Data Figure 7. Luciferase complementation assay of TOC1/CaMV 35S-, TOC1/SUC2-, CCA1/CaMV 35S-, CCA1/SUC2-, and CaMV 35S/SUC2-TSLA.

a-c, Real time monitoring of the luminescence of 10-day-old TOC1/SUC2-TSLA #2 (n=9) and TOC1/CaMV 35S-TSLA #4 (n=12) (a), CCA1/SUC2-TSLA #11 (n=18) and CCA1/CaMV 35S-TSLA #1 (n=12) (b), and CaMV 35S/SUC2-TSLA #9 (n=12) (c) seedlings under L/D or free-running conditions. CT; circadian time. Signals after subtraction of background noise are shown. Mean±SD. cps; counts per second. cp30s; counts per 30 second. d, Period length of the TSLA lines shown in Fig. 3e, f and Extended Data Fig. 7a, b are calculated by the FFT-NLLS29. Mean±95% confidence interval.
Extended Data Figure 8. Clock genes expression in whole leaf and vasculature under L/D and continuous light free-running conditions.
a, Ratio between the amplitude in the vasculature with respect to amplitude in whole leaf extracted from Fig. 5a (V(Peak-Trough)/W(Peak-Trough))/ Mean±SEM. b, c, TOC1, ELF4, and CCA1 expression under L/D and free-running conditions in whole leaves (b) and vasculature (c). Plants were entrained for 5 days and shifted into continuous light condition for 1 week. ZT; Zeitgeber time. CT; circadian time. Mean±SD (n=3). To validate the robustness of each gene, the highest expression level in each gene in each tissue is set to 1. d, Ratio between the amplitude of TOC1::LUC with respect the amplitude of TOC1::LUC; SUC2::CCA1 #18 extracted from Fig. 5b. Mean±SEM.
Extended Data Figure 9. Organ- and tissue-specific expression of CCA1-GFP driven by tissue-specific promoters.

Expression levels of CCA1-GFP in a specific organ (a) and tissue (b). Plants were grown for 10 days under L/D condition and seedlings were separated into each organ and tissue at ZT0. Based on contamination rate obtained from Fig. 1d, cross-contamination adjusted signals were shown (b). For the CCA1-GFP detection, GFP expression was measured by qPCR and the geometric mean of APA1 and IPP2 was used as a control. The highest values are set as 1. Mean±SEM (n=3).
Supplementary Material
Acknowledgements
We thank H. Fukuda and Y. Sugisawa for processing raw microarray data; S. Yonehara for providing c-Jun and A-Fos plasmids; G. Breton, K. Hitomi, T. Oyama, T. Muranaka, and Y. Kondo for helpful advice; T. Koto, K. Katayama, and B.Y. Chow for technical assistance; J.A. Hejna and T.R. Endo for English proofreading. This work was supported by an HFSP long-term Fellowship LT00017/2008-L (to M.E.), a JST PRESTO 11103346 (to M.E.), JSPS KAKENHI grants 22770036 and 25650097 (to M.E.), a Sumitomo Foundation and Nakatani Foundation (to M.E.), Grants-in-Aid for Scientific Research on Priority Areas 19060012 and 19060016 (to T.A.), and National Institutes of Health (NIH) Grants R01 GM056006 and GM067837 (to S.A.K.). The content is solely the responsibility of the authors and does not necessarily represent the official views of the National Institutes of Health.
Footnotes
Author Contributions M.E. and S.A.K. planned the experiments. M.E. and H.S. performed experiments. M.E., M.A.N., T.A., and S.A.K wrote the manuscript. All authors discussed the results and commented on the manuscript.
All microarray data are available from the Gene Expression Omnibus database (http://www.ncbi.nlm.nih.gov/geo) under accession code GSE50438. The authors declare no competing financial interests.
References
- 1.Barclay JL, Tsang AH, Oster H. Interaction of central and peripheral clocks in physiological regulation. Prog. Brain Res. 2012;199:163–181. doi: 10.1016/B978-0-444-59427-3.00030-7. [DOI] [PubMed] [Google Scholar]
- 2.Mohawk JA, Green CB, Takahashi JS. Central and peripheral circadian clocks in mammals. Annu. Rev. Neurosci. 2012;35:445–462. doi: 10.1146/annurev-neuro-060909-153128. [DOI] [PMC free article] [PubMed] [Google Scholar]
- 3.Thain SC, Hall A, Millar AJ. Functional independence of circadian clocks that regulate plant gene expression. Curr. Biol. 2000;10:951–956. doi: 10.1016/s0960-9822(00)00630-8. [DOI] [PubMed] [Google Scholar]
- 4.James AB, et al. The circadian clock in Arabidopsis roots is a simplified slave version of the clock in shoots. Science. 2008;322:1832–1835. doi: 10.1126/science.1161403. [DOI] [PubMed] [Google Scholar]
- 5.Para A, et al. PRR3 Is a vascular regulator of TOC1 stability in the Arabidopsis circadian clock. Plant Cell. 2007;19:3462–3473. doi: 10.1105/tpc.107.054775. [DOI] [PMC free article] [PubMed] [Google Scholar]
- 6.Fukuda H, Nakamichi N, Hisatsune M, Murase H, Mizuno T. Synchronization of plant circadian oscillators with a phase delay effect of the vein network. Phys. Rev. Lett. 2007;99:098102. doi: 10.1103/PhysRevLett.99.098102. [DOI] [PubMed] [Google Scholar]
- 7.Wenden B, Toner DL, Hodge SK, Grima R, Millar AJ. Spontaneous spatiotemporal waves of gene expression from biological clocks in the leaf. Proc. Natl Acad. Sci. USA. 2012;109:6757–6762. doi: 10.1073/pnas.1118814109. [DOI] [PMC free article] [PubMed] [Google Scholar]
- 8.Vandesompele J, et al. Accurate normalization of real-time quantitative RT-PCR data by geometric averaging of multiple internal control genes. Genome Biol. 2002:RESEARCH0034. doi: 10.1186/gb-2002-3-7-research0034. [DOI] [PMC free article] [PubMed] [Google Scholar]
- 9.Sawchuk MG, Donner TJ, Head P, Scarpella E. Unique and overlapping expression patterns among members of photosynthesis-associated nuclear gene families in Arabidopsis. Plant Physiol. 2008;148:1908–1924. doi: 10.1104/pp.108.126946. [DOI] [PMC free article] [PubMed] [Google Scholar]
- 10.Takahashi H, et al. The roles of three functional sulphate transporters involved in uptake and translocation of sulphate in Arabidopsis thaliana. Plant J. 2000;23:171–182. doi: 10.1046/j.1365-313x.2000.00768.x. [DOI] [PubMed] [Google Scholar]
- 11.Yang Y, Costa A, Leonhardt N, Siegel RS, Schroeder JI. Isolation of a strong Arabidopsis guard cell promoter and its potential as a research tool. Plant Methods. 2008;4:6. doi: 10.1186/1746-4811-4-6. [DOI] [PMC free article] [PubMed] [Google Scholar]
- 12.Caño-Delgado A, Lee JY, Demura T. Regulatory mechanisms for specification and patterning of plant vascular tissues. Annu. Rev. Cell Dev. Biol. 2010;26:605–637. doi: 10.1146/annurev-cellbio-100109-104107. [DOI] [PubMed] [Google Scholar]
- 13.Mockler TC, et al. The DIURNAL project: DIURNAL and circadian expression profiling, model-based pattern matching, and promoter analysis. Cold Spring Harb. Symp. Quant. Biol. 2007;72:353–363. doi: 10.1101/sqb.2007.72.006. [DOI] [PubMed] [Google Scholar]
- 14.Pokhilko A, Mas P, Millar AJ. Modelling the widespread effects of TOC1 signalling on the plant circadian clock and its outputs. BMC Syst. Biol. 2013;7:23. doi: 10.1186/1752-0509-7-23. [DOI] [PMC free article] [PubMed] [Google Scholar]
- 15.Nagel DH, Kay SA. Complexity in the wiring and regulation of plant circadian networks. Curr. Biol. 2012;22:R648–657. doi: 10.1016/j.cub.2012.07.025. [DOI] [PMC free article] [PubMed] [Google Scholar]
- 16.Nusinow DA, et al. The ELF4-ELF3-LUX complex links the circadian clock to diurnal control of hypocotyl growth. Nature. 2011;475:398–402. doi: 10.1038/nature10182. [DOI] [PMC free article] [PubMed] [Google Scholar]
- 17.Herrero E, et al. EARLY FLOWERING4 recruitment of EARLY FLOWERING3 in the nucleus sustains the Arabidopsis circadian clock. Plant Cell. 2012;24:428–443. doi: 10.1105/tpc.111.093807. [DOI] [PMC free article] [PubMed] [Google Scholar]
- 18.Michael TP, et al. Network discovery pipeline elucidates conserved time-of-day-specific cis-regulatory modules. PLoS Genet. 2008;4:e14. doi: 10.1371/journal.pgen.0040014. doi:10.1371/journal.pgen.0040014. [DOI] [PMC free article] [PubMed] [Google Scholar]
- 19.Meireles-Filho AC, Bardet AF, Yáñez-Cuna JO, Stampfel G, Stark A. cis-Regulatory Requirements for Tissue-Specific Programs of the Circadian Clock. Curr. Biol. 2013;24:1–10. doi: 10.1016/j.cub.2013.11.017. [DOI] [PubMed] [Google Scholar]
- 20.Paulmurugan R, Umezawa Y, Gambhir SS. Noninvasive imaging of protein-protein interactions in living subjects by using reporter protein complementation and reconstitution strategies. Proc. Natl Acad. Sci. USA. 2002;99:15608–15613. doi: 10.1073/pnas.242594299. [DOI] [PMC free article] [PubMed] [Google Scholar]
- 21.Olive M, et al. A dominant negative to activation protein-1 (AP1) that abolishes DNA binding and inhibits oncogenesis. J. Biol. Chem. 1997;272:18586–18594. doi: 10.1074/jbc.272.30.18586. [DOI] [PubMed] [Google Scholar]
- 22.Endo M, Mochizuki N, Suzuki T, Nagatani A. CRYPTOCHROME2 in vascular bundles regulates flowering in Arabidopsis. Plant Cell. 2007;19:84–93. doi: 10.1105/tpc.106.048157. [DOI] [PMC free article] [PubMed] [Google Scholar]
- 23.Ranjan A, Fiene G, Fackendahl P, Hoecker U. The Arabidopsis repressor of light signaling SPA1 acts in the phloem to regulate seedling de-etiolation, leaf expansion and flowering time. Development. 2011;138:1851–1862. doi: 10.1242/dev.061036. [DOI] [PubMed] [Google Scholar]
- 24.Imaizumi T. Arabidopsis circadian clock and photoperiodism: time to think about location. Curr. Opin. Plant Biol. 2010;13:83–89. doi: 10.1016/j.pbi.2009.09.007. [DOI] [PMC free article] [PubMed] [Google Scholar]
- 25.Kozuka T, Kong SG, Doi M, Shimazaki K, Nagatani A. Tissue-autonomous promotion of palisade cell development by phototropin 2 in Arabidopsis. Plant Cell. 2011;23:3684–3695. doi: 10.1105/tpc.111.085852. [DOI] [PMC free article] [PubMed] [Google Scholar]
- 26.Kardailsky I, et al. Activation tagging of the floral inducer FT. Science. 1999;286:1962–1965. doi: 10.1126/science.286.5446.1962. [DOI] [PubMed] [Google Scholar]
- 27.Kobayashi Y, Kaya H, Goto K, Iwabuchi M, Araki T. A pair of related genes with antagonistic roles in mediating flowering signals. Science. 1999;286:1960–1962. doi: 10.1126/science.286.5446.1960. [DOI] [PubMed] [Google Scholar]
- 28.Stoleru D, et al. The Drosophila circadian network is a seasonal timer. Cell. 2007;129:207–219. doi: 10.1016/j.cell.2007.02.038. [DOI] [PubMed] [Google Scholar]
- 29.Plautz JD, et al. Quantitative analysis of Drosophila period gene transcription in living animals. J Biol Rhythms. 1997;12:204–217. doi: 10.1177/074873049701200302. [DOI] [PubMed] [Google Scholar]
- 30.Endo M, Nakamura S, Araki T, Mochizuki N, Nagatani A. Phytochrome B in the mesophyll delays flowering by suppressing FLOWERING LOCUS T expression in Arabidopsis vascular bundles. Plant Cell. 2005;17:1941–1952. doi: 10.1105/tpc.105.032342. [DOI] [PMC free article] [PubMed] [Google Scholar]
- 31.Wu Z, Irizarry RA, Gentleman R, Murillo FM, Spencer F. A Model Based Background Adjustment for Oligonucleotide Expression Arrays: Technical Report; Johns Hopkins University Department of Biostatistics Working Paper No. 1; 2003; Baltimore: Department of Biostatistics, Johns Hopkins Univ.; [Google Scholar]
- 32.Shimada TL, Shimada T, Hara-Nishimura I. A rapid and non-destructive screenable marker, FAST, for identifying transformed seeds of Arabidopsis thaliana. Plant J. doi: 10.1111/j.1365-313X.2009.04060.x. [DOI] [PubMed] [Google Scholar]
- 33.Nishimura T, Yokota E, Wada T, Shimmen T, Okada K. An Arabidopsis ACT2 dominant-negative mutation, which disturbs F-actin polymerization, reveals its distinctive function in root development. Plant Cell Physiol. 2003;44:1131–1140. doi: 10.1093/pcp/pcg158. [DOI] [PubMed] [Google Scholar]
- 34.Golden SS, Ishiura M, Johnson CH, Kondo T. Cyanobacterial circadian rhythms. Annu. Rev. Plant Physiol. Plant Mol. Biol. 1997;48:327–354. doi: 10.1146/annurev.arplant.48.1.327. [DOI] [PubMed] [Google Scholar]
- 35.Hazen SP, et al. LUX ARRHYTHMO encodes a Myb domain protein essential for circadian rhythms. Proc. Natl Acad. Sci. USA. 2005;102:10387–10392. doi: 10.1073/pnas.0503029102. [DOI] [PMC free article] [PubMed] [Google Scholar]
- 36.Kerk NM, Ceserani T, Tausta SL, Sussex IM, Nelson TM. Laser capture microdissection of cells from plant tissues. Plant Physiol. 2003;132:27–35. doi: 10.1104/pp.102.018127. [DOI] [PMC free article] [PubMed] [Google Scholar]
- 37.Khan JA, Wang Q, Sjölund RD, Schulz A, Thompson GA. An early nodulin-like protein accumulates in the sieve element plasma membrane of Arabidopsis. Plant Physiol. 2007;143:1576–1589. doi: 10.1104/pp.106.092296. [DOI] [PMC free article] [PubMed] [Google Scholar]
Associated Data
This section collects any data citations, data availability statements, or supplementary materials included in this article.