

Abstract
Gastric diseases, including peptic ulcer disease and gastric cancer, affect 10% of the world’s population and are largely due to chronic H. pylori infection1–3. Species differences in embryonic development and architecture of the adult stomach make animal models suboptimal for studying human stomach organogenesis and pathogenesis4, and there is no experimental model of normal human gastric mucosa. Here we report the de novo generation of three-dimensional human gastric tissue in vitro through the directed differentiation of human pluripotent stem cells (hPSCs). We identified that temporal manipulation of the FGF, WNT, BMP, retinoic acid and EGF signaling pathways and three-dimensional growth are sufficient to generate human gastric organoids (hGOs). Developing hGOs progressed through molecular and morphogenetic stages that were nearly identical to the developing antrum of the mouse stomach. Organoids formed primitive gastric gland- and pit-like domains, proliferative zones containing LGR5-expressing cells, surface and antral mucous cells, and a diversity of gastric endocrine cells. We used hGO cultures to identify novel signaling mechanisms that regulate early endoderm patterning and gastric endocrine cell differentiation upstream of the transcription factor NEUROG3. Using hGOs to model pathogenesis of human disease, we found that H. pylori infection resulted in rapid association of the virulence factor CagA with the c-Met receptor, activation of signaling and induction of epithelial proliferation. Together, these studies describe a novel and robust in vitro system for elucidating the mechanisms underlying human stomach development and disease.
Keywords: organoid, progenitor cell, foregut endoderm, stomach, pylorus, BMP, gastric cancer
The human stomach contains a complex, three-dimensional glandular epithelium that is organized into two distinct functional domains5; the fundus (corpus), which is the major source of peptidases and acid, and the antrum (pylorus) that comprises a concentration of mucus-secreting cells and hormone-producing endocrine cells. Unlike other endoderm organs, little is known about signaling pathways regulating gastric development and no one has yet generated gastric tissues from human pluripotent stem cells (hPSCs)6–8. Therefore, to direct differentiation of hPSCs into complex, three-dimensional gastric tissue, we needed to identify the signaling pathways that regulate several critical stages of early stomach development including; 1) posterior foregut specification and formation of the anterior gut tube, 2) gastric specification and patterning into the fundus or antrum, and 3) epithelial growth, morphogenesis, and differentiation into gastric cell lineages.
We first differentiated hPSCs into definitive endoderm (DE)9, which in vivo is then patterned along the anterior-to-posterior (A–P) axis and transformed into a gut tube consisting of Sox2+ foregut in the anterior and Cdx2+ mid-hindgut in the posterior (Fig. 1a). We previously demonstrated that WNT3A and FGF4 synergize to induce the morphogenesis of gut tube-like structures expressing the posterior marker CDX26,10. To generate foregut, from which the stomach derives, we aimed to stimulate gut tube morphogenesis with WNT and FGF while inhibiting their ability to promote posterior fate. We found that WNT/FGF require BMP activity to initiate posterior gene expression, consistent with the known role of BMP as a posteriorizing factor11–13. Specifically, inhibiting BMP signaling with the antagonist Noggin resulted in repression of the posterior marker CDX2, activation of the foregut marker SOX2 and assembly of three-dimensional foregut spheroids (Fig. 1b–d and Extended Data Fig. 1). Foregut spheroid morphogenesis was a robust process using both hESC and hiPSC lines (Fig. 1c–d and Extended Data Fig. 2). Thus, we identified a new epistatic relationship between WNT, FGF and BMP in which all three pathways cooperate to promote a mid-hindgut fate, but WNT and FGF act separately from BMP to drive morphogenesis of gut tube structures.
Figure 1. Generation of three-dimensional posterior foregut spheroids.

a, Sox2 marks foregut endoderm and Cdx2 marks mid/hindgut endoderm in E8.5 (14 somite stage) mouse embryo. b–c, qPCR analysis (b) and wholemount immunostaining (c) for patterning markers in hPSC-DE cultures exposed to three days in media alone (control) or with the indicated growth factors/antagonists. WNT3A and FGF4 induced CDX2 expression whereas the BMP antagonist noggin repressed CDX2 and induced high levels of the foregut marker SOX2. Results are normalized to expression in Control (stage-matched, no growth factor-treated) endoderm. *, p<0.05 compared to control. **, p<0.005 compared to WNT/FGF; two-tailed student’s t-test; n=3 biological replicates per condition, data representative of 6 independent experiments. d, Quantitation of SOX2- and CDX2-expressing cells in day 6 spheroids generated in hindgut (WNT/FGF4) and foregut (WNT/FGF4/Noggin) patterning conditions. Data are expressed as the percentage of cells expressing indicated markers, normalized to the total number of cells in the spheroids. *, p<1.0×10⁻⁶; two-tailed student’s t-test; n=5 biological replicates per condition, data representative of 3 independent experiments. e, The posterior foregut in the E8.5 mouse embryo expressed both Sox2 and Hnf1β. f–g, Exposing cultures to RA on the final day of the spheroid generation step induced expression of HNF1β in SOX2-expressing epithelium, measured by both qPCR (f) and wholemount immunofluorescent staining (g), indicating the formation of posterior foregut spheroids. *, p<0.005; two-tailed student’s t-test; n=3 biological replicates per condition, data representative of 3 independent experiments. Scale bars, 100 μm in a and e, 50 μm in c and g. Error bars represent standard deviation.
The following events of stomach development in vivo are posterior patterning of the foregut and specification of the fundic and antral domains of the stomach. To direct spheroids into a posterior foregut fate (indicated by co-expression of Sox2 and Hnf1β; Fig. 1e), we focused on retinoic acid (RA) signaling given its role in development of posterior foregut-derived organs14–16. Exposing DE to RA for 24 hours on the final day (d5-6) of the patterning/spheroid generation stage resulted in the formation of SOX2/HNF1β+ posterior foregut spheroids (Fig. 1f–g and Extended Data Fig. 3). In vivo the posterior foregut undergoes morphogenesis and is subdivided into the Sox2+/Pdx1− fundus, Sox2/Pdx1+ antrum, Pdx1/Ptf1α+ pancreas, and Pdx1/Cdx2+ duodenum (Fig. 2b). To promote three-dimensional growth and morphogenesis, we transferred posterior foregut spheroids to a semisolid matrix and found that an additional 72 hours of RA (d6-9) caused a >100-fold increase in PDX1 mRNA levels while maintaining high SOX2 expression (Fig. 2c–d), indicating specification into antrum. Importantly, the RA treatment did not promote a pancreatic fate8, since expression of the pancreas-specific marker PTF1α17 was not induced (Fig. 2d). These data demonstrate that the combination of RA signaling with three-dimensional growth efficiently direct posterior foregut spheroids into a SOX2/PDX1+ epithelium indicative of a gastric antrum fate.
Figure 2. Specification and growth of human antral gastric organoids.

a, Schematic representation of the in vitro culture system used to direct the differentiation of hPSCs into three-dimensional gastric organoids. b, Defining molecular domains of the posterior foregut in E10.5 mouse embryos with Sox2, Pdx1 and Cdx2; Sox2/Pdx1, antrum (a); Sox2, fundus (f); Pdx1, dorsal and ventral pancreas (dp and vp); Pdx1/Cdx2, duodenum (d). c, Posterior foregut spheroids exposed for three days to RA (2 μM) exhibited >100-fold induction of PDX1 compared to control spheroids, measured by qPCR. *, p<0.05; two-tailed student’s t-test; n=3 biological replicates per condition, data representative of 4 independent experiments. d, Time course qPCR analysis of antral differentiation (according to protocol detailed in figure 2a) demonstrated sequential activation of SOX2 at day 6 (posterior foregut endoderm), followed by induction of PDX1 at day 9 (presumptive antrum). Day 9 antral spheroids had a 500-fold increase in SOX2 and a 10,000-fold increase in PDX1 relative to day 3 DE. *, p<0.05; two-tailed student’s t-test; n=3 biological replicates per timepoint, data representative of 2 independent experiments. The pancreatic marker PTF1A was not significantly increased. e, Stereomicrographs showing morphological changes during growth of gastric organoids. By four weeks, the epithelium of hGOs exhibited a complex folded and glandular architecture (arrows). f, Comparison of mouse stomach at E18.5 and 34-day hGOs. Pdx1 was highly expressed in the mouse antrum but excluded from the fundus. hGOs expressed PDX1 throughout the epithelium and exhibited morphology similar to the late gestational mouse antrum (arrows). Scale bars, 100 μm in b and f, 250 μm in e. Error bars represent standard deviation.
The next stages of stomach development are characterized by growth of a pseudostratified epithelium into an elaborate glandular epithelium. We explored various growth conditions and found that high concentrations of EGF (100 ng mL−1) were sufficient to promote robust outgrowth of SOX2/PDX1+ spheroids into human gastric organoids (hGOs). Over the course of 3–4 weeks, spheroids (<100 μm in diameter) underwent dramatic expansion into organoids (2–4 mm in diameter) containing a complex columnar epithelium (Fig. 2e). EGF was required for the initial outgrowth of foregut spheroids as well as their expansion and morphogenesis at later stages (Extended Data Fig. 4c), revealing a new role for EGFR signaling during embryonic stomach formation that is temporally distinct from its postnatal function as a trophic factor18,19. hGO development was remarkably similar to in vivo stomach organogenesis. At early stages (E12-14 in mouse and 13-day hGOs), both epithelia were pseudostratified, contained mitotic nuclei concentrated toward the apical surface indicating interkinetic nuclear migration, and were appropriately polarized and contained deep elaborations of aPKC+ apical membrane (Extended Data Fig. 4b)20. At later stages (E16.5 – P12 in mouse, d13-34 in hGOs), the in vivo antrum transformed into a simple columnar epithelium exhibiting a highly structured organization, and the hGOs underwent similar folding and formed immature pit and gland domains (Fig. 2e–f and Extended Data Fig. 4a).
Figure 4. Human gastric organoids exhibit acute responses to H. pylori infection.

a, Day 34 hGOs contained a zone of MKI67+ proliferative cells similar to the embryonic (E18.5) and postnatal (P12) mouse antrum. b, Using hGOs to model human-specific disease processes of H. pylori infection. Pathogenic (G27) and attenuated (ΔCagA) bacteria were microinjected into the lumen of hGOs and after 24 hours, bacteria (both G27 and ΔCagA strains) were tightly associated with the apical surface of the hGO epithelium. c, Immunoprecipitation (IP) for the oncogene c-MET demonstrates that H. pylori induced a robust activation (tyrosine phosphorylation) of c-MET, and this is a CagA-dependent process. Further, CagA immunoprecipiated with c-MET, suggesting these proteins interact in hGO epithelial cells. Lysates that were immunoprecipitated are underlined, phospho-c-met and CagA control lysates were not immunoprecipitated but used to confirm molecular weights. The molecular weight markers are indicated (130 and 170kd) and shown in extended figure 9c. d, Within 24 hours, H. pylori infection caused a CagA-dependent two-fold increase in the number of proliferating cells in the hGO epithelium, measured by EdU incorporation. *, p<0.05; two-tailed student’s t-test; n=3 biological replicates per condition, data representative of 4 independent experiments. Scale bars, 100 μm in a, 20 μm in b. Error bars represent s.e.m.
Molecular markers that define the developing antrum in vivo showed analogous temporal and spatial expression patterns in developing hGOs. At early stages (E12-14 in mouse and 13-day hGOs) the transcription factors Sox2, Pdx1, Gata4 and Klf5 were all co-expressed in the immature, pseudostratified epithelium of the antrum (Extended Data Fig. 4). However at later stages (E18-P12 in mouse and 34-day hGOs), Sox2 was down regulated as the epithelium formed glands and pits, whereas the expression of the other factors was maintained. Based on these data, the 13-day hGOs represent a developmental stage similar to the E12-14 mouse antrum, whereas 34-day hGOs are more comparable to the late fetal-early postnatal antrum. Further, the early spheroid mesoderm expanded during organoid differentiation, expressed mesenchymal transcription factors including FOXF1 and BAPX121, and differentiated into VIM+ submucosal fibroblasts and a smaller number of ACTA2+ subepithelial myofibroblasts (Extended Data Fig. 4–5). Thus, we conclude that hGOs recapitulate normal embryonic development and that the molecular and morphogenetic processes that occur during antrum development are conserved between rodents and humans.
RNA-sequencing analysis showed that 34-day organoids and human fetal stomach tissue share a highly similar transcriptional profile, which is distinct from human fetal intestine (Extended Data Fig. 6b). The antral region in the embryonic and postnatal stomach can be distinguished from the fundus by its expression of PDX1 (Fig. 2f), as well as by a concentration of certain cell types. Antral cell types include mucous cells, which secrete the protective mucus lining, and several endocrine lineages that regulate gastrointestinal physiology and metabolic homeostasis (Fig. 3a). By day 27, hGOs robustly expressed numerous transcripts that mark differentiated antral cell types (Extended Data Fig. 6a), including surface mucous cells (MUC5AC, TFF1/3, and GKN1) and antral gland cells (TFF2), but not cell types associated with the fundus/corpus such as parietal cells (ATP4A/B) and chief cells (MIST1), or intestinal goblet cells (MUC2). At day 34, histological analysis revealed that both mucous cell lineages were abundant in the hGOs (Fig. 3b–f): surface mucous cells with tall columnar morphology and apical MUC5AC expression, and MUC6+ antral gland cells that were concentrated toward the base of the glands. Parietal cells (ATP4B) were undetectable in the hGOs, and the lack of fundus cell types coupled with ubiquitous PDX1 expression are consistent with an antral identity (Fig. 2 and Extended Data Fig. 4). The adult antrum contains pure glands with only antral lineages and mixed glands containing both antral and fundic lineages22. However, PDX1 expression remains restricted to antral cell types even in mixed glands22, suggesting the possibility that PDX1+-progenitor cells only give rise to antrum-specific cell types postnatally. Thus we conclude that the PDX1-expressing hGOs are a pure antrum/pylorus cell population.
Figure 3. Human gastric organoids contain differentiated antral cell types.

a, Schematic representation of a typical antral gland showing normal cell types and associated molecular markers. b–g, Immunofluorescent staining demonstrated that 34-day hGOs consisted of normal cell types found in the antrum, but not the fundus. The hGO epithelium contained surface mucous cells that express MUC5AC (b1, b1′), similar to the postnatal day 12 (P12) mouse antrum (b2, b2′), but not ATP4B-expressing parietal cells (c1, c1′) that characterize the fundus (c2, c2′). SOX9+ cells were found at the base of the hGO epithelium (d1, d1′), similar to the progenitor cells found in the P12 antrum (d2, d2′). Further, hGOs contained MUC6+ antral gland cells (e) and LGR5-expressing cells (f). Boxed regions in b–f are shown as high magnification images indicated by an apostrophe (’). g, Day 34 hGOs also contained endocrine cells (SYP) that expressed the gastric hormones GAST, SST, GHRL, and serotonin (5-HT). Scale bars, 100 μm in b–f, 20 μm in b′–f′ and g. Marker expression data are representative from a minimum of 10 independent experiments, except LGR5-GFP data, which is a representative example from two separate experiments.
The antrum also contains LGR5-expressing stem cells23 and specialized endocrine cells. At 34 days, hGOs contained a SOX9+ proliferative progenitor zone as well as LGR5+ cells at the base of the glands (Fig. 3d–f and Fig. 4a), identified using a transgenic LGR5:eGFP reporter hESC line (Extended Data Fig. 7). hGOs contained a complete spectrum of endocrine cells normally found in the antrum that were positive for the hormones gastrin, ghrelin, somatostatin, and serotonin (Fig. 3g). Interestingly, we observed that high levels of EGF repressed expression of the proendocrine transcription factor NEUROG324,25 and the formation of endocrine cells, whereas low EGF (10 ng ml−1) supported endocrine cell formation (Extended Data Fig. 8b–d). Transient over-expression of NEUROG3 was sufficient to overcome the endocrine inhibitory effect of EGF, resulting in robust differentiation of gastric endocrine cells (Extended Data Fig. 8e–g). In summary, hGOs have a high degree of cellular complexity that rivals that of the human antrum, they can be experimentally manipulated, and they therefore represent the first in vitro model of human stomach development.
Clinical evidence indicates that predominant colonization of the antrum has an important role in H. pylori-mediated disease26,27. Thus, we tested whether hGOs could be used to model the pathophysiologic response of human stomach to H. pylori. To mimic the normal host-pathogen interface, we microinjected H. pylori directly into the lumen of the epithelium and measured epithelial signaling and proliferation. Within 24 hours, bacteria were observed tightly associated with the hGO epithelium (Fig. 4a and Extended Data Fig. 9b) and we observed significant epithelial responses including robust phosphorylation c-Met28 (Fig. 4b, Extended Data Fig. 9c) and a 2-fold increase in epithelial cell proliferation (Fig. 4c). The H. pylori virulence factor CagA plays a pivotal role in the etiology of disease. Consistent with published studies29, we observed that CagA translocated into organoid epithelial cells and formed a complex with the c-Met receptor (Fig. 4b). Furthermore, the epithelial response was lost when hGOs were injected with a strain of H. pylori lacking CagA, demonstrating the dependence of CagA for H. pylori-mediated human pathogenesis. Thus, the pathophysiological response of hGOs makes them an unprecedented model for elucidating the initiating events of human gastric disease mediated by H. pylori.
In summary, hGOs represent the first human gastric tissue fully derived in vitro and are one of the most physiologically complex micro-organ systems yet established. The hGOs undergo normal stages of in vivo differentiation, comprise an array of cell types that constitute the normal antral epithelium, and contain a complex three-dimensional organization. We have used hGOs as an in vitro system to identify signaling mechanisms that regulate human stomach development and physiology, and we have modeled the pathophysiological response of the gastric epithelium to H. pylori. Thus hGOs should present new opportunities for drug discovery and modeling early stages of gastric disease including cancer. Moreover, this is the first three-dimensional production of a human embryonic foregut, which is a promising starting point for the 3-dimentional generation of other foregut organ tissues including fundus, lungs and pancreas.
Methods
Pluripotent stem cell culture
Human embryonic stem cell lines WA01 (H1) and WA09 (H9) were obtained from WiCell. ESC and iPSC lines were maintained as colonies in feeder-free conditions on HESC-qualified Matrigel (BD Biosciences) in mTesR1 media (Stem Cell Technologies). Cells were routinely passaged every four days with dispase (Invitrogen).
Differentiation of definitive endoderm
For differentiation, PSCs were plated as single cells in a Matrigel-coated 24-well dish using accutase (Stem Cell Technologies), at a density of 150,000 cells per well in mTesR1 with ROCK inhibitor Y-27632 (10 μM; Stemgent). On the following day, PSCs were differentiated to DE as previously described9,31. Cells were exposed to Activin A (100 ng ml−1; Cell Guidance Systems) for three days in RPMI 1640 media (Invitrogen) containing increasing concentrations of 0%, 0.2%, and 2.0% define fetal bovine serum (dFBS; Invitrogen). In addition, BMP4 (50 ng ml−1; R&D Systems) was added on the first day of DE induction.
Endoderm patterning and foregut spheroid generation
Following DE induction, cells were cultured in RPMI 1640 media with 2.0% dFBS and the indicated combinations of growth factors and/or chemical agonist: WNT3A (500 ng ml−1; R&D Systems), CHIR99021 (2 μM; Stemgent); FGF4 (500 ng ml−1; R&D Systems), and Noggin (200 ng ml−1; R&D Systems). The media was changed every day. After three days, the combination of WNT3A (or CHIR99021), FGF4, and Noggin resulted in floating foregut spheroids in the culture wells. To posteriorize the foregut endoderm, RA (2 μM; Sigma Aldrich) was added on the third day of WNT/FGF/Noggin treatment.
Three-dimensional culture of gastric organoids
The spheroids were transferred to a three-dimensional in vitro culture system as previously described6,10. Briefly, spheroids were collected, resuspended in 50 μl Matrigel (BD Biosciences), and plated in a three-dimensional droplet. After Matrigel was allowed to solidify for 10–15 minutes in a tissue culture incubator, spheroids were overlaid with gut media: Advanced DMEM/F12 with N2 (Invitrogen), B27 (Invitrogen), L-glutamine, 10 μM HEPES, penicillin/streptomycin, and EGF (100 ng ml−1; R&D Systems). For the first three days, RA and Noggin were added to the gut media. Media was replaced every 3–4 days, as necessary. At day 20, organoids were collected and re-plated in fresh Matrigel at dilution of ~1:12.
Generation of dox-inducible hNEUROG3 hESC line
To generate over-expression construct, hNEUROG3 cDNA (Dana-Farber/Harvard Cancer Center DNA Resource Core; clone HsCD00345898) was cloned into pInducer20 lentiviral vector (generously provided by T. Westbrook32) using Gateway Cloning (Invitrogen) methods. High-titer lentiviral particles were produced by the CCHMC Viral Vector Core. H1 hESCs were dissociated with Accutase, plated as a single cell suspension in mTesR1 with 10 μM Y-27632, and exposed to lentivirus for four hours. mTesR1 was replaced daily and after two days, G418 (200 μg ml−1) was added to the media to select for integrated clones. G418-resistant cells were maintained in antibiotic indefinitely, but were otherwise cultured and passaged normally.
Generation of LGR5:eGFP BAC transgenic reporter hESC line
BAC RP11-59F15 was obtained from the Children’s Hospital Oakland Research Institute (http://bacpac.chori.org/) and grown in SW10533 cells. A single colony was expanded in LB +cam at 32°C. When the culture reached an optical density of OD600=0.5, recombineering proteins were induced by incubation at 42°C for 20 minutes. After induction, cells were spun at 5,000 × g, washed in ice cold water, and resuspended in 200 μl ice cold 10% glycerol. The recombination cassette consisted of eGFP-FRT-PGKgb2-neo/kan-FRT, 50 bp homology region in LGR5, and a 20 bp homology region to peGFP-PGKneo. The homology regions were selected to replace the initiator methionine of LGR5 with that of eGFP followed by a bovine growth hormone polyadenylation signal and FRT flanked bifunctional kanamycin/G418 resistance cassette. The recombination cassette was electroporated into SW105 cells, and cells were selected on plates with cam and kanamycin (kan; 50 μg ml−1). Clones were analyzed for properly targeted LGR5 BAC by PCR (sequences listed in Methods Table 3) and confirmed by sequencing and nucleofected into single cell suspensions of H9 hESCs using the Amaxa Human Stem Cell Nucleofector Starter Kit. Cells were selected for in G418 (200 ng ml−1) for two weeks. G418-resistant cells were maintained in antibiotic indefinitely. All primer sequences are listed in Methods Table 3.
Generation and characterization of iPSC lines
Primary human foreskin fibroblasts (HFFs) were cultured from neonatal human foreskin tissue and obtained from 2 donors through the Department of Dermatology, University of Cincinnati, and were a kind gift from Susanne Wells PhD. HFFs were cultured in Fibroblast Media consisting of DMEM (Invitrogen) supplemented with 10% FCS (Hyclone) and used for reprogramming between passages 5 and 8. EBNA1/OriP-based episomal plasmids pCLXE-hOct3/4-shp53, pCLXE-hSox2-Klf4, pCLXE-hLmyc-Lin28, and pCLXE-GFP used for this study were previously described34 and obtained from Addgene (ID #s: 27077, 27078, 27080, and 27082 respectively). The optimized Human Dermal Fibroblast Nucleofector Kit (VPD-1001; Lonza) was used for transfection of HFFs with episomal plasmids. Briefly, for each transfection 1 × 10⁶ HFFs were pelleted by centrifugation at 200xg for 10 minutes at room temperature, resuspended in 100 μl room temperature Nucleofector Solution and nucleofected with 1.25 μg each episomal plasmid (program U20). Cells from 2 transfections (2 × 10⁶ total cells) were replated in a 10 cm tissue culture plate in Fibroblast Media, and cultured at 37°C/5% CO2. Six days post-transfection, 4.5 × 10⁵ HFFs were replated in Fibroblast Media in a gelatin-coated 10cm dish containing 1.07 × 10⁶ irradiated mouse embryonic fibroblasts (MEFs). Starting on day 7 post-transfection, cells were fed daily with DMEM/F12 media supplemented with 20% knockout serum replacement, 1 mM L-glutamine, 0.1 mM β-mercaptoethanol, 0.1 mM non-essential amino acids, and 4 ng ml−1 basic FGF (all from Invitrogen). Approximately 2 weeks later, discrete colonies with hESC-like morphology were manually excised and replated in mTeSR1 media (Stem Cell Technologies) in tissue culture dishes coated with hESC-qualified matrigel (Becton Dickinson). Following adaptation to mTeSR1/matrigel culture, iPSCs that maintained robust proliferation and hESC-like morphology with minimal spontaneous differentiation were expanded for characterization including testing for mycoplasma (MycoAlert kit, Lonza) and cryopreservation.
Standard metaphase spreads and G-banded karyotypes were determined by the CCHMC Cytogenetics Laboratory. For teratoma formation, iPSCs from 3 wells of a 6-well dish were combined and gently resuspended in ice-cold DMEM/F12. Immediately before injection, matrigel was added to a final concentration of ~33% and cells were injected subcutaneously into immune-compromised NOD/SCID GAMMA C−/− mice. Tumors formed within 6–12 weeks. Excised teratomas were fixed, embedded in paraffin, and sections were stained with hematoxylin and eosin for histological examination. Taqman hPSC Scorecard Assay (Life Technologies) was performed according to manufacturer’s instructions.
H. pylori infection
H. pylori strain G2735 and a mutant G27 strain lacking CagA (ΔCagA)36 were grown on blood agar plates consisting of Columbia Agar Base (Fisher Scientific), 5% horse blood (Colorado Serum Company), 5 μg ml−1, vancomycin and 10 μg ml−1 trimethoprim as described previously37. For organoid injections, H. pylori were resuspended in brucella broth at a concentration of 1 × 10⁹ bacteria ml−1 and loaded onto the Nanoject II (Drummond) microinjector apparatus. Approximately 200 nl (containing 2 × 10⁵ bacteria) were injected directly in the lumen of each organoid, and injected organoids were cultured for 24 hours. Brucella broth was injected as a negative control. Prior to all infection experiments, antibiotics were removed from the organoid growth medium.
Immunofluorescent staining
All tissues were fixed in 4% paraformaldehyde for either one hour at room temperature for frozen processing or overnight at 4°C for paraffin processing. For frozen sections, tissue was protected in 30% sucrose overnight at 4°C, then embedded in OCT (Tissue-Tek), and cut at 10 μm. For paraffin sections, tissue was processed through a graded ethanol series, followed by xylene, and then embedded in paraffin and cut at 7 μm. Tissue culture cells were fixed for 15 minutes at room temperature and stained directly. For staining, frozen slides were thawed to room temperature and rehydrated in PBS, while paraffin slides were deparaffinized and subjected to antigen retrieval. Slides were blocked in 5% normal donkey serum (Jackson Immuno Research) in PBS plus 0.5% Triton-X for 30 minutes at room temperature. Primary antibodies (listed in Methods Table 1) were diluted in blocking buffer and incubated overnight at 4°C. Slides were washed in PBS and incubated with secondary antibody for one hour at room temperature, and coverslips were mounted using Fluoromount-G (Southern Biotech). Confocal images were captured on a Nikon A1Rsi inverted confocal microscope.
TEM imaging
Organoids were fixed in 2% glutaraldehyde plus 2% paraformaldehyde in 0.1M sodium cacodylate buffer (pH 7.4) for 16 hours at 4oC. Organoids were then washed using 0.1M sodium cacodylate buffer followed by a 1 hour incubation using 4% osmium tetroxide, washed and then dehydrated using 25–100% ethanol (series of dilutions), embedded using propylene oxide/LX112. Blocks were sectioned (150 nm) and stained with 2% uranyl acetate followed by lead citrate. Tissue was visualized using a Hitachi transmission electron microscope equipped with an AMT Image Capture Engine version 5.42.366 and MicroFIRE by Optronics camera using AMTV600 digital camera software.
RNA isolation and qPCR
Total RNA was isolated from tissues using the Nucleospin RNA II kit (Machery-Nagel). Reverse transcription was performed from 100 ng RNA using Superscript VILO cDNA Synthesis Kit (Invitrogen) according to manufacturer’s protocol. qPCR was done using Quantitect SybrGreen Master Mix (Qiagen) on a CFX-96 Real-time PCR Detection System (BioRad). Analysis was performed using the ΔΔCT method. PCR primers were designed using sequences from qPrimerDepot (http://primerdepot.nci.nih.gov) and are listed in Methods Table 2.
RNA Sequencing
RNA library construction and RNA Sequencing was performed by the University of Michigan DNA Sequencing Core, using Illumina Hi-Seq 2000 platform. The UM Bioinformatics Core downloaded the read files from the Sequencing Core, and concatenated those into a single .fastq file for each sample. The accession number in the EBI-AE database for the RNAseq data from hGOs is E-MTAB-2885. Publically available RNAseq datasets were download from EBI-AE database (Accession number E-MTAB-1733)38 and NCBI-GEO (SRA) database (Accession number GSE18927)39. Raw reads were quality checked for each sample using FastQC (http://www.bioinformatics.bbsrc.ac.uk/projects/fastqc/) (version 0.10.1) to identify features of the data that may indicate quality problems (e.g. low quality scores, over-represented sequences, inappropriate GC content, etc.). Initial QC report indicated over-representation of Illumina adapter sequences in samples from EBI-AE data set and NCBI-GEO data set. Adapter sequences were trimmed from the reads using Cutadapt (version 0.9.5). We used the software package Tuxedo Suite for alignment, differential expression analysis, and post-analysis diagnostics40–42. Briefly, reads were aligned to the reference transcriptome (UCSC hg19, http://genome.ucsc.edu) using TopHat (version 2.0.9) and Bowtie (version 2.1.0.0). We used default parameter settings for alignment, with the exception of: “--b2-very-sensitive” instructing the software to spend extra time searching for valid alignments, as well as “--no-coverage-search” and “--no-novel-juncs” to limit the read mapping to known transcripts. In addition, we used FastQC for a second round of quality control (post-alignment), to ensure that only high quality data would be input to expression quantitation and differential expression analysis. We used Cufflinks/CuffDiff (version 2.1.1) for expression quantitation and differential expression analysis, using UCSC hg19.fa as the reference genome sequence and UCSC hg19.gtf as the reference transcriptome annotation. We generated diagnostic plots using the CummeRbund package (http://compbio.mit.edu/cummeRbund/).
Flow cytometry
Cells were incubated with Accutase solution at 37°C until a single cell suspension was obtained. Cells were washed with DMEM/F12 (Life Technologies) then spun down at 300 × g for 3 minutes. Cells were re-suspended in PBS and Fluorescent Activated Cell Sorting (FACS) of GFP-HI cells was performed on a FACSCalibur. At least 5×10^5 GFP-HI cells were collected for each sample (n=3 biological replicates). After collection, cells were spun down, and immediately resuspended in lysis buffer for RNA isolation.
Immunoprecipitation and Western blot analysis
H. pylori-infected organoids were harvested from Matrigel in ice-cold PBS and centrifuged at 150 g for 5 minutes. Tissue was lysed in M-PER Mammalian Protein Extract Reagent (Thermo Scientific) supplemented with protease inhibitors (Roche). 10 μg total protein from the cell lysates were immunoprecipitated with anti-c-Met antibody (2 μg; Cell Signaling 4560) at 4°C for 16 hours. Protein A/G agarose beads (20 μl; Santa Cruz Biotechnology) were then added and the samples were incubated at 4°C for 16 hours. Immunoprecipitates were washed 3 times in PBS and then resuspended in Laemmli Loading Buffer containing β-mercaptoethanol (40 μl; BioRad). The positive control for phosphorylate c-Met was whole cell lysate from EGF stimulated A-431 epidermoid carcinoma cells (Santa Cruz Biotechnology), which co-migrates with the phosphyo-tyrosine band in c-Met immunoprecipitated lysates. The positive control for immunoprecipitated CagA is lysate from G27 H. pylori, showing the CagA band co-migrates with the band in the c-Met immunoprecipiated lysates. Samples were run on a 4–20% Tris-Glycine Gradient Gel (Invitrogen) and run at 80 V for 3.5 hours. Gels were transferred to nitrocellulose membranes (Whatman Protran, 0.45 μm) at 105 V for 1.5 hours. Membranes were blocked in KPL Detector Block Solution (Kirkeaard & Perry Laboratories) for one hour at room temperature and then incubated with primary antibody overnight at 4°C. Primary antibodies used: anti-phosphotyrosine (Santa Cruz, sc-7020; 1:100), anti-c-Met (Abcam, ab59884; 1:100), and anti-H. pylori CagA (Abcam, ab90490; 1:100). Membranes were washed and incubated in Alexa Fluor anti-mouse 680 (Invitrogen; 1:1000) secondary antibody. Blots were imaged using the Odyssey Infrared Imaging Software System (Licor).
Primary Antibodies used for Immunofluorescent Staining
The primary antibodies used in immunofluorescence staining are listed below with gene name, species, company, catalog number and dilution.
Acta2, rabbit, GeneTex, GTX100034, 1:200
Atp4b, mouse, Thermo Fisher, MA3-923, 1:1000
aPKC, rabbit, Santa Cruz, sc216, 1:200
B-catenin, rabbit, Santa Cruz, sc7199, 1:100
Cdx2, mouse, Biogenex, MU392A-UC, 1:500
Chga, rabbit, Immunostar, 20086, 1:500
Desmin, goat, Santa Cruz, sc7559, 1:200
E-Cadherin, mouse, BD Biosciences, 610182, 1:500
E-Cadherin, goat, R&D Systems, AF648, 1:500
FoxF1, goat, R&D Systems, AF4798, 1:500
Gastrin, rabbit, Dako, A0568, 1:1000
Gata4, mouse, Santa Cruz, sc25310, 1:200
GFP, rabbit, Invitrogen, A11122, 1:1000
Ghrelin, goat, Santa Cruz, sc10368, 1:200
H. pylori, rabbit, Abcam, ab80519, 1:1000
Hnf1B, mouse, BD Biosciences, 612504, 1:500
Hnf1B, goat, Santa Cruz, sc4711, 1:500
Ki67, rabbit, Abcam, ab833, 1:200
Ki67, rat, Dako, m7249, 1:100
Klf5, rat, Dr. Ryozo Nagai, Shindo et al., 2002, 1:2000
Muc5AC, mouse, Abcam, ab3649, 1:500
Muc6, mouse, Abcam, Ab49462, 1:100
Nanog, rabbit, Abcam, ab21624, 1:500
Oct3/4, mouse, Santa Cruz, sc5279, 1:500
Pdx1, goat, Abcam, ab47383, 1:5000
pHH3, rabbit, Cell Signaling, 9701, 1:500
Serotonin (5-HT), rabbit, Immunostar, 20080, 1:1000
Somatostatin, goat, Santa Cruz, sc7819, 1:100
Sox2, goat, Santa Cruz, sc17320, 1:500
Sox2, rabbit, Seven Hills Bioreagents, WRAB-1236, 1:1000
Sox9, rabbit, Millipore, AB5535, 1:10000
Tff2, goat, Santa Cruz, sc23558, 1:500
Vimentin, goat, Santa Cruz, sc7557, 1:200
Primer Sequences
The primers used for quantitative PCR analyses were:
ATP4A, Forward 5′-TGGTAGTAGCCAAAGCAGCC-3′, Reverse 5′-TGCCATCCAGGCTAGTGAG-3′
ATP4B, Forward 5′-ACCACGTAGAAGGCCACGTA-3′, Reverse 5′-TGGAGGAGTTCCAGCGTTAC-3′
BAPX1, Forward 5′-CAACACCGTCGTCCTCG-3′, Reverse 5′-CCGCTTCCAAAGACCTAGAG-3′
CDX2, Forward 5′-CTGGAGCTGGAGAAGGAGTTTC-3′, Reverse 5′-ATTTTAACCTGCCTCTCAGAGAGC-3′
CHGA, Forward 5′-TGACCTCAACGATGCATTTC-3′, Reverse 5′-CTGTCCTGGCTCTTCTGCTC-3′
GAPDH, Forward 5′-CCCATCACCATCTTCCAGGAG-3′, Reverse 5′-CTTCTCCATGGTGGTGAAGACG-3′
GAST, Forward 5′-CAGAGCCAGTGCAAAGATCA-3′, Reverse 5′-AGAGACCTGAGAGGCACCAG-3′
GHRL, Forward 5′-GCTGGTACTGAACCCCTGAC-3′, Reverse 5′-GATGGAGGTCAAGCAGAAGG-3′
GKN1, Forward 5′-AGCTAGGGCAGGAGCTAGAAA-3′, Reverse 5′-GCTTGCCTACTCCTCTGTCC-3′
HNF1B, Forward 5′-TCACAGATACCAGCAGCATCAGT-3′, Reverse 5′-GGGCATCACCAGGCTTGTA-3′
HNF6, Forward 5′-TGTTGCCTCTATCCTTCCCA-3′, Reverse 5′-GGAGGATGTGGAAGTGGCT-3′
MIST1, Forward 5′-TGCTGGACATGGTCAGGAT-3′, Reverse 5′-CGGACAAGAAGCTCTCCAAG-3′
MSX1, Forward 5′-GGTTCGTCTTGTGTTTGCG-3′, Reverse 5′-CCCGAGAAGCCCGAGAG-3′
MSX2, Forward 5′-GGTCTTGTGTTTCCTCAGGG-3′, Reverse 5′-AAATTCAGAAGATGGAGCGG-3′
MUC2, Forward 5′-TGTAGGCATCGCTCTTCTCA-3′, Reverse 5′-GACACCATCTACCTCACCCG-3′
MUC5AC, Forward 5′-CCAAGGAGAACCTCCCATAT-3′, Reverse 5′-CCAAGCGTCATTCCTGAG-3′
MUC6, Forward 5′-CAGCAGGAGGAGATCACGTTCAAG-3′, Reverse 5′-GTGGGTGTTTTCCTGTCTGTCATC-3′
NEUROG3, Forward 5′-CTTCGTCTTCCGAGGCTCT-3′, Reverse 5′-CTATTCTTTTGCGCCGGTAG-3′
PDX1, Forward 5′-CGTCCGCTTGTTCTCCTC-3′, Reverse 5′-CCTTTCCCATGGATGAAGTC-3′
PTF1a, Forward 5′-AGAGAGTGTCCTGCTAGGGG-3′, Reverse 5′-CCAGAAGGTCATCATCTGCC-3′
SST, Forward 5′-GCGCTGTCCATCGTCCTGGCCC-3′, Reverse 5′-AGCCGGGTTTGAGTTAGCAGAT-3′
SOX2, Forward 5′-GCTTAGCCTCGTCGATGAAC-3′, Reverse 5′-AACCCCAAGATGCACAACTC-3′
TFF1, Forward 5′-AATTCTGTCTTTCACGGGGG-3′, Reverse 5′-GGAGAACAAGGTGATCTGCG-3′
TFF2, Forward 5′-TCTGAGACCTCCATGACGC-3′, Reverse 5′-ATGGATGCTGTTTCGACTCC-3′
TFF3, Forward 5′-CACTCCTTGGGGGTGACA-3′, Reverse 5′-CTCCAGCTCTGCTGAGGAGT-3′
The primers for LGR5:eGFP BAC cloning were:
Recombination Cassette primers Forward 5′-GGTGCTGCTCTCCGCCCGCGTCCGGCTCGTGGCCCCCTACTTCGGGCACCATGG TGAGCAAGGGCGAGGA-3′, Reverse 5′-TTCCTTCCCCTCTTAGTCTCTCTCCCGGAGTGACGTGGGGAAGTACTTACCTATAC GAAGTTATAAGCTT-3′
Colony Screening #1, Forward 5′-AGACGCCCGCTGAGTTGCAG-3′, Reverse, 5′-TGCACGCCGTAGGTCAGGGT-3′
Colony Screening #2, Forward, 5′-CAGCAGCGCTTTCCCGGGTT-3′ Reverse 5′-GGCGAATGGGCTGACCGCTT-3′
Extended Data
Extended Data Figure 1. BMP signaling is required in parallel with activation of WNT and FGF, to promote a posterior fate.

a, Activation of Wnt signaling with WNT3a or the GSK3β inhibitor CHIR99021 (CHIR; 2 μM) induced a posterior fate and this was blocked by BMP inhibition. n=3 biological replicates per condition. b, Activation of Wnt signaling with WNT3a or CHIR induced gut tube morphogenesis and spheroid production. c, Immunofluorescent staining of monolayer cultures confirmed the high efficiency of CDX2 induction by CHIR/FGF treatment, and that noggin blocked posterior CDX2 expression and induced expression of the foregut marker SOX2. d, qPCR analysis of BMP target genes MSX1/2 indicated that BMP activity is not increased in response to Wnt/FGF, but target genes are suppressed in response to noggin, suggesting that noggin acts on endogenous BMP signaling. n=3 biological replicates per condition. e, Addition of BMP2 (100 ng mL−1) did not substitute for or augment the ability of Wnt/FGF to posteriorize endoderm. These data indicate that the posteriorizing effect of Wnt/FGF is not mediated by up-regulation of BMP signaling but does require endogenous BMP activity. n=3 biological replicates per condition. Scale bars, 1 mm in b; 100 μm in c. Error bars represent standard deviation.
Extended Data Figure 2. Gastric organoid differentiation is efficient in multiple PSC lines.

a, Table comparing spheroid formation and characteristics between two hESC lines (H1 and H9) and one iPSC line (72.3). Spheroid number was averaged from n=8 wells per cell line; total cells per spheroid and epithelial composition were determined from whole mount staining (DAPI for total cell number and Foxa2 for epithelial cells) and quantification from n=6 spheroids per cell line. b, Immunofluorescent staining of 34-day hGOs derived from H1 and iPSC 72.3 cell lines. iPSC-derived organoids exhibit the same morphological and molecular features of those derived from hESCs. c, Organ epithelial cell type quantification in 34-day hGOs. Greater than 90% of the epithelium is antral, indicated by PDX1 expression and lack of PTF1A expression, whereas less than 5% express markers associated with other organs derived from endoderm including CDX2 (intestine), albumin (liver) and p63 (squamous epithelium). Data shown are averages from n=6 hGOs. d–g, Characterization of induced pluripotent stem cell line iPSC 72.3 used in a. d, iPSC 72.3 exhibited normal morphological characteristics of pluripotent stem cell colonies, as compared to the H1 hESC line and e, had a normal 46;XY karyotype. f, iPSC 72.3 expressed pluripotent markers OCT3/4 and NANOG, and g, demonstrated pluripotency by differentiation into endoderm, mesoderm, and ectoderm lineages in an in vivo teratoma assay. Error bars represent standard deviation. h, Human pluripotent stem cell scorecard assay results demonstrating that H1 hESC and iPSC 72.3 have similar pluripotency and differentiation potential and that iPSC 72.3 does not have a lineage bias. UD, undifferentiated; EB, differentiated as embryoid bodies for 14 days. Scale bars, 100 μm. Error bars represent standard deviation.
Extended Data Figure 3. Retinoic acid posteriorizes foregut endoderm.

a, Lineage diagram that summarizes the patterning effects of noggin and RA in the formation of both anterior and posterior foregut endoderm. b, Bright field images show that RA increased the number of spheroids that are produced from foregut monolayer cultures. c, A lower power image of figure 1d showing immunofluorescent image of a E8.5, 14 somite stage embryo with Hnf1β protein localized to the posterior portion of the foregut. Boxed region of embryo is shown in figure 1d. d, qPCR analysis of gene expression in foregut spheroids treated with RA. Posterior foregut markers HNF1β and HNF6 were robustly induced by 24-hour exposure to RA. Although RA induced posterior foregut gene expression it did not induce expression of the posterior marker CDX2. *, p<0.05; student’s t-test; n=3 biological replicates per condition, data representative of 3 independent experiments. Scale bars, 1 mm in b; 100 μm in c. Error bars represent standard deviation.
Extended Data Figure 4. Human gastric organoids recapitulate normal antrum development of mouse embryos.

a, Comparison of transcription factor expression between hGO development and in vivo stomach organogenesis. Four embryonic stages (E12.5, E14.5, E16.5 and E18.5) and one postnatal stage (P12) of in vivo antrum development were analyzed for expression of the following transcription factors: Sox2, Pdx1, Gata4, Klf5, and FoxF1. The same markers were analyzed at two stages (day 13 and day 34) of in vitro hGO development and revealed that organoid development parallels what occurs in vivo. At early stages of antrum development the epithelial marker Sox2 was expressed ubiquitously but at later stages it is down-regulated, while other epithelial transcription factors, Pdx1, Gata4 and Klf5, exhibit persistent expression in the epithelium throughout development. Both early and late stage hGOs contain FoxF1-positive mesenchymal cells surrounding the epithelium, similar to the in vivo antrum. b, Early stage human gastric organoids exhibit stereotypic epithelial architecture and nuclear behavior. At 13 days, hGOs contained pseudostratified epithelia that display apicobasal polarity marked by the apical marker aPKC and the basolateral marker E-Cadherin, similar to the E12.5 mouse antrum. Further, extensions of apical membrane (white arrows) were seen within deeper portions of the organoid epithelium. Both the E12.5 mouse antrum and day 7 hGOs appeared to undergo interkinetic nuclear migration, indicated by the presence of mitotic nuclei, pHH3, in only the apical portions of cells. c, EGF is required for morphogenesis in gastric organoids. Bright field images demonstrate the requirement for EGF in epithelial morphogenesis including folding and gland formation at late stages of hGO differentiation. When EGF is removed from the growth medium at day 27, prior to glandular morphogenesis, the hGO epithelium retains a simple, cuboidal structure that fails to form glands. Scale bars, 100 μm in a, 50 μm in b, 2 mm in c.
Extended Data Figure 5. Mesenchymal differentiation in gastric organoids.

a, Temporal expression analysis of the antral mesenchyme transcription factor BAPX1. Similar to its known embryonic expression pattern, BAPX1 is up-regulated during the earlier stages of hGO differentiation and then down-regulated coincident with functional cell type marker expression. n=3 biological replicates per time point. b, Staining for mesenchymal cell type markers revealed that 34-day hGOs contain FOXF1/VIM-positive submucosal fibroblasts and a small number of VIM/ACTA2-expressing subepithelial fibroblasts. hGOs lack a robust smooth muscle layer, indicated by Acta2/Desmin-positive cells in the in vivo antrum. Scale bars, 100 μm. Error bars represent standard deviation.
Extended Data Figure 6. Induction of genes during development of hGOs that mark specific differentiated antral cell types.

a, qPCR analyses of cell lineage differentiation marker expression at several stages throughout the gastric organoid differentiation protocol (d0, d3, d6, d9, d20, d27, and d34) and d34 human intestinal organoids (hIO). Beginning at day 27, hGOs robustly induced genes expressed in differentiated cell types including surface mucous cells (MUC5AC, TFF1, TFF3, and GKN1) and antral gland cells (TFF2). HGOs do not up-regulate expression of markers found in fundic lineages such as parietal cells (ATP4A and ATP4B) and chief cells (MIST1) or intestinal goblet cells (MUC2). Expression levels are normalized to d3 DE cultures. n=3 biological replicates per time point. b, Muc5AC-expressing surface mucous cells in the late fetal (E18.5) mouse antrum are not yet confined to a pit region and are more broadly distributed through the antral epithelium. Further, these pit cells exhibit high amounts of intracellular mucin staining, similar to 34-day hGOs. c, Global gene expression profiling of 34-day hGOs was performed using RNA-seq, and data were compared to published RNA-seq datasets from human tissues. Hierarchical clustering revealed that hGOs closely resemble human fetal stomach tissue but not human fetal intestine. Error bars represent standard deviation.
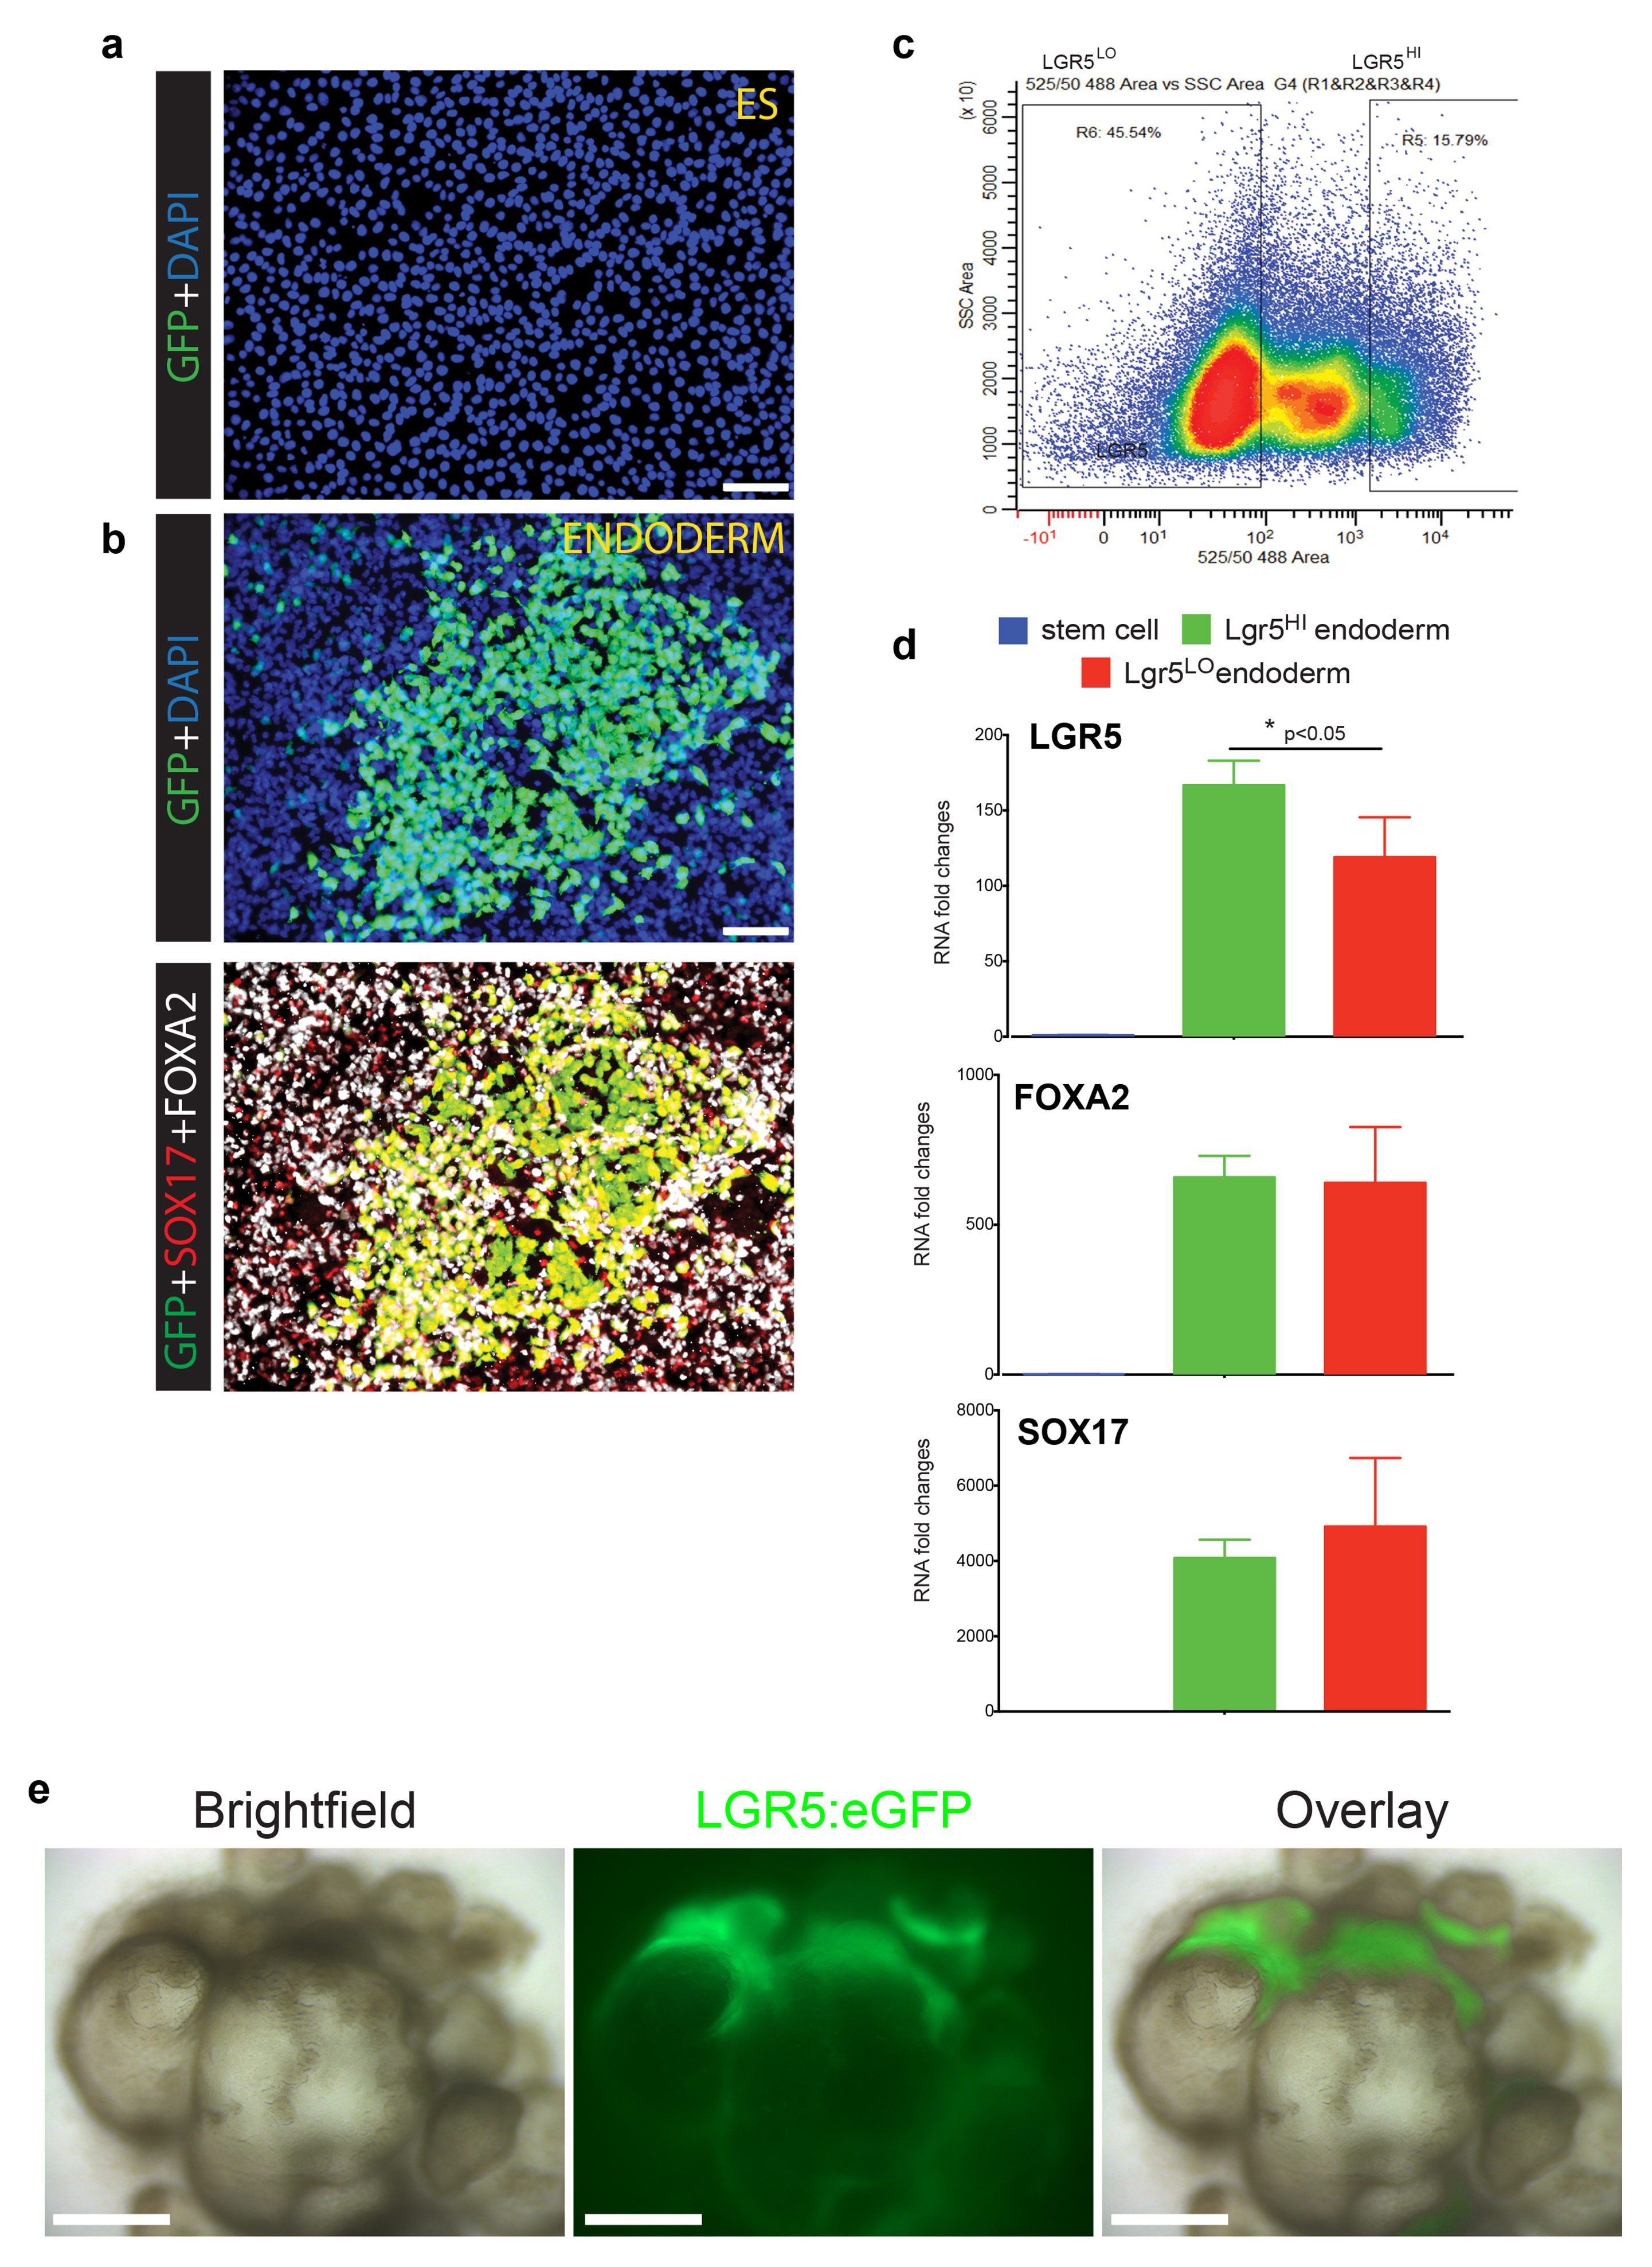
Extended Data Figure 7. Characterization of LGR5: eGFP BAC transgenic reporter hESC line.

a, H9-LGR5:eGFP hESC line did not show eGFP fluorescence in undifferentiated, pluripotent stem cells. b, Upon differentiation to definitive endoderm, robust eGFP expression was observed, consistent with published microarray and RNA-sequencing analyses that show LGR5 as a highly enriched endoderm transcript6,30. The top panel shows DAPI and eGFP staining, whereas the bottom panel shows eGFP co-localization with endoderm markers SOX17 and FOXA2. c, FACS was used to sort LGR5:eGFPLO and LGR5:eGFPHI from 3-day Activin A-treated definitive endoderm cultures. d, qPCR was used to measure LGR5, FOXA2, and SOX17 expression levels in undifferentiated H9-LGR5:eGFP cells (blue bars; “stem cell”) and in FACS-purified H9-LGR5:eGFP endoderm (red bars, LGR5:eGFPLO; green bars, LGR5:eGFPHI). As expected, LGR5, FOXA2, and SOX17 were all highly enriched in both LGR5:eGFPLO and LGR5:eGFPHI endoderm populations compared to undifferentiated controls, and the LGR5:eGFPHI cells showed significant enrichment of LGR5 mRNA, but not FOXA2 or SOX17, compared to the LGR5:eGFPLo population. n=3 biological replicates for each group and error bars represent the S.E.M. *, p<0.05. This analysis suggests that the LGR5:eGFP BAC construct drives eGFP expression in endoderm cells with the highest levels of LGR5 expression. e, H9-LGR5:eGFP hESCs were differentiated into antral gastric organoids. Bright field and GFP stereomicrographs of 30-day hGOs showed that the organoid epithelium developed regionally-restricted areas of LGR5:eGFP expression, suggesting that LGR5+ stem cell populations formed during the differentiation of the organoids. Scale bars, 100 μm.
Extended Data Figure 8. NEUROG3 expression and endocrine differentiation are reduced in a high EGF environment.

a, Endocrine cell differentiation in the antrum is first evident at E18.5 and highly robust at postnatal stages (P12 shown). As early as e18.5, all expected gastric endocrine subtype hormones are present, including gastrin, ghrelin, somatostatin, and serotonin (5-HT). b, High levels of EGF (100 ng ml−1) repressed NEUROG3 expression, however a reduction in EGF concentration (10 ng ml−1) at day 30 resulted in a significant increase in NEUROG3 expression measured at day 34 by qPCR. *, p<0.05; student’s t-test; n=5 biological replicates, data representative of 3 independent experiments. c, hGOs maintained in high concentrations of EGF (100 ng mL−1) had very few endocrine cells at day 34, shown by staining for the pan-endocrine marker CHGA. However, a reduction of EGF concentration (10 ng mL−1) at day 30 resulted in more physiologic numbers of endocrine cells in the gastric epithelium. d, Schematic indicating the effects of EGF at different stages of hGO growth, morphogenesis, and cell type specification. High levels of EGF were required at early developmental stages for growth and morphogenesis, however it repressed endocrine differentiation at late stages of development; thus, the EGF concentration was reduced at day 30 to allow for endocrine cell development. e, To test whether EGF repression of endocrine differentiation occurs upstream of NEUROG3, hGOs were generated from a hESC line stably transfected with a dox-inducible NEUROG3-overexpressing transgene. hGOs were maintained in high EGF (100 ng mL−1) then at day 30 were treated with doxycycline (1 μg mL−1) for 24 hours and then analyzed at day 34. f, Dox-treated hGOs show robust activation of endocrine markers CHGA, GASTRIN, GHRELIN, and SOMATOSTATIN, and (g) they contain CHGA, GHRELIN, and SOMATOSTATIN expressing cells with endocrine morphology. *, p<0.05; student’s t-test; n=3 biological replicates per condition, data representative of 2 independent experiments. Therefore NEUROG3 overexpression was sufficient to induce gastric endocrine cell fate in a high EGF environment. Scale bars, 100 μm. Error bars represent standard deviation.
Extended Data Figure 9. H. pylori infection of human gastric organoids.

a, hGOs were used to model human-specific disease processes of H. pylori infection. Bacteria were microinjected into the lumen of hGOs and bacteria were detected in the lumen 24 hours post-injection by bright field microscopy (black arrow). b, Electron micrograph illustrates the attachment of H. pylori bacterial to an hGO epithelial cell 24 hours after injection. Scale bar, 500 nm. c, Western blots from figure 4 that show the molecular weight markers in the first lane. The darker exposure for the CagA western blot (CagA dark) was included to show the molecular weight markers (170 and 130kd).
Extended Data Figure 10. Summary of methods for the directed differentiation of gastric organoids.

Each step in the differentiation process is indicated, along with representative stereomicrographs.
Supplementary Material
Acknowledgments
We thank Aaron Zorn, Jeff Whitsett, Noah Shroyer, the Pluripotent Stem Cell Facility and members of the Wells and Zorn laboratories for reagents and feedback. We also thank Matt Kofron for assistance with confocal imaging and Thomas Westbrook (Baylor College of Medicine) for providing pInducer20 vector. We thank Richard Peek (Vanderbilt University) for assistance with analyzing electron micrograph images. This work was supported from NIH grants R01DK080823, R01DK092456, K01DK091415, NIGMS Medical Scientist Training Program T32 GM063483, and the American Gastroenterological Association: Robert and Sally Funderburg Research Award in Gastric Cancer. We also acknowledge core support from the Cincinnati Digestive Disease Center Award (P30 DK0789392), Clinical Translational Science Award (U54 RR025216), the Michigan Gastrointestinal Peptide Research Center (MGPRC; NIDDK 5P30DK034933), and technical support from CCHMC Confocal Imaging Core, CCHMC Pathology Core, and CCHMC Viral Vector Core.
Footnotes
Contributions
K.W.M. and J.M.W. conceived the study and experimental design, performed and analyzed experiments and co-wrote the manuscript. Y.Z. designed, performed and helped analyze H. pylori experiments. E.C., C.C., K.L.S., and M.S. performed experiments. C.N.M. generated and characterized iPSC line. B.E.R. and Y.-H.T. and J.R.S. designed, generated and characterized the LGR5:eGFP reporter hESC line and performed RNA-seq experiments and analysis. All authors contributed to the writing or editing of the manuscript.
References
- 1.Wen S, Moss SF. Helicobacter pylori virulence factors in gastric carcinogenesis. Cancer Lett. 2009;282:1–8. doi: 10.1016/j.canlet.2008.11.016. [DOI] [PMC free article] [PubMed] [Google Scholar]
- 2.Yuan Y, Padol IT, Hunt RH. Peptic ulcer disease today. Nat Clin Pract Gastroenterol Hepatol. 2006;3:80–89. doi: 10.1038/ncpgasthep0393. [DOI] [PubMed] [Google Scholar]
- 3.Parkin DM. The global health burden of infection-associated cancers in the year 2002. Int J Cancer. 2006;118:3030–3044. doi: 10.1002/ijc.21731. [DOI] [PubMed] [Google Scholar]
- 4.Peek RM. Helicobacter pylori infection and disease: from humans to animal models. Dis Model Mech. 2008;1:50–55. doi: 10.1242/dmm.000364. [DOI] [PMC free article] [PubMed] [Google Scholar]
- 5.Mills JC, Shivdasani RA. Gastric Epithelial Stem Cells. Gastroenterology. 2011;140:412–424. doi: 10.1053/j.gastro.2010.12.001. [DOI] [PMC free article] [PubMed] [Google Scholar]
- 6.Spence JR, et al. Directed differentiation of human pluripotent stem cells into intestinal tissue in vitro. Nature. 2011;470:105–109. doi: 10.1038/nature09691. [DOI] [PMC free article] [PubMed] [Google Scholar]
- 7.Si-Tayeb K, et al. Highly efficient generation of human hepatocyte-like cells from induced pluripotent stem cells. Hepatology. 2010;51:297–305. doi: 10.1002/hep.23354. [DOI] [PMC free article] [PubMed] [Google Scholar]
- 8.D’Amour KA, et al. Production of pancreatic hormone-expressing endocrine cells from human embryonic stem cells. Nat Biotechnol. 2006;24:1392–1401. doi: 10.1038/nbt1259. [DOI] [PubMed] [Google Scholar]
- 9.D’Amour KA, et al. Efficient differentiation of human embryonic stem cells to definitive endoderm. Nat Biotechnol. 2005;23:1534–1541. doi: 10.1038/nbt1163. [DOI] [PubMed] [Google Scholar]
- 10.McCracken KW, Howell JC, Spence JR, Wells JM. Generating human intestinal tissue from pluripotent stem cells in vitro. Nature Protocols. 2011;6:1920–1928. doi: 10.1038/nprot.2011.410. [DOI] [PMC free article] [PubMed] [Google Scholar]
- 11.Kumar M, Jordan N, Melton D, Grapin-Botton A. Signals from lateral plate mesoderm instruct endoderm toward a pancreatic fate. Dev Biol. 2003;259:109–122. doi: 10.1016/s0012-1606(03)00183-0. [DOI] [PubMed] [Google Scholar]
- 12.Tiso N, Filippi A, Pauls S, Bortolussi M, Argenton F. BMP signalling regulates anteroposterior endoderm patterning in zebrafish. Mech Dev. 2002;118:29–37. doi: 10.1016/s0925-4773(02)00252-6. [DOI] [PubMed] [Google Scholar]
- 13.Green MD, et al. Generation of anterior foregut endoderm from human embryonic and induced pluripotent stem cells. Nat Biotechnol. 2011;29:267–272. doi: 10.1038/nbt.1788. [DOI] [PMC free article] [PubMed] [Google Scholar]
- 14.Wang Z, Dollé P, Cardoso WV, Niederreither K. Retinoic acid regulates morphogenesis and patterning of posterior foregut derivatives. Dev Biol. 2006;297:433–445. doi: 10.1016/j.ydbio.2006.05.019. [DOI] [PubMed] [Google Scholar]
- 15.Martín M, et al. Dorsal pancreas agenesis in retinoic acid-deficient Raldh2 mutant mice. Dev Biol. 2005;284:399–411. doi: 10.1016/j.ydbio.2005.05.035. [DOI] [PubMed] [Google Scholar]
- 16.Molotkov A, Molotkova N, Duester G. Retinoic acid generated by Raldh2 in mesoderm is required for mouse dorsal endodermal pancreas development. Dev Dyn. 2005;232:950–957. doi: 10.1002/dvdy.20256. [DOI] [PubMed] [Google Scholar]
- 17.Kawaguchi Y, et al. The role of the transcriptional regulator Ptf1a in converting intestinal to pancreatic progenitors. Nat Genet. 2002;32:128–134. doi: 10.1038/ng959. [DOI] [PubMed] [Google Scholar]
- 18.Johnson LR, Guthrie PD. Stimulation of rat oxyntic gland mucosal growth by epidermal growth factor. Am J Physiol. 1980;238:G45–9. doi: 10.1152/ajpgi.1980.238.1.G45. [DOI] [PubMed] [Google Scholar]
- 19.Majumdar AP. Postnatal undernutrition: effect of epidermal growth factor on growth and function of the gastrointestinal tract in rats. J Pediatr Gastroenterol Nutr. 1984;3:618–625. [PubMed] [Google Scholar]
- 20.Grosse AS, et al. Cell dynamics in fetal intestinal epithelium: implications for intestinal growth and morphogenesis. Development. 2011;138:4423–4432. doi: 10.1242/dev.065789. [DOI] [PMC free article] [PubMed] [Google Scholar]
- 21.Verzi MP, et al. Role of the homeodomain transcription factor Bapx1 in mouse distal stomach development. Gastroenterology. 2009;136:1701–1710. doi: 10.1053/j.gastro.2009.01.009. [DOI] [PMC free article] [PubMed] [Google Scholar]
- 22.Choi E, et al. Cell lineage distribution atlas of the human stomach reveals heterogeneous gland populations in the gastric antrum. Gut. 2014 doi: 10.1136/gutjnl-2013-305964. [DOI] [PMC free article] [PubMed] [Google Scholar]
- 23.Barker N, et al. Lgr5(+ve) stem cells drive self-renewal in the stomach and build long-lived gastric units in vitro. Cell Stem Cell. 2010;6:25–36. doi: 10.1016/j.stem.2009.11.013. [DOI] [PubMed] [Google Scholar]
- 24.Jenny M, et al. Neurogenin3 is differentially required for endocrine cell fate specification in the intestinal and gastric epithelium. EMBO J. 2002;21:6338–6347. doi: 10.1093/emboj/cdf649. [DOI] [PMC free article] [PubMed] [Google Scholar]
- 25.Lee CS, Perreault N, Brestelli JE, Kaestner KH. Neurogenin 3 is essential for the proper specification of gastric enteroendocrine cells and the maintenance of gastric epithelial cell identity. Genes Dev. 2002;16:1488–1497. doi: 10.1101/gad.985002. [DOI] [PMC free article] [PubMed] [Google Scholar]
- 26.Olbe L, Hamlet A, Dalenbäck J, Fändriks L. A mechanism by which Helicobacter pylori infection of the antrum contributes to the development of duodenal ulcer. Gastroenterology. 2001;110:1386–1394. doi: 10.1053/gast.1996.v110.pm8613042. [DOI] [PubMed] [Google Scholar]
- 27.Xia HH, et al. Antral-type mucosa in the gastric incisura, body, and fundus (antralization): a link between Helicobacter pylori infection and intestinal metaplasia? Am J Gastroenterol. 2000;95:114–121. doi: 10.1111/j.1572-0241.2000.01609.x. [DOI] [PubMed] [Google Scholar]
- 28.Churin Y, et al. Helicobacter pylori CagA protein targets the c-Met receptor and enhances the motogenic response. J Cell Biol. 2003;161:249–255. doi: 10.1083/jcb.200208039. [DOI] [PMC free article] [PubMed] [Google Scholar]
- 29.Peek RM, et al. Helicobacter pylori cagA+ strains and dissociation of gastric epithelial cell proliferation from apoptosis. J Natl Cancer Inst. 1997;89:863–868. doi: 10.1093/jnci/89.12.863. [DOI] [PubMed] [Google Scholar]
- 30.Xie R, et al. Dynamic Chromatin Remodeling Mediated by Polycomb Proteins Orchestrates Pancreatic Differentiation of Human Embryonic Stem Cells. Stem Cell. 2013:1–14. doi: 10.1016/j.stem.2012.11.023. [DOI] [PMC free article] [PubMed] [Google Scholar]
- 31.Teo AKK, et al. Activin and BMP4 Synergistically Promote Formation of Definitive Endoderm in Human Embryonic Stem Cells. Stem Cells. 2012;30:631–642. doi: 10.1002/stem.1022. [DOI] [PubMed] [Google Scholar]
- 32.Meerbrey KL, et al. The pINDUCER lentiviral toolkit for inducible RNA interference in vitro and in vivo. Proc Natl Acad Sci USA. 2011;108:3665–3670. doi: 10.1073/pnas.1019736108. [DOI] [PMC free article] [PubMed] [Google Scholar]
- 33.Warming S, Costantino N, Court DL, Jenkins NA, Copeland NG. Simple and highly efficient BAC recombineering using galK selection. Nucleic Acids Res. 2005;33:e36. doi: 10.1093/nar/gni035. [DOI] [PMC free article] [PubMed] [Google Scholar]
- 34.Okita K, et al. An efficient nonviral method to generate integration-free human-induced pluripotent stem cells from cord blood and peripheral blood cells. Stem Cells. 2013;31:458–466. doi: 10.1002/stem.1293. [DOI] [PubMed] [Google Scholar]
- 35.Covacci A, et al. Molecular characterization of the 128-kDa immunodominant antigen of Helicobacter pylori associated with cytotoxicity and duodenal ulcer. Proc Natl Acad Sci USA. 1993;90:5791–5795. doi: 10.1073/pnas.90.12.5791. [DOI] [PMC free article] [PubMed] [Google Scholar]
- 36.Amieva MR, Salama NR, Tompkins LS, Falkow S. Helicobacter pylori enter and survive within multivesicular vacuoles of epithelial cells. Cell Microbiol. 2002;4:677–690. doi: 10.1046/j.1462-5822.2002.00222.x. [DOI] [PubMed] [Google Scholar]
- 37.Schumacher MA, et al. Gastric Sonic Hedgehog acts as a macrophage chemoattractant during the immune response to Helicobacter pylori. Gastroenterology. 2012;142:1150–1159.e6. doi: 10.1053/j.gastro.2012.01.029. [DOI] [PMC free article] [PubMed] [Google Scholar]
- 38.Fagerberg L, et al. Analysis of the human tissue-specific expression by genome-wide integration of transcriptomics and antibody-based proteomics. Mol Cell Proteomics. 2014;13:397–406. doi: 10.1074/mcp.M113.035600. [DOI] [PMC free article] [PubMed] [Google Scholar]
- 39.Bernstein BE, et al. The NIH Roadmap Epigenomics Mapping Consortium. Nat Biotechnol. 2010;28:1045–1048. doi: 10.1038/nbt1010-1045. [DOI] [PMC free article] [PubMed] [Google Scholar]
- 40.Langmead B, Trapnell C, Pop M, Salzberg SL. Ultrafast and memory-efficient alignment of short DNA sequences to the human genome. Genome Biol. 2009;10:R25. doi: 10.1186/gb-2009-10-3-r25. [DOI] [PMC free article] [PubMed] [Google Scholar]
- 41.Trapnell C, Pachter L, Salzberg SL. TopHat: discovering splice junctions with RNA-Seq. Bioinformatics. 2009;25:1105–1111. doi: 10.1093/bioinformatics/btp120. [DOI] [PMC free article] [PubMed] [Google Scholar]
- 42.Trapnell C, et al. Differential analysis of gene regulation at transcript resolution with RNA-seq. Nat Biotechnol. 2013;31:46–53. doi: 10.1038/nbt.2450. [DOI] [PMC free article] [PubMed] [Google Scholar]
Associated Data
This section collects any data citations, data availability statements, or supplementary materials included in this article.