Abstract
Chromosomal rearrangements play a central role in the pathogenesis of human cancers and often result in the expression of therapeutically actionable gene fusions1. A recently discovered example is a fusion between the Echinoderm Microtubule-associated Protein-like 4 (EML4) and the Anaplastic Lymphoma Kinase (ALK) genes, generated by an inversion on the short arm of chromosome 2: inv(2)(p21p23). The EML4-ALK oncogene is detected in a subset of human non-small cell lung cancers (NSCLC)2 and is clinically relevant because it confers sensitivity to ALK inhibitors3. Despite their importance, modeling such genetic events in mice has proven challenging and requires complex manipulation of the germline. Here we describe an efficient method to induce specific chromosomal rearrangements in vivo using viral-mediated delivery of the CRISPR/Cas9 system to somatic cells of adult animals. We apply it to generate a mouse model of Eml4-Alk-driven lung cancer. The resulting tumors invariably harbor the Eml4-Alkinversion, express the Eml4-Alk fusion gene, display histo-pathologic and molecular features typical of ALK+ human NSCLCs, and respond to treatment with ALK-inhibitors. The general strategy described here substantially expands our ability to model human cancers in mice and potentially in other organisms.
Genetically engineered mouse models of human cancers have proven indispensable to dissect the molecular mechanisms underlying tumorigenesis4 and provide powerful preclinical platforms for studying drug sensitivity5 and resistance6-8. Although many gain- and loss-of-function mutations observed in human cancers can be modeled using current gene-targeting technologies, chromosomal rearrangements leading to oncogenic gene fusions have proven challenging to faithfully recapitulate in mice. Ectopic expression of fusion oncoproteins from transgenes is widely used to study their oncogenic properties9-13, though with this approach the fusion protein is invariably expressed at non-physiologic levels and neither the role of reduced dosage of the wild type alleles nor the contribution of the reciprocal product of the translocation can be examined. Strategies that express the fusion transcript from the endogenous locus of the 5’ element14 only partially address these limitations, whereas approaches that engineer loxP sites at each breakpoint and produce rearrangements in the presence of Cre recombinase15,16 are laborious and have limited applications. Novel genome-editing technologies provide a potentially more flexible strategy to produce precise genomic changes including oncogenic chromosomal rearrangements17-20, but they have not yet been adapted to model such rearrangements in vivo.
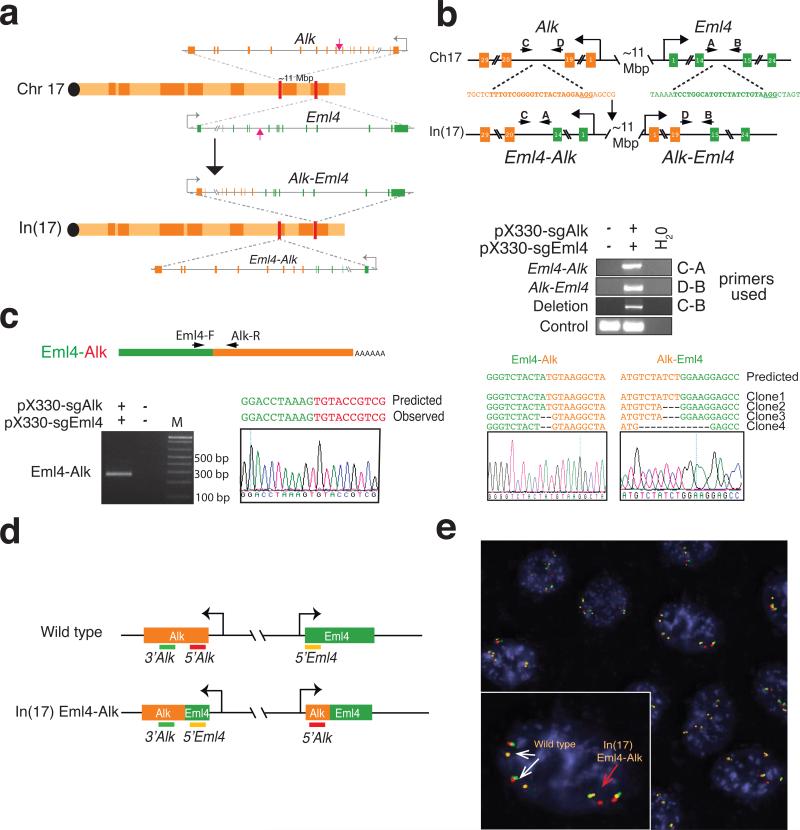
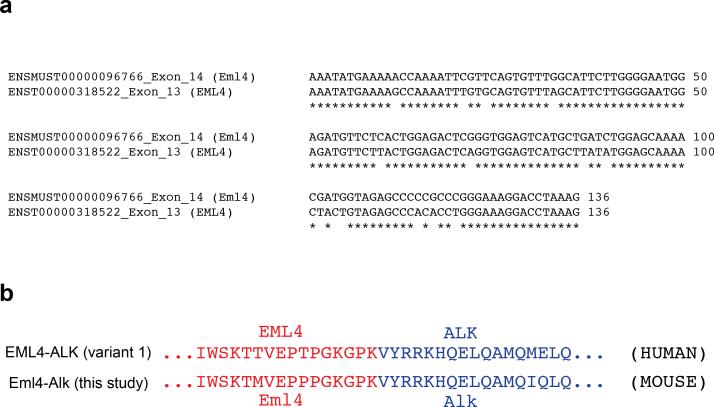
In the mouse genome, Eml4 and Alk are located on chromosome 17, approximately 11 Mbp apart, in a region that is syntenic to human chromosome 2(p21-p23) (Fig. 1a). We attempted to model the most common EML4-ALK variant in human NSCLCs21 by introducing concomitant double-strand DNA breaks at intron 14 of Eml4 (which corresponds to intron 13 of EML4) and at intron 19 of Alk (Fig. 1a, 1b, Extended Data Fig. 1). To induce the DNA breaks we chose the CRISPR system22 because it only requires co-expression of Cas9 and an appropriately designed RNA molecule (sgRNA)23.
Figure 1. Induction of Eml4-Alk rearrangement in murine cells using the CRISPR-Cas9 system.
(a) Schematic of the In(17) involving the Eml4 and Alk loci. Red arrows indicate the sites recognized by the sgRNAs. (b) A schematic of the loci before and after the inversion with the location of the primers used (top panel). PCRs were performed on genomic DNA extracted from NIH/3T3 cells transfected with the indicated pX330 constructs (middle panels). The PCR bands were sub-cloned and the sequences of four independent clones and a representative chromatogram are shown in the lower panels. (c) Schematic of the Eml4-Alk fusion transcript (top panel). Detection of the Eml4-Alk fusion transcript by RT-PCR on total RNAs extracted from NIH/3T3 cells transfected with the indicated pX330 constructs (bottom left panel). Sequence of the PCR product showing the correct Eml4-Alk junction (bottom-right panel). (d) Schematic of the break-apart interphase FISH strategy. In cells with the Eml4-Alk inversion, the red and green probes become separated, and the green and orange probes become juxtaposed. (e) Break-apart interphase FISH assay on a NIH/3T3 clone selected from cells cotransfected with pX330-Eml4 and pX330-Alk. Both wild type (white arrows) and the In(17) Eml4-Alk allele (red arrow) are detected.
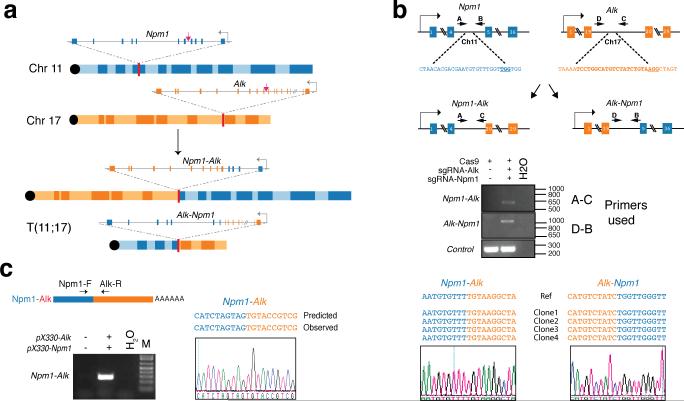
We cloned sgRNAs targeting the Eml4 and Alk sites into the Cas9-expressing plasmid pX33024 and co-transfected the resulting constructs in NIH/3T3. PCR analysis demonstrated the induction of the Eml4-Alk inversion and of a large deletion of the region between the two cut sites in the transfected cell population (Fig. 1b). The presence of the desired Eml4-Alk inversion was confirmed by sequencing the corresponding Eml4-Alk fusion transcript (Fig. 1c) and directly visualized by interphase FISH (Fig. 1d, 1e). Using a similar strategy, we also modeled the Npm1-Alk rearrangement, a reciprocal chromosomal translocation commonly observed in anaplastic large cell lymphomas25 (Extended Data Fig. 2). These results confirm that the CRISPR system can be adapted to engineer large deletions, inversions, and chromosomal translocations in eukaryotic cells.
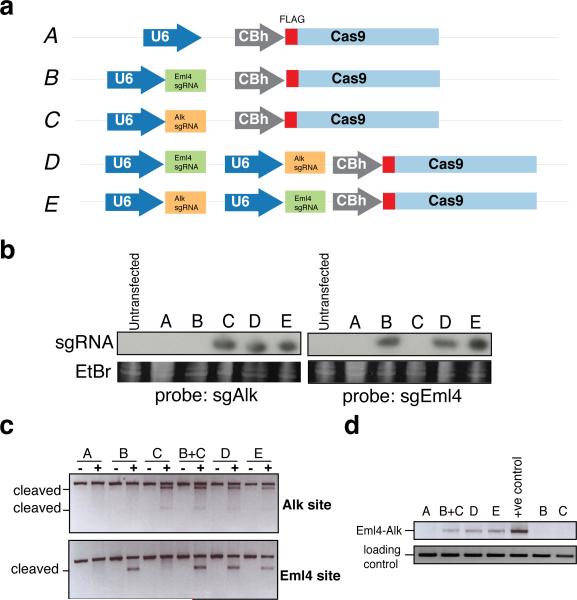
While appropriate for cell-based experiments, expression of two sgRNAs from separate constructs would be impractical in vivo. We therefore engineered plasmids to simultaneously express Cas9 and two distinct sgRNAs from tandem U6 promoters (Extended Data Fig. 3a). Their transfection in NIH/3T3 cells resulted in comparable levels of the two sgRNAs, efficient cleavage the targeted sites, and accumulation of the Eml4-Alk inversion (Extended Data Fig. 3b, 3c, 3d).
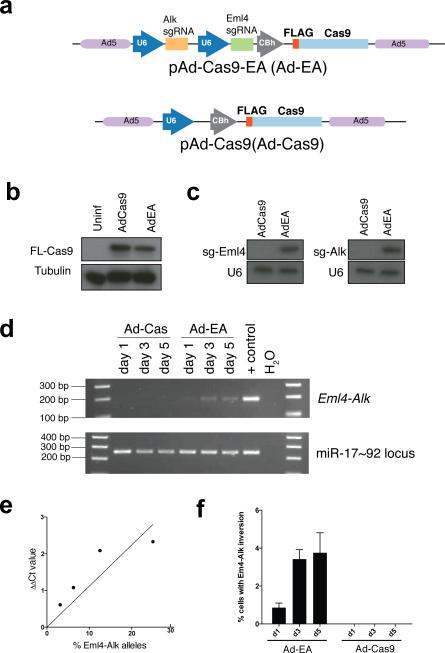
To deliver Cas9 and sgRNAs targeting the Alk and Eml4 loci to the lungs of adult mice, we next transferred the dual sgRNA/Cas9 cassette into an adenoviral shuttle vector (Extended Data Fig. 4a) and produced recombinant adenoviruses (hereafter referred to as “Ad-EA”). Adenoviral vectors are ideal because they efficiently infect the lung epithelium of adult mice26 and do not integrate into the host genome. Infection of mouse embryo fibroblasts (MEFs) with Ad-EA led to the expression of Cas9 and both sgRNAs, and to the rapid generation of the desired Eml4-Alk inversion (Extended Data Fig. 4b, 4c, 4d). We estimated that the Eml4-Alk inversion was produced in approximately 3-4% of infected MEFs (Extended Data Fig. 4e, 4f).
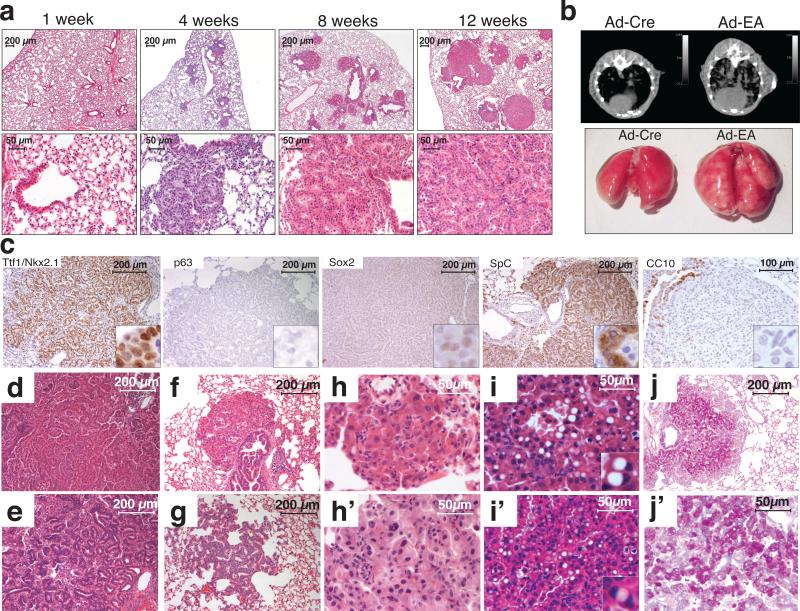
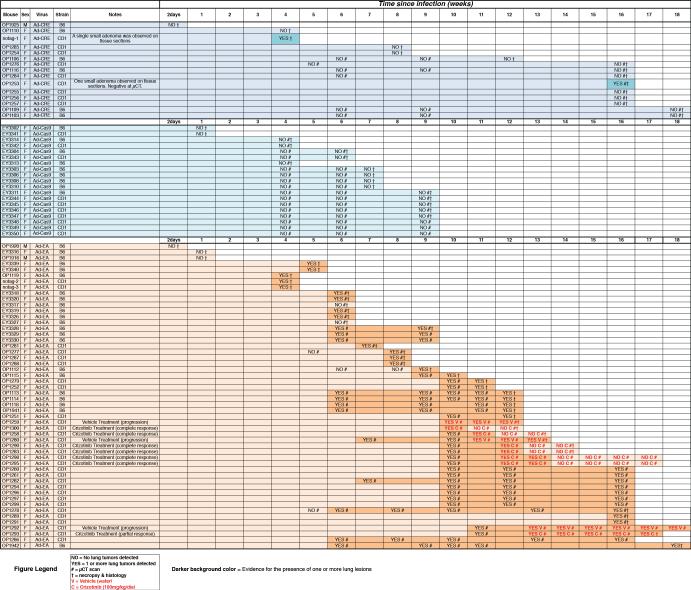
To induce the Eml4-Alk rearrangement in vivo we next infected a cohort of adult CD1 and C57BL/6J (B6) mice by intratracheal instillation of Ad-EA (n=52; 22 B6, 30 CD1) or control adenoviruses expressing either the Cre recombinase (Ad-Cre, n=15; 6 B6, 9 CD1) or Cas9 alone (Ad-Cas9, Fig. 2a, 2b, 2c, n=19; 9 B6, 10 CD1). An annotated list of all infected animals is provided in Extended Data Table 1.
Figure 2. Intratracheal delivery of Ad-EA leads to lung cancer formation in mice.
(a) Hematoxylin-eosin staining of lungs from mice at the indicated times after intratracheal instillation of Ad-EA. (b) Representative μCT scans (top) and macroscopic appearance (bottom) of lungs from mice at 8 weeks post-infection with Ad-Cre or Ad-EA. Numerous neoplastic lesions are evident in the Ad-EA-infected lung. (c) Representativeimmunostainings of Ad-EA-induced lung tumors with the indicated antibodies. (d-j’) Tumor architecture and cytology of Ad-EA induced tumors. Representative micrographs showing: papillary (d) or acinar (e) tumors, lesions originating in proximity of intrabronchial hyperplasia (f), atypical adenomatous hyperplasia (g), mild to moderate nuclear atypia (h, h’), cells with large cytoplasmic vacuole and eccentric nuclei (i, i’), and PAS-positive tumors (j, j’).
At two days and at one week post-infection the lungs appeared histologically normal with no obvious signs of cytoxicity except for the presence of occasional inflammatory infiltrates (Fig. 2a and data not shown). However, one month after Ad-EA infection, the lungs of mice of both strains presented multiple small lesions that upon histopathological examination appeared to be papillary intrabronchiolar epithelial hyperplasia, atypical adenomatous hyperplasia (AAH), or early well-differentiated adenocarcinomas. By 6-8 weeks post-infection, larger tumors were easily detectable by micro-computed tomography (μCT) and macroscopically visible at necropsy (Fig. 2b). At 12-14 weeks post-infection, the lungs of Ad-EA-infected mice invariably contained multiple large lesions histologically classified as lung adenocarcinomas.
In Ad-EA-infected animals, multiple bilateral lung tumors were frequently detected by 4-7 weeks post-infection (n=23/26 mice), and invariably after 8 weeks post-infection (n=34). In contrast, Ad-Cre-infected mice remained tumor-free at all time points examined (n=14 mice, range 4-18 weeks), with the exception of two CD1 mice in each of which we observed a single small adenoma. Analogously, even at the latest time point examined (9 weeks post-infection), none of the Ad-Cas9 infected mice presented lung tumors (n=8 mice), while at same time point all Ad-EA infected mice had developed multiple tumors (P-value < 0.0001, Fisher's exact test). These results indicate that intra-trachel delivery of Ad-EA can initiate lung tumorigenesis with high penetrance and low latency, and that this effect cannot be attributed to adenoviral infection or Cas9 expression alone.
All tumors examined were positive for the pneumocyte marker Nkx-2.1/TTF1 and negative for p63 and Sox2, in agreement with the diagnosis of lung adenocarcinoma (Fig. 2c). The tumors were also strongly positive for the alveolar type II marker Surfactant Protein C (SpC), whereas the Clara cell marker CCSP/CC10 was undetectable. The adenocarcinomas had a papillary or, less frequently, acinar architecture (Fig. 2d, 2e). Most of these tumors were in close proximity to bronchi and bronchioles showing papillary epithelial hyperplasia (Fig. 2a, 2f), and areas of AAH were frequently observed, especially at earlier time points (Fig. 2g). The majority of tumor cells appeared low-grade, with occasional instances of intermediate nuclear atypia with enlarged nuclei and prominent nucleoli (Fig. 2h, 2h’). Approximately 20% of tumors contained cells with a large cytoplasmic vacuole and a peripherally located nucleus (Fig. 2i, 2i’). These cells are reminiscent of signet ring cells, which are commonly observed in human ALK+ NSCLC27. Approximately 30% of adenocarcinomas displayed areas of intense positivity at the periodic acid-Schiff (PAS) staining (Fig. 2j. 2j’).
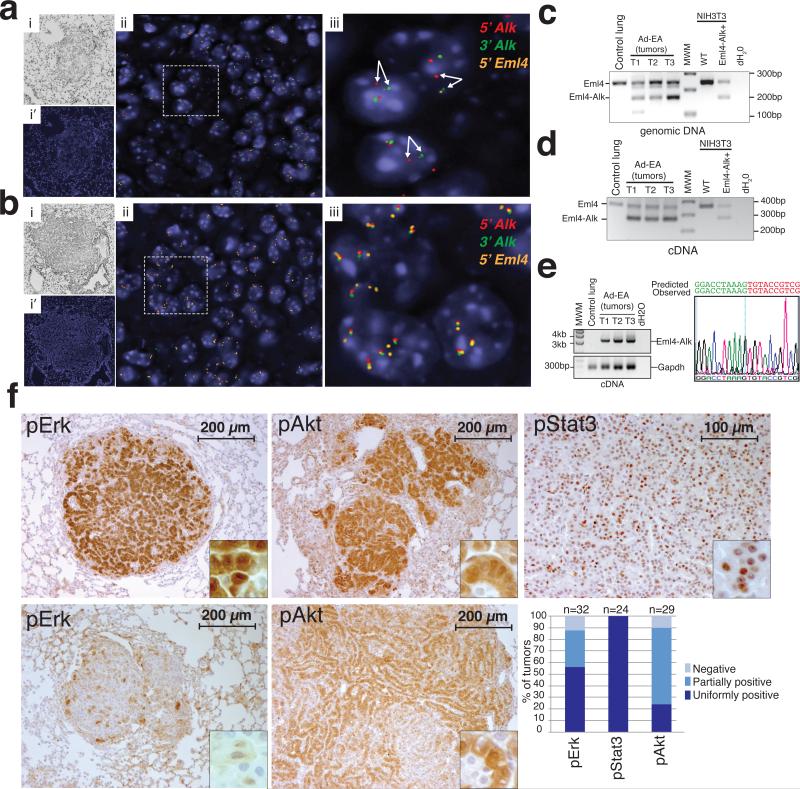
Interphase FISH analysis demonstrated the presence of a mono- or bi-allelic Eml4-Alk inversion in every Ad-EA-induced tumor examined (n=4 animals) (Fig. 3a), but not in control K-RasG12D-driven tumors28 (Fig. 3b). We further confirmed the presence of the inversion and expression of the full-length Eml4-Alk transcript by PCR and RT-PCR analysis of micro-dissected tumors followed by sequencing (Fig. 3c, 3d, 3e).
Figure 3. Lung tumors induced by Ad-EA infection harbor the Eml4-Alk inversion.
(a) Break-apart interphase FISH showing the presence of the Eml4-Alk inversion in a tumor from an Ad-EA-infected mouse (8 weeks post-infection) and (b) wild type configuration of the Eml4 and Alk loci in a control tumor from a conditional K-RasG12D mouse. (i) Bright Field. (i’, ii, iii increasing magnifications of merged fluorescent channels) (c) Detection of the wild type Eml4 locus and Eml4-Alk inversion in micro-dissected tumors from Ad-EA-infected mice using a three-primer PCR strategy. (d) RNAs extracted from the same tumors shown in (c) were reverse-transcribed and amplified using a three-primer strategy to detect the Eml4 and Eml4-Alk transcripts. (e) RT-PCR detection (left) of the full length Eml4-Alk cDNA (~3.2 Kb) in the tumors shown in (c). The full-length PCR products were sequenced on both strands. A chromatogram of the Eml4-Alk junction is shown (right). (f) Representative immunohistochemistry of Ad-EA-induced lung tumors decorated with antibodies against the indicated phospho-proteins. A bar-plot of staining intensity for the indicated phospho-proteins is also shown. Tumors from two mice for each group were scored.
Activation of the human ALK oncogene via deregulation, translocation, or amplification has been shown to lead to constitutive phosphorylation of ERK, STAT3, and AKT29. At 12-14 weeks post-infection, all lung tumors derived from Ad-EA-injected mice showed phosphorylation and nuclear localization of Stat3. Phosphorylation of Akt and Erk1/2 were also frequently, but not invariably, observed (Fig. 3f, 3g).
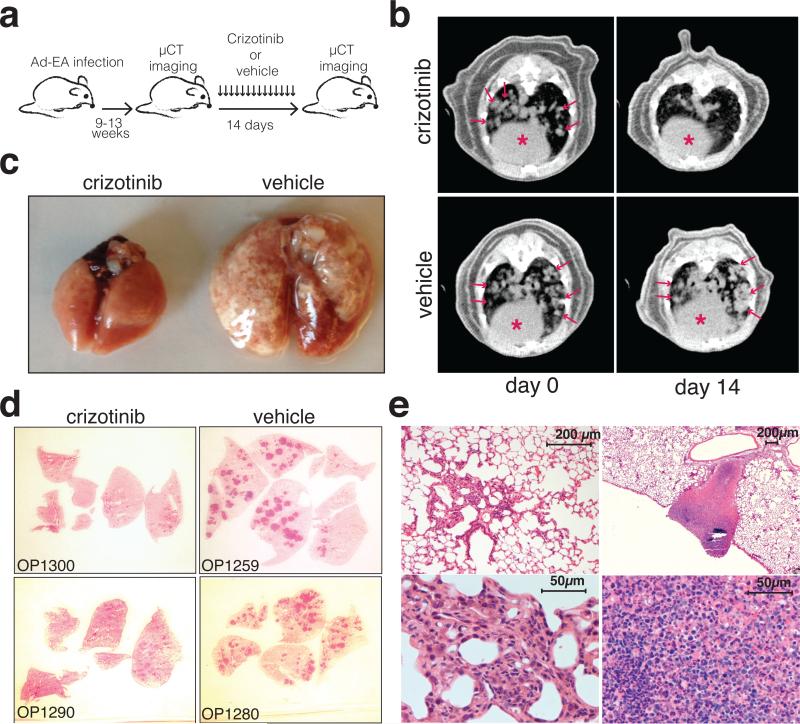
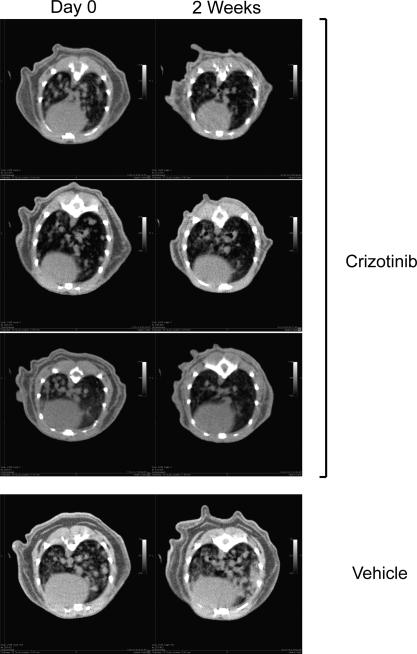
Finally, we examined the sensitivity of Ad-EA-induced lung tumors to crizotinib, a dual ALK/MET inhibitor used in the clinic to treat patients affected by ALK+ NSCLCs3. Ten Ad-EA infected CD1 mice were monitored by μCT scans starting at 9 weeks post-infection until the appearance of multiple large lung tumors, at which point the animals were randomly assigned to receive a daily dose of crizotinib (n=7) or vehicle (n=3) (Fig. 4a). After two weeks of treatment the animals in the crizotinib group displayed complete (6/7) or partial (1/7) tumor regression, as indicated by μCT scans and confirmed at necropsy, while all control animals showed signs of disease progression (Fig. 4b, 4c, Extended Data Fig. 5, Extended Data Table 2, Supplementary Videos 1-10). Histological analysis showed that in the crizotinib group the tumors had undergone marked atrophy or were replaced by areas of intense inflammatory necrosis (Fig. 4d, 4e).
Figure 4. Ad-EA-induced lung tumors respond to crizotinib treatment.
(a) Schematic of the experiment. (b) Representative μCT of the lungs of mice treated with crizotinib or vehicle at day 0 and after 2 weeks of treatement. Lung tumors are indicated by arrows. Red asterisks mark the hearts. (c) Macroscopic appearance of the lungs after 2 weeks of treatment. (d) Low magnification of lung sections from two crizotinib- and 2 vehicle-treated mice (hematoxylin eosin). (e) Higher magnification of representative hematoxylin-eosin stained lung sections from crizotinib-treated mice showing residual atrofic foci of tumor cells (left) or necrotic-inflammatory debris (right).
Collectively, these results demonstrate that the CRISPR technology can be adapted to engineer oncogenic chromosomal rearrangements in mice. The new mouse model of Eml4-Alk-driven lung cancer we have generated to validate this approach faithfully recapitulates the molecular and biological properties of human ALK+ NSCLCS, including a marked sensitivity to the ALK-inhibitor crizotinib. This model provides unique opportunities to dissect the molecular mechanisms through which Eml4-Alk drives tumor formation, to test the efficacy of targeted therapies, and to investigate the mechanisms of drug resistance in vivo.
The CRISPR-based strategy described here offers several advantages over germline engineering via transgenesis or homologous recombination. By inducing the rearrangement in only a subset of somatic cells, the resulting lesions more closely recapitulate the stochastic nature of tumor formation in humans. In addition, by modifying the endogenous loci, expression of the resulting fusion genes is subjected to physiologic transcriptional and post-transcriptional regulation, accurately modeling the reduced dosage of the wild type alleles and the expression of the reciprocal product of the translocation/inversion. Finally, because our method requires only the generation of an appropriate viral vector and no germline manipulations, it can be readily adapted to model chromosomal rearrangements in other species, including non-human primates, and as such will facilitate the study of species-specific differences in tumor progression and therapy response in vivo.
Despite these key advantages, some caveats of the CRISPR technology must also be considered. The efficiency with which the rearrangements are induced is relatively low and is likely to be affected by the distance between the cut sites and their accessibility to Cas9. While a low efficiency may be desirable when inducing oncogenic rearrangements, it is a concern if the goal is to generate chromosomal rearrangements in the majority of cells. Furthermore, every possible allele combination of the two target loci (indels, inversions, deletions) will be induced by the dual sgRNA/Cas9 system30, potentially complicating the interpretation of these studies.
In summary, the general strategy we have developed substantially expands our ability to model cancers driven by chromosomal rearrangements and will facilitate the development of pre-clinical models to study the mechanisms of drug resistance and test novel therapies.
Methods
Plasmids and adenoviral vectors
The pX330 vector expressing Cas9 (Addgene plasmid 42230) was digested with BbsI and ligated to annealed and phosphorylated sgRNA oligos targeting Eml4, Alk, and Npm1. For cloning of tandem U6-sgRNA-Cas9 constructs, the second U6-sgRNA cassette was amplified using primers containing the XbaI and KpnI sites and cloned into the pX330 construct containing the appropriate sgRNA. For Adeno-Eml4-Alk cloning, pX330-Alk-Eml4 vector was modified by adding an XhoI site upstream the first U6 promoter. An EcoRI-XhoI fragment containing the double U6-sgRNA cassette and the Flag-tagged Cas9 was then ligated the EcoRI-XhoI-digested pacAd5 shuttle vector. NIH/3T3 cells were transfected in 6-well plates with 3 μg of total plasmid DNA per well using lipofectamine 2000 (Invitrogen) following manufacturer's instructions. To enrich for transfected cells, transfections included 1 μg of a plasmid expressing the Puro-resistance gene (pSico) and cells were incubated with 2 μg/ml Puromycin for 2 days. Recombinant adenoviruses were generated by Viraquest (Ad-EA and Ad-Cas9) or purchased from the University of Iowa (Ad-Cre). MEFs infections were performed by adding Adenovirus (3×10⁶ PFU) to each well of a 6-well plate.
PCR and RT-PCR analysis
For PCR analysis of genomic DNA, cells were collected in lysis buffer (100 nM Tris-HCl pH 8.5, 5 mM EDTA, 0.2% SDS, 200 mM NaCl supplemented with fresh proteinase K at final concentration of 100 ng/ml). Genomic DNA was extracted with phenol-chloroform-isoamylic alcohol and precipitated in ethanol. The DNA pellet was dried and re-suspended in double-distilled water. For RT-PCR, total RNAs were extracted with Trizol (Life Technologies) following manufacturer's instructions. cDNAs were prepared using the Superscript III kit, following manufacturer's instructions. The primers and the primer pairs used in the various PCR reactions are provided in Extended Table 3 and Extended Table 4.
Quantification of inversion efficiency in MEFs
We first isolated an NIH/3T3 subclone carrying a mono-allelic Eml4-Alk inversion validated by interphase FISH. Genomic DNA extracted from this clone was mixed with increasing amounts of genomic DNA from parental NIH/3T3 cells to generate a series of standards containing known percentage of Eml4-Alk alleles. The standards and the test samples were then subjected to quantitative PCR (Applied Biosystem) using primers amplifying the Eml4-Alk junction (Eml4-for and Alk-rev, see Extended Data Table 3) or a control gene (miR-17~92-gDNA-for and miR-17~92-gDNA-rev) and the fraction of Eml4-Alk alleles in the test was calculated by plotting the ΔΔCt values on the standard curve. qPCR analysis was performed using Syber Green (Life Technology).
Cell lines
MEFs were generated from E14.5 wild type embryos following standard procedures. NIH/3T3 were purchased from ATCC.
Mouse husbandry and adenoviral infection
Mice were purchased from The Jackson Laboratory (C57BL/6J) or from Charles River (CD1) and housed in the SPF MSKCC animal facility, where the health status of the colony is constantly monitored by the veterinary staff and by a sentinel program. For adenoviral infection, 6-10-week-old mice were anesthetized by intra peritoneal injection of ketamine (80 mg/kg) and xylazine (10 mg/kg) and treated by intratracheal instillation of 1.5×10⁸ PFU adenovirus/mouse, as previously described26. Investigators were not blinded with respect to which adenovirus was injected. All studies and procedures were approved by the Memorial Sloan-Kettering Cancer Center Institutional Animal Care and Use Committee.
Interphase Fluorescent In Situ Hybridization
Interphase FISH experiments were performed and interpreted by the MSKCC cytogenetic core using a 3-color probe mix designed to detect and discriminate between Alk-Eml4 fusion and other rearrangements of Alk. The probe mix comprised mouse BAC clones mapping to: 3’Alk (17qE1.3, RP23-306H20, RP23-397M18 labeled with Green dUTP), 5’Alk (17qE1.3, RP23-12H17, RP23-403F20 labeled with Red dUTP), and 5’Eml4 (17qE4, RP23-193B15 labeled with Orange dUTP). Probe labeling, hybridization, washing, and fluorescence detection were done according to standard procedures. Cell line harvest and metaphase spreads were prepared according to standard cytogenetics procedures. For NIH/3T3, FISH signals were enumerated in a minimum of 20 metaphases to determine locus specificity, and 100 interphase cells to determine Alk-Eml4 fusion status. Each paraffin section was first scanned under 100× objective to assess signal pattern and select representative regions for analysis. At least three images per representative region were captured (each image was a compressed stack of 12 z-sections at 0.5 micron intervals). Signal counts were performed on the captured images and a minimum of 50 interphase nuclei was analyzed to determine the Alk-Eml4 fusion status. Based on the observed distance between the Green (3’Alk), Red (5’Alk), and Orange (5’Eml4) signal in the negative controls (parental cell line and Ad-Cre-infected cells), interphase cells were classified as normal, Eml4-Alk positive, or other.
Surveyor assay
The genomic region flanking the CRISPR/Cas9 target site was first amplified by PCR. After a cycle of melting and re-annealing to allow heteroduplex formation, the amplicon was digested with the surveyor nuclease (Transgenomic) for 1 hour at 42°C according to manufacturer's directions and the digestion products were separated on a 2% agarose gel.
Northern blot analysis
10 μg of RNA previously extracted with Trizol (Life Technologies) were run on a 15% denaturing polyacrylamide gel and blotted on a nitrocellulose membrane for 1 hour at 100 V at room temperature. The membranes were then hybridized to radiolabeled oligonucleotides complementary to the Alk (5’-TACAGATAGACATGCCAGGAC), Eml4 (5’-TCCTAGTAGACCCCGACAAAC) sgRNAs, or mU6 (5'-GCAGGGGCCATGCTAATCTTCTCTGTATCG) dissolved in ExpressHyb (Clontech) at 42°C overnight. Washes were performed at room temperature in 2X SSC and 0.2 SSC.
Lung processing and Antibodies for immunohistochemistry
Lungs were inflated by intratracheal injection of 4% paraformaldehyde (PFA), incubated for 18-24 hours in 4% PFA, and then transferred to 70% ethanol for at least 24 hours before further processing. The following antibodies were used: Phospho-Stat3 (Tyr705, Cell Signaling Technology #9135, 0.1 μg/ml); Phospho-Erk1/2 (Thr202/Tyr204, Cell Signaling Technology #4370 1 μg/ml); Phospho-Akt (Ser473, Cell Signaling Technology #4060 1 μg/ml); Nkx-2.1 (Epitomics, EP1584Y 1:1200); FLAG (Sigma, M2 1:1000); P63 (Santa Cruz (H-137) sc8343, 1:1000); Sox2 (Cell Signaling Technology, C70B1 #3728, 1:1000); CC10/CCSP (Millipore, 07-623, 1:2000); SpC (Millipore, AB3786, 1:1000).
μCT imaging
μCT Scans were performed on the Mediso Nano SPECT/CT System covering only the lung fields of each mouse. Each scan averaged approximately 5 minutes using 240 projections with an exposure time of 1000 ms set at a pitch of 1 degree. The tube energy of the x-ray was 55 kVp and 145 μA. The in-plane voxel sizes chosen were small and thin creating a voxel size of 73 × 73 × 73 μm. The final reconstructed image consisted of 368 × 368 × 1897 voxels. Scans were analyzed with the Osirix software.
Crizotinib treatment
Mice were randomized to receive either control vehicle (water) or crizotinib at 100 mg/kg p.o. daily for at least 14 consecutive days. Mice were monitored daily for weight loss and clinical signs. Investigators were not blind with respect to treatment.
Extended Data
Extended Data Figure 1. Human and murine Eml4-Alk.
(a) Alignement of human Eml4 exon 13 and mouse Eml4 exon 14. (b) Alignment of the junction between the human EML4-ALK (variant 1) and the predicted murine Eml4-Alk proteins.
Extended Data Figure 2. Induction of the Npm1-Alk translocation in NIH/3T3 cells.
(a) Schematic of the Npm1-Alk translocation. Red arrows indicate the sites recognized by the sgRNAs. (b) Sequences recognized by the sgRNAs and location of primers used to detect the Npm1-Alk and Alk-Npm1 rearrangement (top panel). PCR on genomic DNA extracted from NIH/3T3 co-transfected with pX330 constructs expressing the indicated sgRNAs (middle panel). Sequences of four independent subclones obtained from the PCR products and representative chromatogram (bottom panel). (c) Detection of the Npm1-Alk fusion transcript by RT-PCR on total RNAs extracted from NIH/3T3 cells cotransfected with the indicated pX330 constructs (left panel). The PCR band was extracted and sequenced to confirm the presence of the correct Npm1-Alk junction (bottom-right panel). Representative results from two independent experiments.
Extended Data Figure 3. Comparison of dual and single sgRNA-expressing plasmids.
(a) Schematic of pX330 (A) and its derivatives (B-E) used in these experiments. NIH/3T3 were transfected with these constructs and lysed to extract total RNA and genomic DNA. (b) RNAs were analyzed by Northern blotting with probes against the Alk (left) or Eml4 (right) sgRNAs. (c) The DNA samples were subjected to surveyor assays, or (d) amplified by PCR to detect the Eml4-Alk inversion.
Extended Data Figure 4. Induction of the Eml4-Alk inversion in primary MEFs using an adenoviral vector expressing FLAG-Cas and tandem sgRNAs.
(a) Schematic of the Adenoviral vectors. (b) Immunoblot using a anti-FLAG antibody on lysates from MEFs infected with the indicated adenoviruses. (c) Small-RNA northerns using probes against sgEml4 and sgAlk on total RNAs from cells infected with Ad-Cas9 or Ad-EA. (d) PCR-mediated detection of the Eml4-Alk inversion in MEFs infected with Ad-Cas9 or Ad-EA for the indicated number of days. (e) Standard curve generated performing quantitative PCR analysis on genomic DNA containing known fraction of Eml4-Alk alleles. Average of two independent experiments. (f) Quantification of the fraction of MEFs harboring the Eml4-Alk inversion at the indicated time points after infection with Ad-EA or Ad-Cas9. Values are mean of three independent infections ± s.d.
Extended Data Figure 5. Radiologic response of Ad-EA-induced tumors to crizotinib treatment.
μCT images from crizotinib- or vehicle-treated mice at day 0 and after 2 weeks of treatement.
Extended Data Table 1.
Mouse cohorts.
|
This excel spreadsheet contains an annotated list of every mouse used in this study and the virus used for the intra-tracheal infection. The interval (in weeks) since infection is shown as a colored horizontal bar. The time, outcome, and method of tumor detection are also reported. Symbols used are: “YES” = 1 or more tumor detected; “NO” = No tumors detected. # = Evaluation by μCT; † = Evaluation by necropsy and histopathology; V = mouse treated with vehicle (water); C = mouse treated with crizotinib (100mg/kg/die).
Extended Data Table 2.
Response to crizotinib treatment.
| Mouse ID | Sex | Time (weeks) since infection at the start of treatment | Weeks treated | Treatment | Outcome at 2 weeks | Notes |
|---|---|---|---|---|---|---|
| OP1300 | F | 9.7 | 2 | Crizotinib | Complete Response | Suppl. Videos 3 and 4 |
| OP1290 | F | 12.3 | 2 | Crizotinib | Complete Response | Suppl. Videos 7 and 8 |
| OP1283 | F | 12.3 | 2 | Crizotinib | Complete Response | |
| OP1258 | F | 11.0 | 2 | Crizotinib | Complete Response | |
| OP1293 | F | 13.3 | 2 | Crizotinib | Partial Response | Suppl. Videos 9 and 10 |
| OP1295 | F | 12.0 | 2 | Crizotinib | Complete Response | |
| OP1298 | F | 12.0 | 2 | Crizotinib | Complete Response | |
| OP1280 | F | 11.0 | 2 | Vehicle | Progression | Suppl. Videos 5 and 6 |
| OP1259 | F | 12.0 | 2 | Vehicle | Progression | Suppl. Videos 1 and 2 |
| OP1292 | F | 13.3 | 2 | Vehicle | Progression |
Table showing the response to crizotinib or vehicle treatment as judged by μCT.
Extended Data Table 3.
Oligonucleotides used in this study.
| Name | Sequence |
|---|---|
| Alk_cDNA-rev | GGTCATGATGGTCGAGGTCC |
| Alk_Exon29_rev | GCTAGTGGAGTACAGGGCTC |
| Alk_gDNA-for (primer D Fig 1b and Supp Fig1b) | GCAGCGGGGCTTCCGAAGGGGC |
| Alk_gDNA-rev (primer C Fig 1b and Supp Fig1b) | GTTTTACTGTGTCAGAAAGGG |
| Alk-rev | CAAGGCAGTGAGAACCTGAA |
| Eml4_cDNA-for | TGGAGTGGCAACTCACTAACAA |
| Eml4_cDNA-rev | GCAACTGCTCTAATGGTGCC |
| Eml4_Exon1_for | TAGAACTCGAGGCAAGATGGACGGTTTCGC |
| Eml4_gDNA-for (primer A Fig1b) | GCTCAAGAGGTGGGTTGTGT |
| Eml4_gDNA-rev (primer B Fig1b) | CAGGGCTGTGCCTAGATGAC |
| Eml4-for | GAGCCTTGTTGATACATCGTTC |
| Eml4-rev | TAGGAGGCAGTTTGGGCTAC |
| GAPDH_cDNA-for | ACCACAGTCCATGCCATCACTGCC |
| GAPDH_cDNA-rev | GTCTCGCTCCTGGAAGATGG |
| miR17-92_gDNA-for | TCGAGTATCTGACAATGTGG |
| miR17-92_gDNA-rev | TAGCCAGAAGTTCCAAATTGG |
| Npm1_cDNA-for | ACTACCTTTTCGGCTGTGAACT |
| Npm1_gDNA-for (primer A Supp Fig1b) | GTCTCTTGCGTCATTTGGGG |
| Npm1_gDNA-rev (primer B Supp Fig1b) | CTCCAGGAGCAGATCGCTTT |
This table lists the name and sequence of each DNA oligonucleotide used in this study.
Extended Data Table 4.
Primer pairs and PCR reactions.
| Name | Description | Expected size (bp) |
|---|---|---|
| Alk_gDNA-for | Surveyor assay | 961 |
| Alk_gDNA-rev | ||
| Eml4_gDNA-for | Surveyor assay | 602 |
| Eml4_gDNA-rev | ||
| Eml4_gDNA-for | Eml4-Alk genomic | 527 |
| Alk_gDNA-rev | ||
| Alk_gDNA-for | Alk-Eml4 genomic | 1036 |
| Eml4_gDNA-rev | ||
| Eml4_gDNA-for | Deletion | 1044 |
| Alk_gDNA-for | ||
| miR17-92_gDNA-for | Control (gDNA) | 255 |
| miR17-92_gDNA-rev | ||
| GAPDH_cDNA-for | Control (cDNA) | 237 |
| GAPDH_cDNA-rev | ||
| Eml4-for | Eml4-Alk genomic (three primers) |
Eml4: 240 Eml4-Alk: 190 |
| Eml4-rev | ||
| Alk-rev | ||
| Eml4_cDNA-for | Eml4-Alk transcript (three primers) |
Eml4: 336 Eml4-Alk: 276 |
| Eml4_cDNA-rev | ||
| Alk_cDNA-rev | ||
| Eml4_cDNA-for | Eml4-Alk transcript (junction) | 276 |
| Alk_cDNA-rev | ||
| Eml4_Exon1_for | Eml4-Alk transcript (full length) | 3238 |
| Alk_Exon29_rev | ||
| Npm1_gDNA-for | Npm1-Alk genomic | 581 |
| Alk_gDNA-rev | ||
| Alk_gDNA-for | Alk-Npm1 genomic | 1036 |
| Npm1_gDNA-rev | ||
| Npm1_cDNA-for | Npm1-Alk transcript | 404 |
| Alk_cDNA-rev |
This table lists the primer pairs and the sizes of the expected products for each PCR reaction described in this study.
Supplementary Material
Acknowledgements
We would like to thank Maurizio Fazio, Marc Ladanyi, Gregory Riely, Scott Armstrong, and the members of the Ventura, Lowe, and Jacks laboratories for discussion and comments. We also thank Jennifer Hollenstein for editing the manuscript, Tyler Jacks for providing tumor samples from K-RasG12D mice, and the Cytogenetic Core Facility of MSKCC for tissue processing and histology. This work was supported by grants from the Geoffrey Beene Cancer Research Foundation (AV), NCI (Cancer Center Support Grant P30 CA008748, EdS), HHMI (SWL), NCI Project Grant (SWL); and by fellowships from the American Italian Cancer Foundation (DM), the Foundation Blanceflor Boncompagni Ludovisi, née Bildt (DM), and the Jane Coffin Childs Foundation (EM). CPC was supported by an NCI training grant.
Footnotes
Author contributions
DM and AV conceived the project, designed and analyzed the experiments, and wrote the manuscript. SWL contributed to the interpretation of the results and the writing of the manuscript. DM generated and tested the constructs, performed the cell-based experiments, and characterized the Eml4-Alk tumors. EM, DM, CB, YCH, and PO performed the in vivo experiments. EdS supervised the crizotinib treatment experiments and analyzed the results. JAV, DM, CPC, and AV microdissected and analyzed lung tumors to detect the Eml4-Alk inversion. CB, DM, and AC performed the immunostainings. NR reviewed the histopathology.
The authors declare no competing financial interests.
REFERENCES
- 1.Taki T, Taniwaki M. Chromosomal translocations in cancer and their relevance for therapy. Current opinion in oncology. 2006;18:62–68. doi: 10.1097/01.cco.0000198972.69541.04. [DOI] [PubMed] [Google Scholar]
- 2.Soda M, et al. Identification of the transforming EML4-ALK fusion gene in non-small-cell lung cancer. Nature. 2007;448:561–566. doi: 10.1038/nature05945. doi:10.1038/nature05945. [DOI] [PubMed] [Google Scholar]
- 3.Kwak EL, et al. Anaplastic lymphoma kinase inhibition in non-small-cell lung cancer. The New England journal of medicine. 2010;363:1693–1703. doi: 10.1056/NEJMoa1006448. doi:10.1056/NEJMoa1006448. [DOI] [PMC free article] [PubMed] [Google Scholar]
- 4.Tuveson DA, Jacks T. Technologically advanced cancer modeling in mice. Current opinion in genetics & development. 2002;12:105–110. doi: 10.1016/s0959-437x(01)00272-6. [DOI] [PubMed] [Google Scholar]
- 5.Sharpless NE, Depinho RA. The mighty mouse: genetically engineered mouse models in cancer drug development. Nature reviews. Drug discovery. 2006;5:741–754. doi: 10.1038/nrd2110. doi:10.1038/nrd2110. [DOI] [PubMed] [Google Scholar]
- 6.Pirazzoli V, et al. Acquired resistance of EGFR-mutant lung adenocarcinomas to afatinib plus cetuximab is associated with activation of mTORC1. Cell reports. 2014;7:999–1008. doi: 10.1016/j.celrep.2014.04.014. doi:10.1016/j.celrep.2014.04.014. [DOI] [PMC free article] [PubMed] [Google Scholar]
- 7.Bergers G, Hanahan D. Modes of resistance to anti-angiogenic therapy. Nature reviews. Cancer. 2008;8:592–603. doi: 10.1038/nrc2442. doi:10.1038/nrc2442. [DOI] [PMC free article] [PubMed] [Google Scholar]
- 8.Rottenberg S, et al. Selective induction of chemotherapy resistance of mammary tumors in a conditional mouse model for hereditary breast cancer. Proceedings of the National Academy of Sciences of the United States of America. 2007;104:12117–12122. doi: 10.1073/pnas.0702955104. doi:10.1073/pnas.0702955104. [DOI] [PMC free article] [PubMed] [Google Scholar]
- 9.Heisterkamp N, et al. Acute leukaemia in bcr/abl transgenic mice. Nature. 1990;344:251–253. doi: 10.1038/344251a0. doi:10.1038/344251a0. [DOI] [PubMed] [Google Scholar]
- 10.Zuber J, et al. Mouse models of human AML accurately predict chemotherapy response. Genes & development. 2009;23:877–889. doi: 10.1101/gad.1771409. doi:10.1101/gad.1771409. [DOI] [PMC free article] [PubMed] [Google Scholar]
- 11.Lange K, et al. Overexpression of NPM-ALK induces different types of malignant lymphomas in IL-9 transgenic mice. Oncogene. 2003;22:517–527. doi: 10.1038/sj.onc.1206076. doi:10.1038/sj.onc.1206076. [DOI] [PubMed] [Google Scholar]
- 12.Chiarle R, et al. NPM-ALK transgenic mice spontaneously develop T-cell lymphomas and plasma cell tumors. Blood. 2003;101:1919–1927. doi: 10.1182/blood-2002-05-1343. doi:10.1182/blood-2002-05-1343. [DOI] [PubMed] [Google Scholar]
- 13.Soda M, et al. A mouse model for EML4-ALK-positive lung cancer. Proceedings of the National Academy of Sciences of the United States of America. 2008;105:19893–19897. doi: 10.1073/pnas.0805381105. doi:10.1073/pnas.0805381105. [DOI] [PMC free article] [PubMed] [Google Scholar]
- 14.Corral J, et al. An Mll-AF9 fusion gene made by homologous recombination causes acute leukemia in chimeric mice: a method to create fusion oncogenes. Cell. 1996;85:853–861. doi: 10.1016/s0092-8674(00)81269-6. [DOI] [PubMed] [Google Scholar]
- 15.Smith AJ, et al. A site-directed chromosomal translocation induced in embryonic stem cells by Cre-loxP recombination. Nature genetics. 1995;9:376–385. doi: 10.1038/ng0495-376. doi:10.1038/ng0495-376. [DOI] [PubMed] [Google Scholar]
- 16.Collins EC, Pannell R, Simpson EM, Forster A, Rabbitts TH. Inter-chromosomal recombination of Mll and Af9 genes mediated by creloxP in mouse development. EMBO reports. 2000;1:127–132. doi: 10.1093/embo-reports/kvd021. doi:10.1038/sj.embor.embor616. [DOI] [PMC free article] [PubMed] [Google Scholar]
- 17.Piganeau M, et al. Cancer translocations in human cells induced by zinc finger and TALE nucleases. Genome research. 2013;23:1182–1193. doi: 10.1101/gr.147314.112. doi:10.1101/gr.147314.112. [DOI] [PMC free article] [PubMed] [Google Scholar]
- 18.Torres R, et al. Engineering human tumour-associated chromosomal translocations with the RNA-guided CRISPR-Cas9 system. Nature communications. 2014;5:3964. doi: 10.1038/ncomms4964. doi:10.1038/ncomms4964. [DOI] [PubMed] [Google Scholar]
- 19.Brunet E, et al. Chromosomal translocations induced at specified loci in human stem cells. Proceedings of the National Academy of Sciences of the United States of America. 2009;106:10620–10625. doi: 10.1073/pnas.0902076106. doi:10.1073/pnas.0902076106. [DOI] [PMC free article] [PubMed] [Google Scholar]
- 20.Choi PS, Meyerson M. Targeted genomic rearrangements using CRISPR/Cas technology. Nature communications. 2014;5:3728. doi: 10.1038/ncomms4728. doi:10.1038/ncomms4728. [DOI] [PMC free article] [PubMed] [Google Scholar]
- 21.Choi YL, et al. Identification of novel isoforms of the EML4-ALK transforming gene in non-small cell lung cancer. Cancer research. 2008;68:4971–4976. doi: 10.1158/0008-5472.CAN-07-6158. doi:10.1158/0008-5472.can-07-6158. [DOI] [PubMed] [Google Scholar]
- 22.Horvath P, Barrangou R. CRISPR/Cas, the immune system of bacteria and archaea. Science. 2010;327:167–170. doi: 10.1126/science.1179555. doi:10.1126/science.1179555. [DOI] [PubMed] [Google Scholar]
- 23.Jinek M, et al. A programmable dual-RNA-guided DNA endonuclease in adaptive bacterial immunity. Science. 2012;337:816–821. doi: 10.1126/science.1225829. doi:10.1126/science.1225829. [DOI] [PMC free article] [PubMed] [Google Scholar]
- 24.Cong L, et al. Multiplex genome engineering using CRISPR/Cas systems. Science. 2013;339:819–823. doi: 10.1126/science.1231143. doi:10.1126/science.1231143. [DOI] [PMC free article] [PubMed] [Google Scholar]
- 25.Morris SW, et al. Fusion of a kinase gene, ALK, to a nucleolar protein gene, NPM, in non-Hodgkin's lymphoma. Science. 1994;263:1281–1284. doi: 10.1126/science.8122112. [DOI] [PubMed] [Google Scholar]
- 26.DuPage M, Dooley AL, Jacks T. Conditional mouse lung cancer models using adenoviral or lentiviral delivery of Cre recombinase. Nature protocols. 2009;4:1064–1072. doi: 10.1038/nprot.2009.95. doi:10.1038/nprot.2009.95. [DOI] [PMC free article] [PubMed] [Google Scholar]
- 27.Nishino M, et al. Histologic and cytomorphologic features of ALK-rearranged lung adenocarcinomas. Modern pathology : an official journal of the United States and Canadian Academy of Pathology, Inc. 2012;25:1462–1472. doi: 10.1038/modpathol.2012.109. doi:10.1038/modpathol.2012.109. [DOI] [PubMed] [Google Scholar]
- 28.Jackson EL, et al. Analysis of lung tumor initiation and progression using conditional expression of oncogenic K-ras. Genes & development. 2001;15:3243–3248. doi: 10.1101/gad.943001. doi:10.1101/gad.943001. [DOI] [PMC free article] [PubMed] [Google Scholar]
- 29.Chiarle R, Voena C, Ambrogio C, Piva R, Inghirami G. The anaplastic lymphoma kinase in the pathogenesis of cancer. Nature reviews. Cancer. 2008;8:11–23. doi: 10.1038/nrc2291. doi:10.1038/nrc2291. [DOI] [PubMed] [Google Scholar]
- 30.Canver MC, et al. Characterization of Genomic Deletion Efficiency Mediated by Clustered Regularly Interspaced Palindromic Repeats (CRISPR)/Cas9 Nuclease System in Mammalian Cells. J Biol Chem. 2014;289:21312–21324. doi: 10.1074/jbc.M114.564625. doi:10.1074/jbc.M114.564625. [DOI] [PMC free article] [PubMed] [Google Scholar]
Associated Data
This section collects any data citations, data availability statements, or supplementary materials included in this article.


