

Abstract
The ability of estrogen to shield the brain from the bio-energetic insult, hypoglycemia, is unclear. Estradiol prevents hypoglycemic activation of the energy deficit sensor, adenosine 5′-monophosphate-activated protein kinase (AMPK), in hindbrain metabolo-sensory A2 noradrenergic neurons. Here, we investigated the hypothesis that estrogen regulates A2 AMPK through control of fuel metabolism and/or upstream protein kinase/phosphatase enzyme expression. A2 cells were harvested by laser-microdissection after insulin (INS) or vehicle (V) injection of estradiol (E)- or oil (O)-implanted ovariectomized female rats. Cell lysates were evaluated by immunoblot for glycolytic, tricarboxylic acid cycle (TCA), respiratory chain, and acetyl CoA-malonyl CoA pathway enzymes. A2 phosphofructokinase (PFKL), isocitrate dehydrogenase, and pyruvate dehydrogenase and ATP synthase subunit profiles were elevated in E/V versus O/V; hypoglycemia augmented PFKL and alpha-ketoglutarate dehydrogenase expression in E only. Hypoglycemia increased A2 Ca++/calmodulin-dependent protein kinase-beta in O, while reducing PP2A in both groups. A2 phosphoAMPK levels were equivalent in O/V versus E/V, but elevated during hypoglycemia in O only. These results implicate estradiol in compensatory up-regulation of substrate catabolism and corresponding maintenance of energy stability of A2 metabolo-sensory neurons during hypoglycemia, outcomes that support the potential viability of molecular substrates for hormone action as targets for therapies alleviating hypoglycemic brain injury.
Keywords: A2 noradrenergic neurons, laser-catapult microdissection, ovariectomy, phospho-AMPK, phosphofructokinase, isocitrate dehydrogenase, calcium/calmodulin kinase, PP2A, acetyl CoA carboxylase, fatty acid synthase
Introduction
Hypoglycemia poses a significant risk of brain dysfunction as a continuous glucose supply is required to maintain high-energy nerve cell functions. Hindbrain-derived signals on availability of the oxidizable substrate fuel lactate regulate energy homeostasis [Patil and Briski, 2005a; Gujar et al., 2014]. Dorsal vagal complex A2 noradrenergic neurons express hypoglycemia-sensitive molecular biomarkers, including the ultra-sensitive energy sensor, adenosine 5′-monophosphate-activated protein kinase (AMPK) [Koshy Cherian and Briski, 2011; 2012]. These cells are a critical component of the CNS glucoregulatory circuitry as they regulate hypothalamic AMPK and metabolic effector neurotransmitter protein responses to hindbrain substrate fuel deficiency [Gujar et al., 2014].
The ovarian steroid, estradiol, protects the brain from bio-energetic insults due to hypoxia, stroke, and degenerative disease through mechanisms that include energy-producing metabolic pathway stimulation [Nilsen et al., 2004], but the impact of this hormone on nerve cell energy state during hypoglycemia is not known. Our studies show that hypoglycemia increases A2 nerve cell AMPK activity in male and ovariectomized (OVX) female, but not estrogen-replaced OVX rats [Cherian and Briski, 2011; 2012], suggesting that estradiol may prevent energetic destabilization of these cells. The present studies investigated the hypothesis that estrogen governs A2 AMPK activity during acute hypoglycemia, in part, via control of energy metabolism and/or upstream AMPK kinase/phosphatase expression. Western blot and enzyme activity analyses have been used to evaluate estrogenic regulation of glycolytic, tricarboxylic acid (TCA) cycle, and respiratory chain enzyme expression and activity [Kostanyan and Nazaryan, 1992; Nilsen et al., 2007; Chen et al., 2009] and oxidative respiration [Irwin et al., 2008] in whole brain or by brain region, e.g. cerebral cortex, cerebellum, etc. With the emergence of higher-sensitivity immunoblot techniques that permit protein analysis in large pools of CNS neurons have recently emerged (Martinet et al., 2004; Krebs et al., 2006), we developed and characterized a novel combinatory analytical approach, involving in situ immunocytochemical labeling, laser-catapult microdissection, and high-sensitivity Western blotting, of requisite sensitivity for quantitative analysis of protein expression in small-size pools of A2 neurons, e.g. 25–50 cells [Koshy Cherian and Briski, 2011; 2012]. This approach was used here in combination with physiological estradiol replacement to OVX rats [Goodman, 1978; Briski et al., 2001] to determine if estradiol regulates rate-limiting metabolic, e.g. glycolytic (phosphofructokinase) and Kreb’s citric acid cycle (isocitrate dehydrogenase, alpha-ketoglutarate dehydrogenase) pathway enzyme and respiratory chain Complex I–V protein expression in A2 cells during eu- and hypoglycemia. We also examined whether estrogen regulates expression of the upstream kinases LKB1 and CaMMKβ and the phosphatase PP2A under these conditions. Single-cell quantitative real-time RT-PCR (scqPCR) and Western blot were used to determine if A2 neurons express estrogen receptor-alpha (ERα) and/or estrogen receptor-beta (ERβ) mRNA, and to assess effects of hypoglycemia on gene product expression.
AMPK governs de novo hypothalamic fatty acid synthesis by regulation of acetyl CoA carboxylase (ACC) activity [Lam et al., 2005]. Phosphorylation of hypothalamic AMPK inhibits ACC activity, thereby decreasing malonyl-CoA, a critical intermediate that inhibits fatty acid beta-oxidation and feeding [Gao and Lane, 2003]. Malonyl-CoA levels reflect its rate of synthesis, catalyzed by ACC, relative to fatty acid synthase (FAS)-catalyzed utilization. Reports that the FAS inhibitor, C75, induces transcriptional activation in the DVC supports the possibility that enzymes involved in de novo long-chain fatty acid synthesis may be expressed locally [Hu et al., 2003]. The selective estrogen receptor modulator, tamoxifen, reportedly inhibits FAS, but not AMPK or ACC activity in the hypothalamus [Lopez et al., 2006], but the role of estradiol in fatty acid utilization in the DVC is not known. Here, we investigated the premise that synthesis and/or activation of ACC and FAS proteins in A2 neurons during hypoglycemia is estrogen-dependent.
Methods and Materials
Experimental Design
Adult female Sprague Dawley rats (230–290 g bw) were housed under a 14 hr light/10 hr dark lighting cycle, and fed and watered ad-libitum. Five days before the study, rats were OVX under ketamine/xylazine anaesthesia (0.1 mL/100 g bw sc; 90 mg ketamine:10 mg xylazine/mL; Henry Schein Inc., Melville, NY), and implanted with sc silastic capsules (i.d. 0.062 in., o.d. 0.125 in.; 10 mm/100 g bw) containing estradiol benzoate (E; 30 μg/mL safflower oil) or oil alone (O) [Briski et al., 2001] in order to mimic basal physiological estradiol concentrations measured on metestrus in 4-day [Butcher et al., 1974] or on diestrus day-2 in 5-day cycling rats [Goodman, 1978]. After surgery, rats were transferred to individual cages for recovery. On days 1–3, groups of E (n=8) and O (n=8) rats were injected sc at 11.00 hr with vehicle (V), then injected on day 4 with neutral protamine Hagedorn insulin (I; 12.5 U/kg/mL sc; Henry Schein Inc.; n=4) or V (n=4). On day 4, trunk blood and brain tissue were collected at the glucose nadir, e.g. +2 hr [Paranjape et al., 2005; Nedungadi et al., 2006]. Dissected hindbrains were snap-frozen in liquid nitrogen-cooled isopentane.
Laser-Catapult Microdissection of Tyrosine Hydroxylase (TH)-immunoreactive (-ir) A2 Neurons
Serial 10 μm frozen sections of the caudal DVC (cDVC; −14.36 to −14.86 mm posterior to Bregma) were processed for TH-ir, using mouse monoclonal antibodies (prod. no. 22941, ImmunoStar Inc., Hudson, WI) and Vectastain Elite ABC Mouse IgG kit reagents, as described [Briski et al., 2009]. Individual TH-ir neurons exhibiting an intact nucleus and complete cytoplasmic labeling were harvested with a P.A.L.M. UV-A microlaser (Carl Zeiss Microimaging, Inc., Thornwood, NY).
Palkovits Micropunch Dissection of the cDVC
The cDVC was bilaterally removed from serial 200 μm frozen hindbrain sections, from additional rats (n=4/treatment combination), using calibrated hollow micropunch needles (Stoelting, Inc., Kiel, WI), and pooled for each animal.
Western Blot Analysis of A2 Nerve Cell and cDVC Proteins
For each protein listed in Table 1, n=50 TH-ir neurons per treatment group (12–13 cells/protein/rat; n=4 rats) were collected in microfuge tubes containing 20 μL tissue lysis buffer (2% SDS, 0.05 M DTT, 10% glycerol, 1 mM EDTA, 60 mM Tris-HCl, pH 7.2) for immunoblotting; each protein analysis was performed on triplicate lysate pools. cDVC aliquots were pooled within each treatment group and evaluated in triplicate for pyruvate dehydrogenase [Elrod et al., 2010], succinate dehydrogenase (complex II), and oxidative phosphorylation enzymes [Malmgren et al., 2009]. Cell and tissue samples were separated on 4–12% or 4–20% gradient Tris-glycine gels (Jule Biotechnologies, Milford, CT) and transferred to 0.45 μm PVDF-Plus membranes (Osmonics Inc., Gloucester, MA). Membranes were pretreated with Quentix Western blot signal enhancer (Pierce, Rockford, IL), then blocked with 0.1% Tween-20 (Sigma Aldrich, St. Louis, MO) and 2% bovine serum albumin (MP Biomedicals, Solon, OH) prior to overnight primary antibody incubation. The loading control, α-tubulin, was probed with mouse monoclonal antibodies (CP06;1:2,000; Calbiochem, Gibbstown, NJ). Membranes were incubated with peroxidase-conjugated goat anti-mouse (NEF822001EA; 1:5,000; PerkinElmer, Boston, MA); goat anti-rabbit (NEF812001EA; 1:5,000; Perkin Elmer); or donkey anti-goat (sc-2020; 1:5,000; Santa Cruz Biotechnology, Santa Cruz, CA) secondary antibodies, then exposed to Supersignal West Femto Maximum Sensitivity substrate (ThermoFisherScientific, Rockford, IL). Chemiluminescent signal was visualized in a Syngene G:box Chemi. Band intensities were quantified with AlphaImager HP V 5.0.1 software (Cell Biosciences; Santa Clara, CA), and protein band optical density (O.D.) was expressed relative to α-tubulin. Protein MW markers were included in each blot.
Table 1.
Primary Antisera Used in A2 Neuron/Caudal Dorsal Vagal Complex (cDVC) Protein Western Blotting
| Antigen (Abbreviation) | Antibody Cat. No./Lot No.; Manufacturer | Primary/Secondary Dilution | MW Subunit(s) Detected in A2 cells (cDVC) | Species |
|---|---|---|---|---|
| Phosphofructokinase (PFKL) | 30-17/12108-1101; ProSci | 1:800/1:5000 | 64 kDa | Rabbit polyclonal |
| Pyruvate dehydrogenase (PDH) complex | MSP02/D0959 (ab110416); MitoSciences | 1:500/1:5000 | 55 kDa (72, 55, and 42 kDa1) | Mouse monclonal |
| Isocitrate dehydrogenase (IDH2) | 26-297/12108-1101; ProSci | 1:500/1:5000 | 47 kDa | Rabbit polyclonal |
| Alpha ketoglutarate dehydrogenase (OGDH) | MS753/D0657; MitoSciences | 1:4000/1:5000 | 49 kDa | Mouse monoclonal |
| Succinate dehydrogenase complex | MS202/HCESHC (ab110410); MitoSciences | 1:500/1:5000 | 53 kDa (70, 53, and 30 kDa2) | Mouse monoclonal |
| Oxidative phosphorylation (OXPHOSO complexes I–V) | MS604/D1848 (ab110413); MitoSciences | 1:500/1:5000 | 53 kDa (47, 39, 30, 20, and 53 kDa3) | Mouse monoclonal |
| Ca++/calmodulin-dependent protein kinase beta (CaMMKβ L-19) | sc-9629/H0411; Santa Cruz Biotechnol. | 1:500/1:5000 | 66 kDa | Goat polyclonal |
| Protein phosphatase 2 (PP2A-C α/β L-19) | sc-81601/J1410; Santa Cruz Biotechnol. | 1:500/1:5000 | 36 kDa | Mouse monoclonal |
| Phosphorylated AMP activated protein kinase (pAMPK) | sc- 33524-R/E0207; Santa Cruz Biotechnol. | 1:1000/1:5000 | 63 kDa | Rabbit polyclonal |
| Acetyl CoA carboxylase (ACC) | 3662S/4; Cell Signaling | 1:500/1:5000 | 280 kDa | Rabbit polyclonal |
| Phosphorylated acetyl CoA carboxylase (S79) (pACC) | 3661S/8; Cell Signaling | 1:500/1:5000 | 280 kDa | Rabbit polyclonal |
| Fatty acid synthase (C2065) (FAS) | 3180S/2; Cell Signalling | 1:1000/1:5000 | 273 kDa | Rabbit polyclonal |
| AMPKα1/2 | sc-25792; Santa Cruz Biotechnol. | 1:1000; 1:5000 | 63 kDa | Rabbit polyclonal |
| PhosphoAMPKα1/2 | sc-33524; Santa Cruz Biotechnol. | 1:1000/1:5000 | 60 kDa | Rabbit polyclonal |
| Fos | sc-8047; Santa Cruz Biotechnol. | 1:1000; 1:5000 | 62 kDa | Mouse polyclonal |
PDH-E2 (72 kDa); PDH-E2/E3bp (55 kDa); PDH-E1-alpha (42 kDa).
C-V-alpha (F1-alpha; 53 kDa); C-II-30 (SDHB; 30 kDa); C-II-70 (SDHA; 70 kDa).
ATP synthase (Complex V) subunit alpha (CV-alpha; 53 kDa); Q-cytochrome c oxidoreductase (Complex III) subunit Core 2 (CIII-core 2; 47 kDa); Cytochrome c oxidase (Complex IV) subunit I (CIV-I; 39 kDa); Succinate Dehydrogenase (Complex II) subunit 30 kDa (CII-30; 30 kDa); NADH-coenzyme Q oxidoreductase (Complex I) subunit NDUFB8 (CI-20; 20 kDa).
Analysis of A2 Nerve Cell ERα and ERβ mRNA and Protein Expression
Single A2 neurons from V- and I-injected OVX + E rats (n=10–12 per group; 2–3 cells per animal) were analyzed by scqPCR [Briski et al., 2009b]. Single cell RNA was evaluated in a BioRad Experion electrophoresis system and amplified with TargetAmp 2-Round Aminoallyl-aRNA Amplification Kits (Epicentre Biotechnol.). Aminoallyl-aRNA was reverse-transcribed to cDNA with Sensiscript RT Kit reagents (Qiagen, Inc., Valencia, CA). ERα and ERβ forward and reverse primers were designed using Beacon Designer-5 software (Premier Biosoft Intl., Palo Alto, CA): [ERα (NM_012689): Forward: 5′-AAGCACAAAGCGTAGAG--3′; Reverse: 5′-GGTTCAGCATCCAATAAGG--3′; [ERβ (NM_012754): Forward: 5′-AAAGCCAAGA-GAAACGGTGGGCAT--3′; Reverse: 5′-GCCAATCATGTGCACCAGTTCCT--3′], and obtained from Genemed Synthesis, Inc. (San Francisco, CA). PCR reactions were performed in a BIO-RAD iQ™5 iCycler system, as described [Briski et al., 2010]: 1) 3 min initial denaturation at 95° C; 2) 40 × 1 min cycles (30 sec at 95° C followed by 30 sec at 50°C [ERβ] or 30 sec at 58°C [ERα]). GAPDH was measured for normalization of mRNA expression [Forward: 5′-ACAGCCGCATCTTCTTGTGC-3′; Reverse: 5′-GCCTACCCCATTTGATGTT-3′]. Data were normalized by the 2ΔΔCt method. A2 ERα and -β proteins were analyzed by Western blot. Lysates of n=50 TH-ir neurons from V- or I-injected E and O rats (n=12–13/rat) were probed with rabbit polyclonal ER-α (MC-20) (sc-542; 1:5,000; Santa Cruz Biotechnol.) or ER-β (y-19) (sc-6821; 1: 5,000; Santa Cruz Biotechnol.) primary antisera. Each immunoblot analysis was performed on triplicate lysate pools.
Blood analyte measurements
Blood glucose levels were measured with an AccuCheck Advantage glucometer (Roche diagnostics, Indianapolis, IN) [Kale et al., 2006]. Plasma estradiol levels were determined by radioimmunoassy, as described [Briski et al., 2001].
Statistics
Mean blood glucose, mRNA, and protein O.D. measures were evaluated by one-way ANOVA and Student-Newman-Keuls test, with differences of p<0.05 considered significant.
Results
Blood glucose levels in E- and O-implanted OVX rats were significantly reduced by I [E/V: 119 ± 2.0 mg/dL versus E/I: 53.5 ± 6.4 mg/dL; p<0.05] [O/V: 127.5 ± 1.5 mg/dL versus O/I: 60.3 ± 4.1 mg/dL; p<0.05]. Glucose values were equivalent in E/V versus O/V and in E/I versus O/I. Circulating E concentrations were 21.6 ± 0.2 and 21.9 ± 0.3 pg/mL in E/V and E/I groups, respectively, but undetectable in O/V and O/I animals. Figure 1.A depicts effects of insulin-induced hypoglycemia (IIH) on expression of the rate-limiting glycolytic enzyme, phosphofructokinase (PFLK), in A2 neurons from E and O rats. As indicated by normalized O.D. values for PFLK (bar graph at top), basal enzyme levels were elevated in the presence of estradiol. IIH augmented PFLK levels relative to baseline in E [E/I versus E/V], but not O. Figure 1.B illustrates effects of estrogen on pyruvate dehydogenase (PDH) complex subunit protein levels in cDVC tissue and A2 neuron samples. Figure 1.B.1 depicts representative immunoblots of PDH-E2 (72 kDa), PDH-E2/E3bp (55 kDa), PDH-E1-alpha (42 kDa), and α-tubulin in cDVC lysates. Normalized O.D. values in Figures 1.B.2, 1.B.3 and 1.B.4 denote up-regulation of these PDH subunits in the cDVC of E/V versus O/V rats. IIH did not alter expression of these subunit proteins in E or O. In contrast to the cDVC, only the 55 kDa PDH-E2/E3bp subunit was detectable in A2 cell pools. Data in Figure 1.C signify that in these cells, baseline levels of this subunit protein were increased in E/V versus O/V, but were unchanged by hypoglycemia in E or O.
Figure 1. Effects of Insulin-Induced Hypoglycemia (IIH) on A2 Nerve Cell Phosphofructokinase (PFLK), Caudal Dorsal Vagal Complex (cDVC) and A2 Cell Pyruvate Dehydrogenase (PDH) Complex Subunit Protein, and A2 Nerve Cell Isocitrate dehydrogenase (IDH2) and Alpha Ketoglutarate Dehydrogenase (OGDH) Enzyme Expression in Estrogen (E)- and Oil (O)-Implanted Ovariectomized Female Rats.

A2 neurons were harvested from E and O rats 2 hr after sc injection of neutral protamine Hagedorn insulin (I; 12.5 U/kg bw) or vehicle (V). Cells were identified by quick tyrosine hydroxylase-immunolabeling of 10 μm-thick frozen sections of the caudal dorsal vagal complex prior to single-cell micro-dissection. Lysates of n=50 A2 cells/treatment group (n=12–13 neurons/rat) were analyzed by Western blotting for the rate-limiting glycolytic enzyme, PFLK; blots were performed in triplicate. Pyruvate dehydrogenase (PDH)-E2 (72 kDa), PDH-E2/E3bp (55 kDa), and PDH-E1-alpha (42 kDa) subunits were evaluated in both cDVC tissue and A2 cell pools (n=50 neurons; 12–13 cells/rat). The cDVC was bilaterally removed via the Palkovits needle punch method from 200 μm-thick frozen hindbrain sections cut between −14.36 to −14.96 mm relative to bregma; tissue was pooled for each treatment group and triplicate aliquots were analyzed for PDH subunits. Protein band optical densities (O.D.) were quantified with AlphaImager HP V 5.0.1 software and expressed relative to the loading control, α-tubulin. Figure 1.A depicts, below, representative immunoblots of PFLK and α-tubulin, and above, mean normalized A2 cell PFLK O.D. values ± S.E.M. for O/V (white bar), O/I (striped white bar), E/V (grey bar), and E/I (striped grey bar) treatment groups. In Figure 1.B, the immunoblot (Figure 1.B.1) shows that PDH-E2, PDH-E2/E3bp, and PDH-E1-alpha subunits were detected in cDVC tissue from each treatment group. Bar graphs show mean normalized O.D. values ± S.E.M. (n=4/group) for cDVC 72 kDa (1.B.2; upper right), 55 kDa (1.B.3; lower left), and 42 kDa (1.B.4; lower right) PDH subunit expression. Figure 1.C illustrates A2 cell PDH-E2/E3pb subunit and α-tubulin immunoblots (below) and normalized O.D. values for each treatment group (above); 72 and 42 kDa PDH subunit proteins were not detectable in these samples. Figure 1.D and 1.E depict representative Western blots and normalized A2 nerve cell O.D. values ± S.E.M. for the rate-limiting tricarboxylic acid cycle enzymes IDH2 and OGDH. Data labeled with dissimilar letters show statistical difference. The results indicate that A2 PFLK expression was increased in E/V versus O/V, and further augmented in E during IIH. Each PDH subunit detectable in cDVC tissue and the 55 kDa protein in A2 cell samples was up-regulated by estrogen, but unaffected by IIH. A2 IDH2, but not OGDH protein expression was up-regulated by estrogen; IIH decreased the former, but elevated the latter protein profile in E, but not O rats.
Figures 1.D and 1.E illustrate respective effects of estrogen on Krebs cycle enzyme, e.g. isocitrate dehydrogenase (IDH2) and alpha ketoglutarate dehydrogenase (OGDH) responses to hypoglycemia in E and O rats. Basal A2 IDH2 and ODGH protein levels were significantly higher or similar, respectively, in E/V versus O/V. IIH suppressed IDH2, but elevated ODGH protein in E A2 cells, but did not alter either profile in O. Figure 2 depicts effects of hypoglycemia on succinate dehydrogenase (SDH) complex subunit protein expression in the cDVC and A2 neurons. Figure 2.A illustrates immunoblots of C-II-70 (SDHA; 70 kDa), C-V-alpha (F1-alpha; 53 kDa), C-II-30 (SDHB; 30 kDa), and α-tubulin in cDVC tissue lysates. O.D. values in Figures 2.B, 2.C, and 2.D denote elevated basal expression of each SDH protein in E versus O. IIH did not alter expression of these subunit proteins in E or O. Only the C-V-alpha subunit (53 kDa) of the SDH complex was measurable in A2 cell pools. Figure 2.E shows that this subunit protein was present at elevated levels in A2 cells from E versus O rats [E/V versus O/V], and was not modified in response to IIH in either group.
Figure 2. Effects of IIH on cDVC and A2 Nerve Cell Succinate Dehydrogenase (SDH) Enzyme Complex Protein Subunit Expression in E and O Rats.

The immunoblot at upper left (Figure 2.A) shows that C-V-alpha (53 kDa), C-II-30 (30 kDa), and C-II-70 (70 kDa) SDH subunits were detected in O/V, O/I, E/V, and E/I rats; blots were performed in triplicate. Bar graphs in Figures 2.B – 2.D depict mean normalized O.D. values ± S.E.M. (n=4/group) for cDVC 70 kDa, 53 kDa, and 30 kDa subunit proteins. The SDH 53 kDa, but not 70 or 30 kDa, subunit was detectable in A2 cell samples (n=50 A2 cells/treatment group; n=12–13 neurons per rat); Figure 2.E illustrates normalized protein O.D. values ± S.E.M. and representative 53 kDa subunit and α-tubulin immunoblots. Data labeled with dissimilar letters show statistical difference. The data show that SDH subunits detected in cDVC and A2 cell samples were up-regulated by estrogen; these profiles did not differ between O/V versus O/I or E/V versus E/I groups.
Figure 3 depicts effects of estrogen on respiratory chain complex I–V subunit expression in cDVC tissue and A2 cell samples. The immunoblot at upper left (Figure 3.A) shows that Complex V (CV) ATP synthase-subunit alpha (53 kDa), Complex III (CIII) subunit Core 2 (CIII-core 2; 47 kDa), Complex IV (CIV) subunit I (CIV-I; 39 kDa), Complex II (CII) subunit 30 kDa (CII-30; 30 kDa), and Complex I (CI) subunit NDUFB8, CI-20 (20 kDa) were each detected in cDVC tissue from O/V, O/I, E/V, and E/I rats. O.D. values for cDVC ATP synthase-subunit alpha (Figure 3.B), cDVC CIII-core (Figure 3.D), cDVC CIV-I (Figure 3.E), cDVC CII-30 (Figure 3.F), and cDVC CI-20 (Figure 3.G) indicate that all but the latter protein profile are up-regulated by estrogen, and that none was altered by IIH. Only ATP synthase-subunit alpha was measurable in A2 cell samples; data in Figure 3.C show that baseline protein levels were augmented in E/V versus O/V.
Figure 3. Effects of IIH on cDVC and A2 Nerve Cell Respiratory Chain Complex I–V Protein Subunit Expression in E and O Rats.

The immunoblot at upper left (Figure 3.A) shows that Complex V (CV) ATP synthase-subunit alpha (53 kDa), Complex III (CIII) subunit Core 2 (CIII-core 2; 47 kDa), Complex IV (CIV) subunit I (CIV-I; 39 kDa), Complex II (CII) subunit 30 kDa (CII-30; 30 kDa), and Complex I (CI) subunit NDUFB8, CI-20 (20 kDa) were each detected in cDVC tissue from O/V, O/I, E/V, and E/I rats. Blots were performed in triplicate. Mean O.D. values ± S.E.M. for cDVC Complex I–V protein subunit expression in O/V, O/I, E/V, and E/I rats are presented in Figures 3.B (ATP synthase-subunit alpha), 3.D (cDVC CIII-core), 3.E (cDVC CIV-I), 3.F (cDVC CII-30), and 3.G. (cDVC CI-20) (9.G). Only ATP synthase-subunit alpha was measurable in A2 cell samples (n=50 A2 cells/treatment group; n=12–13 neurons per rat); Figure 3.C depicts normalized protein O.D. values ± S.E.M. and representative immunoblot. Data labeled with dissimilar letters show statistical difference. cDVC and A2 respiratory chain complex subunit profiles were up-regulated by estrogen, but unchanged in response to IIH in E and O rats.
Figures 4.A and 4.B illustrate effects of IIH on corresponding AMPK kinase, CaMMKβ, and AMPK phosphatase, PP2A, expression in A2 neurons from E and O rats. Estrogen decreased CaMMKβ and increased PP2A levels in these cells. During hypoglycemia, A2 CaMMKβ protein was elevated in O, but unchanged in E, whereas PP2A levels were diminished in both O and E. Figures 4.C, 4.D, and 4.E depict effects of IIH on A2 AMPK, pAMPK, and Fos expression in E and O rats. IIH had no impact on A2 AMPK protein expression in E or O (Figure 4.C). Basal A2 phosphoAMPK (pAMPK) expression did not differ between O and E animals. IIH elevated pAMPK levels in these cells in O, but not E rats (Figure 4.D). Figure 4.E shows that A2 Fos protein expression is elevated in O/I versus O/V rats, but insensitive to IIH in E.
Figure 4. Effects of IIH on A2 Nerve Cell Ca++/calmodulin-dependent protein kinase beta (CaMMKβ), Protein Phosphatase 2 (PP2A), AMPK, PhosphoAMPK (pAMPK), and Fos Expression Expression in E and O Rats.

Figures 4.A and 4.B depict effects of I versus V injection on CaMMKβ and PP2A enzyme expression, respectively, in A2 neurons from E and O rats. Blots were performed in triplicate. Bar graphs in each figure depict mean normalized CaMMKβ or PP2A O.D. values ± S.E.M. for A2 cell lysates (n=50 A2 cells/treatment group; n=12–13 neurons per rat) from O/V, O/I, E/V, and E/I rats. Below, each figure depicts representative protein and α-tubulin immunoblots. Data labeled with dissimilar letters differ statistically. A2 CaMMKβ and PP2A levels were significantly lower or higher in E/V versus O/V, respectively. IIH elevated CaMMKβ expression in O, but not E rats, and inhibited PP2A profiles in both groups. Figures 4.C, 4.D, and 4.E depict mean normalized AMPK, pAMPK, and Fos O.D. values, respectively, for A2 cell lysates (n=50 A2 cells/treatment group; n=12–13 neurons per rat) from the treatment groups described above. Blots were performed in triplicate. Data labeled with dissimilar letters differ statistically. In both E and O rats, A2 AMPK expression was not modified from baseline following I treatment, but was relatively higher in O/I versus E/I. A2 pAMPK expression did not differ between E/V and O/V, but was augmented in O, but not E in response to hypoglycemia. A2 Fos protein levels were elevated in O/I versus O/V, but similar in E/I versus E/V.
A2 neurons express the key lipogenic enzymes, acetyl CoA carboxylase (ACC; Figure 5.A) and fatty acid synthase (FAS; Figure 5.B); both of which are down-regulated by estrogen [E/V versus O/V]. The inactive form of ACC, e.g. phosphoACC (pACC), was also expressed at higher levels in the absence of E. Data demonstrate that each protein profile is insensitive to IIH.
Figure 5. Effects of IIH on A2 Nerve Cell Acetyl CoA Carboxylase (ACC), phosphoACC (pACC), and Fatty Acid Synthase (FAS) Protein Expression in E and O Rats.
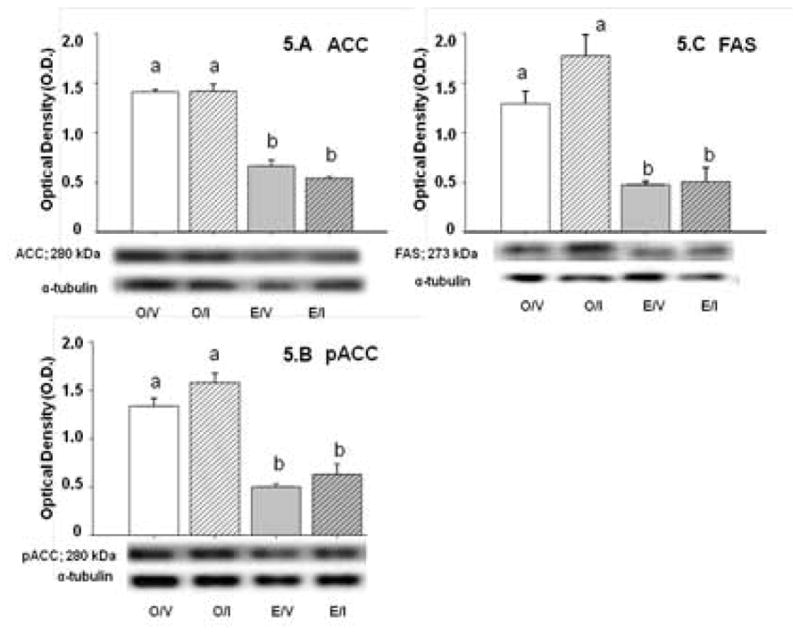
Figures 5.A, 5.B, and 5.C depict effects of I versus V on ACC, pACC, and FAS protein profiles, respectively, in A2 neurons harvested 2 hr after injection of I versus V into E and O rats. Bar graphs in each figure depict mean normalized ACC, pACC, or FAS O.D. values ± S.E.M. for A2 cell lysates (n=50 A2 cells/treatment group; n=12–13 neurons per rat) from O/V, O/I, E/V, and E/I rats; blots were performed in triplicate. Representative enzyme and α-tubulin protein immunoblots are shown below in each figure. Data labeled with dissimilar letters differ statistically. The data show that ACC, pACC, and FAS were expressed at higher levels in A2 cells obtained from O versus E animals, but that these profiles were refractory to IIH in both groups.
Figure 6.A shows that ERα and ERβ gene transcripts co-exist in A2 neurons harvested from OVX + E rats, and that both gene profiles were resistant to IIH. A2 nerve cell ERα (Figure 6.B) and ERβ (Figure 6.C) protein levels were insensitive to IIH in E- and O-implanted OVX rats.
Figure 6. Effects of IIH on ERα and ERβ gene and protein expression in A2 neurons.

Individual A2 nerve cells were laser-dissected from E-implanted OVX rats 2 hr after I or V injection, and analyzed by scqPCR for ERα and ERβ gene transcripts (Figure 6.A); bar graphs depict mean normalized values ± S.E.M. for 10–12 cells per group. Data show that both mRNAs were expressed in each neuron evaluated, and that mean levels of each transcript were unchanged by IIH. Figures 6.B and 6.C depict effects of IIH on corresponding ERα and ERβ protein expression in pooled A2 cell lysates from OVX + E and OVX + O animals. Graphs show mean normalized O.D. values ± S.E.M. for n=50 cells per treatment group; representative receptor and α-tubulin protein immunoblots are shown below in each figure. Blots were performed in triplicate. In both E and O rats, neither receptor protein profile was significantly changed in response to I.
Discussion
This work establishes the utility of our combinatory laser-microdissection/Western blot approach [Cherian and Briski, 2011; 2012] for quantitative assessment of metabolic pathway, respiratory chain, upstream AMPK kinase/phosphatase, and lipogenic enzyme expression in a pure metabolo-sensory nerve cell population during eu- versus hypoglycemia. Estradiol elevated basal expression of rate-limiting glycolytic (PFKL) and Krebs cycle (IDH2) enzymes and PDH, Complex II, and ATP synthase subunits in DVC A2 neurons. During hypoglycemia, these cells exhibit further augmentation of PFKL and up-regulation of a second key TCA enzyme, ODGH, in the presence of estradiol. Estrogen-dependent resistance of A2 pAMPK profiles to IIH implies hormonal promotion of cellular metabolic stability during this energetic stress. AMPK refractoriness to hypoglycemia, despite likely increases in energy production and lack of change in upstream kinase expression, may reflect estrogenic stabilization of generated versus expended energy ratio, despite systemic glucose deficit. Alternatively, hypoglycemic up-regulation of A2 pAMPK expression in O rats may indicate, in part, augmented CaMMKβ expression and/or imbalance of energy yield relative to use. Current results also indicate that estradiol may suppress A2 de novo fatty acid synthesis during glucostasis, and prevent hypoglycemia-associated reductions in the fatty acid intermediate, malonyl-CoA.
Estradiol increased baseline profiles of key glycolytic and TCA cycle enzymes and PDH (55 kDa), SHD (53 kDa), and ATP synthase protein subunits in A2 neurons, implying that this hormone may stimulate energy production during homeostasis owing to augmented metabolic activity. Our presumption of corresponding augmentation of net ATP yield due to estrogen awaits emergence of analytical methods of requisite sensitivity for reliable ATP quantification in a sample size as small as that used here. It is noted that up-regulated A2 enzyme protein levels is not an automatic indicator of increased enzyme activity; however, prior evidence for correlated increases in metabolic enzyme expression and activity due to estradiol treatment supports the plausibility of that outcome [Irwin et al., 2008]. At present, an analytical means for measurement of relevant enzyme activities in homogenous A2 nerve cell pools is not available. These results agree with findings of estrogen stimulation of whole-brain mitochondrial PDH and ATP-synthase proteins [Nilsen et al., 2007]. We found that A2 neurons express the AMPK kinase CaMMKβ, consistent with reports of neural tissue CaMMK expression [Anderson et al., 1998] and the protein phosphatase PP2A, but the alternative kinase, LKB1, was not detected. While estradiol respectively decreased and increased A2 CaMMKβ and PP2A profiles, pAMPK protein was equivalent in E/V versus O/V. On one hand, net A2 ATP levels during energy homeostasis may be equivalent in O/V versus E/V, despite augmented energy production due to matched increase in energy expenditure. If indeed estradiol stimulates baseline energy yield, it would be informative to learn how that energy is partitioned amongst cell functions, including neurotransmission. Alternatively, estrogenic inhibition of A2 AMPK activity may be offset by its regulation of 1) as-yet-unidentified upstream kinases that promote AMPK activation; 2) efficiency of AMPK as a substrate for kinase/protein phosphatase action; 3) AMPK complex stability; and/or 4) allosteric activation of pAMPK [Viollet et al., 2010]. The obvious need to assess AMPK enzyme activity in A2 neurons from E versus O rats is impeded by insufficient sensitivity of available techniques.
Hypoglycemia amplified A2 PFKL and ODGH protein levels in E but not O, suggesting that compensatory glycolytic and TCA pathway up-regulation may be estrogen-dependnet. We previously reported that these cells increase expression of transporters for the oxidizable fuel lactate in E/I rats [Koshy Cherian and Briski, 2012]. Hypoglycemia increased A2 CaMMKβ expression in O but not E, while reducing PP2A levels in both groups. As CaMMK-mediated phosphorylation of AMPK is initiated by elevated Ca++, not increased AMP [Hurley et al., 2005], estradiol may prevent Ca++ - induced CaMMKβ up-regulation during hypoglycemia; it remains to be determined if hormone action involves inhibition of Ca++ release per se or blockade of Ca++ stimulation of CaMMKβ. Estradiol preserved A2 cell AMPK expression and activation during hypoglycemia. This hormonal stabilization of sensor activity may involve CaMMKβ inhibition (discussed above), maintenance of net ATP, and/or anti-oxidant effects [Razmara et al., 2007]. Fos, the protein product of the proto-oncogene, cfos, is a reliable indicator of increased nerve cell transcriptional activation [Morgan and Curran, 1991]. Parallel augmentation of A2 Fos expression and AMPK activity in O/I rats implies a causal relationship between genomic activation sensor activity state; the identity of genes that exhibit E-dependent transcriptional reactivity to hypoglycemia remain unknown. Ongoing effort by our group seeks to determine if and how estrogen-dependent A2 AMPK refractoriness to hypoglycemia may impact metabolic signaling by these cells, including effects of sensor activation on direction, amplitude, and/or duration of hypoglycemia-associated patterns of A2 noradrenergic signaling. We speculate that estradiol enhancement of energy yield may increase strength and/or interval of adjustments in synaptic firing relative to homeostatic baseline, or alternatively, may inhibit those parameters of this sensory signal as a consequence of positive cellular energetic adaptation to hypoglycemia.
Results show that A2 neurons express the key lipogenic enzymes ACC and FAS in an estrogen-dependent manner, suggesting that estradiol can inhibit A2 de novo fatty acid synthesis during eu- and hypoglycemia. Hypothalamic malonyl CoA is prominently involved in neural regulation of energy balance, but the question of whether A2 malonyl CoA fulfills a similar role remains. A2 ACC, FAS, and pACC levels were resistant to hypoglycemia in both E and O, inferring that fatty acid synthesis and correlated malonyl CoA yield may be impervious to this metabolic stress. pAMPK inactivates ACC via phosphorylation [Hardie et al., 1999]. O/I rats showed no change in pACC levels despite elevated A2 pAMPK, suggesting that AMPK control of pACC may be offset by other factors.
The present studies confirm A2 neurons as direct substrates for estradiol action that involves, in part, classical nuclear receptor mechanisms. Earlier in situ hybridization studies found that ERα and ERβ gene transcripts occur in approximately 59% and 14%, respectively, of caudal DVC TH neurons [Curran-Rauhut and Peterson, 2003]. Here, application of qPCR to individual A2 neurons demonstrates co-expression of these mRNAs, signifying potential estrogenic regulation of A2 cells via dual receptor-mediated mechanisms. Disparities between that work and ours likely reflect differences in quantitative methods for gene expression, including sensitivity threshold relative to mRNA yield. It remains to be determined if nuclear receptors regulate A2 cells via genomic and/or cytoplasmic signaling mechanisms.
The female lifespan includes transition between different reproductive states, e.g. juvenile quiescence, fecundity, and senescence, typified by unique patterns of ovarian estrogen secretion. Current results support our long-term goal to understand how dissimilar physiological patterns of estradiol output, including variations occurring over estrous cycle and pregnancy, may impact the glucoregulatory circuitry, including metabolo-sensory A2 neurons. Estradiol, when stabilized near basal estrous cycle levels, prevents desensitization of this neural network to chronic hypoglycemia that is characteristic of testes-intact male and non-estradiol - treated OVX female rats [Paranjape and Briski, 2005; Nedungadi et al., 2006]. It will be informative to know if concentration-dependent effects of estrogen on A2 energy metabolism and/or AMPK activity contribute to this beneficial outcome. Since estradiol is present in the male rat circulation and is synthesized locally in the brain, dissimilar A2 reactivity to hypoglycemia in male versus estradiol-treated OVX females may reflect, in part, differences in circulating hormone levels, including absence of circadian, ultradian, and stress-mediated fluctuations in the latter, and/or receptor levels and combinations. The hormone replacement strategy used here did not include the second ovarian steroid, progesterone. Since progesterone can module effects of estradiol on other physiological parameters, we cannot discount the possibility that estradiol effects on A2 cells may vary between the model employed here and ovary-intact animals.
As summarized in Figure 7, estrous cycle-like estrogen levels may preserve metabolic balance in DVC metabolo-sensory A2 neurons during hypoglycemia via up-regulation of expression of energy pathway enyzmes and inhibition of upstream AMPK kinase expression, thereby fulfilling a neuroprotective role against this bio-energetic insult. Current results advance the possibility that molecular substrates of estrogen action may be suitable targets for therapeutic alleviation or prevention of dysfunction or injury caused by hypoglycemia-associated nutrient deprivation.
Figure 7. Illustrative summary of E effects on A2 neuron/cDVC tissue energy metabolic pathway enzyme expression during normo- vs. insulin-induced hypoglycemia.

Effects of E alone or in combination with IIH are presented in schematic diagrams of glycolytic (7.A), Krebs cycle (7.B), oxidative phosphorylation (7.C), and malonyl Co-A (7.D) pathways, where rate-limiting pathway enzymes investigated are depicted in dark grey boxes. E stimulates (+) PFKL and PDH expression in A2 neurons, and moreover, allows further increase (++) of the former profile during IIH (Fig. 7.A); similarly, whole cDVC tissue exhibited up-regulated PDH subunit proteins in OVX+E, with or without IIH. These results support the notion that E may promote provision of glycolysis-derived acetyl Co-A for mitochondrial oxidation. As shown in Panel 7.B, Krebs cycle rate-limiting enzymes IDH2 and ODGH were enhanced in A2 neurons by E alone or E + IIH, respectively, while Complex II protein was stimulated under both conditions; collectively, these data imply estrogenic stimulation of cycle products. These findings are corroborated by evidence for Complex II subunit profile up-regulation in cDVC tissue. The respiratory chain (Fig. 7.C) utilizes electrons shuttled from the Krebs cycle by NADH and FADH2 to generate ATP. Our results show that A2 (ATP synthase subunit) and cDVC tissue (complexes II – IV) proteins were stimulated by E alone or in combination with IIH. The malonyl CoA pathway (Fig. 7.D) functions in fatty acid synthesis. E inhibits (−) FAS and ACC enzyme profiles and inhibits or stimulates upstream kinase (CaMMKβ) and phosphatase proteins, respectively, that increase or decrease activity of the energy sensor AMPK, implying estrogen inhibition of fatty acid production and stabilization of cell energy balance under normo- and hypoglycemic conditions. Abbreviations: PFKL, phosphofrucktokinase; PDH, pyruvate dehydrogenase; IDH2, isocitrate dehydrogenase; ODGH, alpha-ketoglutarate dehydrogenase; Complex II, succinate dehydrogenase; pAMPK, phosphorylated adenosine monophosphate protein kinase; PP2A, protein phosphatase; CaMMKβ, Ca2+/calmodulin-dependent protein kinase; ACC, acetyl CoA carboxylase; FAS, fatty acid synthase.
Acknowledgments
This research was supported by National Institutes of Health grant DK 085122
References
- Anderson KA, Means RL, Huang QH, Kemp BE, Goldstein EG, Selbert MA, Edelman AM, Fremeau RT, Means AR. Components of a calmodulin-dependent protein kinase cascade. Molecular cloning, functional characterization and cellular localization of Ca2+/calmodulin-dependent protein kinase kinase β. J Biol Chem. 1998;273:31880–31889. doi: 10.1074/jbc.273.48.31880. [DOI] [PubMed] [Google Scholar]
- Balfour RH, Hansen AMK, Trapp S. Neuronal responses to transient hypoglycaemia in the dorsal vagal complex of the rat brainstem. J Physiol. 2006;570:469–484. doi: 10.1113/jphysiol.2005.098822. [DOI] [PMC free article] [PubMed] [Google Scholar]
- Briski KP, Koshy Cherian A, Genabai NK, Vavaiya KV. (In situ coexpression of glucose and monocarboxylate transporter mRNAs in metabolic-sensitive dorsal vagal complex catecholaminergic neurons: transcriptional reactivity to insulin-induced hypoglycemia (IIH) and caudal hindbrain glucose or lactate repletion during IIH. Neuroscience. 2009;164:1152–1160. doi: 10.1016/j.neuroscience.2009.08.074. [DOI] [PubMed] [Google Scholar]
- Briski KP, Marshall ES, Sylvester PW. Effects of estradiol on glucoprivic transactivation of catecholaminergic neurons in the female rat caudal brainstem. Neuroendocrinology. 2001;73:369–377. doi: 10.1159/000054655. [DOI] [PubMed] [Google Scholar]
- Briski KP, Nedungadi TP, Koshy Cherian A. Effects of hypoglycaemia on neurotransmitter and receptor gene expression in arcuate neuropeptide Y/agouti-related peptide neurones. J Neuroendocrinol. 2010;22:599–607. doi: 10.1111/j.1365-2826.2010.01992.x. [DOI] [PubMed] [Google Scholar]
- Butcher RL, Collins WE, Fugo NW. Plasma concentrations of LH, FSH, progesterone, and estradiol-17beta throughout the 4-day estrous cycle of the rat. Endocrinology. 1974;94:1704–1708. doi: 10.1210/endo-94-6-1704. [DOI] [PubMed] [Google Scholar]
- Chen JQ, Brown TR, Russo J. Regulation of energy metabolism pathways by estrogens and estrogenic chemicals and potential implications in obesity associated with increased exposure to endocrine disruptors. Biochim Biophys Acta. 2009;1793:1128–1143. doi: 10.1016/j.bbamcr.2009.03.009. [DOI] [PMC free article] [PubMed] [Google Scholar]
- Cherian A, Briski KP. Quantitative RT PCR and immunoblot analyses reveal acclimated A2 noradrenergic neuron substrate fuel transporter, glucokinase, phosphoAMPK, and dopamine-beta-hydroxylase responses to hypoglycemia. J Neurosci Res. 2011;89:1114–1124. doi: 10.1002/jnr.22632. [DOI] [PubMed] [Google Scholar]
- Cherian A, Briski KP. Estradiol regulates phosphoAMPK, glucokinase, substrate transporter, and dopamine-beta-hydroxylase adaptation to repeated insulin-induced hypoglycemia in female rat A2 noradrenergic neurons. J Neurosci Res. 2012;90:1347–1358. doi: 10.1002/jnr.23032. [DOI] [PubMed] [Google Scholar]
- Curran-Rauhut MA, Peterson SL. Oestradiol-dependent and –independent modulation of tyrosine hydroxylase mRNA levels in subpopulations of A1 and A2 neurones with oestrogen receptor (ER)α and ERβ gene expression. J Neuroendocrinol. 2003;15:296–303. doi: 10.1046/j.1365-2826.2003.01011.x. [DOI] [PubMed] [Google Scholar]
- Elrod JW, Wong R, Mishra S, Vagnozzi RJ, Sakthievel B, Goonasekera SA, Karch J, Gabel S, Farber J, Force T, Brown JH, Murphy E, Molkentin JD. Yclophilin D controls mitochondrial pore-dependent Ca(2+) exchange, metabolic flexibility, and propensity for heart failure in mice. J Clin Invest. 2010;120:3680–3687. doi: 10.1172/JCI43171. [DOI] [PMC free article] [PubMed] [Google Scholar]
- Gao S, Lane MD. Effect of the anorectic fatty acid synthase inhibitor C75 on neuronal activity in the hypothalamus and brainstem. Proc Natl Acad Sci. 2003;100:5628–5633. doi: 10.1073/pnas.1031698100. [DOI] [PMC free article] [PubMed] [Google Scholar]
- Goodman RL. A quantitative analysis of the physiological role of estradiol and progesterone in the control of tonic and surge secretion of luteinizing hormone in the rat. Endocrinology. 1978;102:142–150. doi: 10.1210/endo-102-1-142. [DOI] [PubMed] [Google Scholar]
- Gujar AD, Ibrahim BA, Tamrakar P, Koshy Cherian A, Briski KP. Hindbrain lactostasis regulates hindbrain and hypothalamic AMPK activity and hypothalamic metabolic neurotransmitter mRNA and protein responses to hypoglycemia. Amer J Physiol Regul Integ Comp Physiol. 2014 doi: 10.1152/ajpregu.00151.2013. in press. [DOI] [PMC free article] [PubMed] [Google Scholar]
- Haces ML, Hernandez-Fonseca K, Medina-Campos ON, Montiel T, Pedraza-Chaverri J, Massieu L. Antioxidant capacity contributes to protection of ketone bodies against oxidative damage induced during hypoglycemic conditions. Exper Neurol. 2008;211:85–90. doi: 10.1016/j.expneurol.2007.12.029. [DOI] [PubMed] [Google Scholar]
- Hardie DG. Minireview: The AMP-activated protein kinase cascade: the key sensor of cellular energy status. Endocrinology. 2003;144:5179–5183. doi: 10.1210/en.2003-0982. [DOI] [PubMed] [Google Scholar]
- Hardie DG, Salt IP, Hawley SA, Davies S. AMP activated protein kinase: an ultrasensitive system for monitoring cellular energy charge. Biochem J. 1999;338:717–722. [PMC free article] [PubMed] [Google Scholar]
- Hawley SA, Boudeau J, Reid JL, Mustard KJ, Udd L, Makela TP, Alessi DR, Hardie DG. Complexes between the LKB1 tumor suppressor, STRADα/β and MO25α/β areupstream kinases in the AMP-activated protein kinase cascade. J Biol. 2003;2:28–36. doi: 10.1186/1475-4924-2-28. [DOI] [PMC free article] [PubMed] [Google Scholar]
- Hayes MR, Skibicka KP, Bence KK, Grill HJ. Dorsal hindbrain 5′-adenosine monophosphate-activated protein kinase as an intracellular mediator of energy balance. Endocrinology. 2009;150:2175–2182. doi: 10.1210/en.2008-1319. [DOI] [PMC free article] [PubMed] [Google Scholar]
- Hu Z, Cha SH, Chohnan S, Lane MD. Hypothalamic malonyl-CoA as a mediator of feeding behavior. Proc Natl Acad Sci. 2003;100:12624–12629. doi: 10.1073/pnas.1834402100. [DOI] [PMC free article] [PubMed] [Google Scholar]
- Hurley RL, Anderson KA, Franzone JM, Kemp BE, Means AR, Witters LA. The Ca2+/calmoldulin-dependent protein kinase kinases are AMP-activated protein kinase kinases. J Biol Chem. 2005;280:29060–29066. doi: 10.1074/jbc.M503824200. [DOI] [PubMed] [Google Scholar]
- Ibrahim BA, Tamrakar P, Gujar AD, Koshy Cherian A, Briski KP. Caudal fourth ventricular AICAR regulates glucose and counter regulatory hormone profiles, dorsal vagal complex metabolo-sensory neuron function, and hypothalamic Fos expression. J Neurosci Res. 2013;91:1226–1238. doi: 10.1002/jnr.23230. [DOI] [PubMed] [Google Scholar]
- Irwin RW, Yao J, Hamilton RT, Cadenas E, Brinton RD, Nilsen J. Progesterone and estrogen regulate oxidative metabolism in brain mitochondria. Endocrinology. 2008;149:3167–3175. doi: 10.1210/en.2007-1227. [DOI] [PMC free article] [PubMed] [Google Scholar]
- Kahn BB, Alquier T, Carling D, Hardie DG. AMP-activated protein kinase: ancient energy gauge provides clues to modern understanding of metabolism. Cell Metab. 2005;1:15–25. doi: 10.1016/j.cmet.2004.12.003. [DOI] [PubMed] [Google Scholar]
- Kale AY, Paranjape SA, Briski KP. Intracerebroventricular administration of the nonsteroidal glucocorticoid receptor antagonist, CP472555, prevents exacerbation of hypoglycemia during repeated insulin administration. Neuroscience. 2006;140:555–565. doi: 10.1016/j.neuroscience.2006.02.041. [DOI] [PubMed] [Google Scholar]
- Kostanyan A, Nazaryan K. Rat brain glycolysis regulation by estradiol-17 beta. Biochim Biophys Acta. 1992;1133:301-3-6. doi: 10.1016/0167-4889(92)90051-c. [DOI] [PubMed] [Google Scholar]
- Lam TK, Schwartz GJ, Rossetti L. Hypothalamic sensing of fatty acids. Nat Neurosci. 2005;8:579–584. doi: 10.1038/nn1456. [DOI] [PubMed] [Google Scholar]
- Li AJ, Wang Q, Ritter S. Differential responsiveness of dopamine-beta-hydroxylase gene expression to glucoprivation in different catecholamine cell groups. Endocrinology. 2006;147:3428–3434. doi: 10.1210/en.2006-0235. [DOI] [PubMed] [Google Scholar]
- Lopez M, Lelliott CJ, Tovar S, Kimber W, Gallego R, Virtue S, Blount M, Vazquez MJ, Finer N, Powles TJ, O’Rahilly S, Saha AK, Dieguez C, Vidal-Puig AJ. Tamoxifen-induced anorexia Is associated with fatty acid synthase inhibition in the ventromedial nucleus of the hypothalamus and accumulation of malonyl-CoA. Diabetes. 2006;55:1327–1336. doi: 10.2337/db05-1356. [DOI] [PubMed] [Google Scholar]
- Magistretti PJ, Sorg O, Martin JL, Pellerin L. Neurotransmitters regulate energy metabolism in astrocytes: implications for the metabolic trafficking between neural cells. Dev Neurosci. 1993;15:306–312. doi: 10.1159/000111349. [DOI] [PubMed] [Google Scholar]
- Malmgren S, Nicholls DG, Taneera J, Bacos K, Koeck T, Tamaddon A, Wibom R, Groop L, Ling C, Mulder H, Sharoyko VV. Tight coupling between glucose and mitochondrial metabolism in clonal beta-cells is required for robust insulin secretion. J Biol Chem. 2009;284:32395–32404. doi: 10.1074/jbc.M109.026708. [DOI] [PMC free article] [PubMed] [Google Scholar]
- Mizuno Y, Oomura Y. Glucose responding neurons in the nucleus tractus solitarius of the rat: in vitro study. Brain Res. 1984;307:109–116. doi: 10.1016/0006-8993(84)90466-9. [DOI] [PubMed] [Google Scholar]
- Morgan JI, Curran T. Stimulus-transcription coupling in the nervous system: involvement of the inducible proto-oncogenes fos and jun. Annu Rev Neurosci. 1991;14:421–451. doi: 10.1146/annurev.ne.14.030191.002225. [DOI] [PubMed] [Google Scholar]
- Nedungadi TP, Briski KP. Site-specific effects of intracranial estradiol administration on recurrent insulin-induced hypoglycemia in ovariectomized female rats. Neuroendocrinology. 2012;96:311–323. doi: 10.1159/000338407. [DOI] [PubMed] [Google Scholar]
- Nedungadi TP, Goleman WL, Paranjape SA, Kale AY, Briski KP. Effects of estradiol on glycemic and CNS neuronal activational responses to recurrent insulin-induced hypoglycemia in the ovariectomized female rat. Neuroendocrinology. 2006;84:235–243. doi: 10.1159/000098039. [DOI] [PubMed] [Google Scholar]
- Nilsen J, Brinton RD. Mitochondria as therapeutic targets of estrogen action in the central nervous system. Curr Drug Targets – CNS & Neurol Disorders. 2004;3:297–313. doi: 10.2174/1568007043337193. [DOI] [PubMed] [Google Scholar]
- Nilsen J, Irwin RW, Gallaher TK, Brinton RD. Estadiol in vivo regulation of brain mitochondrial proteome. J Neurosci. 2007;27:14069–14077. doi: 10.1523/JNEUROSCI.4391-07.2007. [DOI] [PMC free article] [PubMed] [Google Scholar]
- Oomura Y, Yoshimatsu H. Neural network of glucose monitoring system. J Auton Nerv Syst. 1984;10:359–372. doi: 10.1016/0165-1838(84)90033-x. [DOI] [PubMed] [Google Scholar]
- Paranjape SA, Briski KP. Recurrent insulin-induced hypoglycemia causes site-specific patterns of habituation or amplification of CNS neuronal genomic activation. Neuroscience. 2005;130:957–970. doi: 10.1016/j.neuroscience.2004.09.030. [DOI] [PubMed] [Google Scholar]
- Patel NJ, Chen MJ, Russo-Neustadt AA. Norepinephrine and nitric oxide promote cell survival signaling in hippocampal neurons. Eur J Pharmacol. 2010;633:1–9. doi: 10.1016/j.ejphar.2010.01.012. [DOI] [PubMed] [Google Scholar]
- Patil GD, Briski KP. Lactate is a critical ‘sensed’ variable in caudal hindbrain monitoring of CNS metabolic stasis. Amer J Physiol. 2005a;289:R1777–R1786. doi: 10.1152/ajpregu.00177.2004. [DOI] [PubMed] [Google Scholar]
- Patil GD, Briski KP. Transcriptional activation of nucleus tractus solitarius/area postrema catecholaminergic neurons by pharmacological inhibition of caudal hindbrain mono-carboxylate transporter function. Neuroendocrinology. 2005b;81:96–102. doi: 10.1159/000085522. [DOI] [PubMed] [Google Scholar]
- Patil GD, Briski KP. Induction of Fos immunoreactivity labeling in forebrain metabolic loci by caudal fourth ventricular administration of the monocarboxyate transporter inhibitor, α-cyano-4-hydroxycinnamic acid. Neuroendocrinology. 2005c;82:49–57. doi: 10.1159/000090785. [DOI] [PubMed] [Google Scholar]
- Razmara A, Duckles SP, Krause DN, Procaccio V. Estrogen suppresses brain mitochondrial oxidative stress in female and male rats. Brain Res. 2007;1176:71–81. doi: 10.1016/j.brainres.2007.08.036. [DOI] [PMC free article] [PubMed] [Google Scholar]
- Rinaman L. Ascending projections from the caudal visceral nucleus of the solitary tract to brain regions involved in food intake and energy expenditure. Brain Res. 2010;1350:18–34. doi: 10.1016/j.brainres.2010.03.059. [DOI] [PMC free article] [PubMed] [Google Scholar]
- Ronnett GV, Ramamurthy S, Kleman AM, Landree LE, Aja S. AMPK in the brain: its role in energy balance and neuroprotection. J Neurochem. 2009;109:17–23. doi: 10.1111/j.1471-4159.2009.05916.x. [DOI] [PMC free article] [PubMed] [Google Scholar]
- Troadec JD, Marien M, Darios F, Hartmann A, Ruberg M, Colpaert F, Michel PP. Noradrenaline provides long-term protection to dopaminergic neurons by reducing oxidative stress. J Neurochem. 2001;79:200–210. doi: 10.1046/j.1471-4159.2001.00556.x. [DOI] [PubMed] [Google Scholar]
- Viollet B, Horman S, Leclerc J, Lantier L, Foretz M, Billaud M, Giri G, Andreelli F. AMPK inhibition in health and disease. Crit Rev Biochem Mol Biol. 2010;45:276–295. doi: 10.3109/10409238.2010.488215. [DOI] [PMC free article] [PubMed] [Google Scholar]
- Wu Y, Song P, Xu J, Zhang M, Zou MH. Activation of protein phosphatate 2A by palmitate inhibits AMP-activated protein kinase. J Biol Chem. 2007;282:9777–9788. doi: 10.1074/jbc.M608310200. [DOI] [PubMed] [Google Scholar]
- Wyss MT, Jolivet R, Buck A, Magistretti PJ, Weber B. In vivo evidence for lactate as a neuronal energy source. J Neurosci. 2011;31:7477–7485. doi: 10.1523/JNEUROSCI.0415-11.2011. [DOI] [PMC free article] [PubMed] [Google Scholar]